Road transport facts and figures - THE PEP
←
→
Page content transcription
If your browser does not render page correctly, please read the page content below
Introduction | Exploration | Transport | Air pollution • Greenhouse gas emissions • Traffic noise • Physical (in)activity • Road safety | Context | Summary

        Road transport
        facts and figures
         How healthy and environmentally friendly
         is our transport today?

    1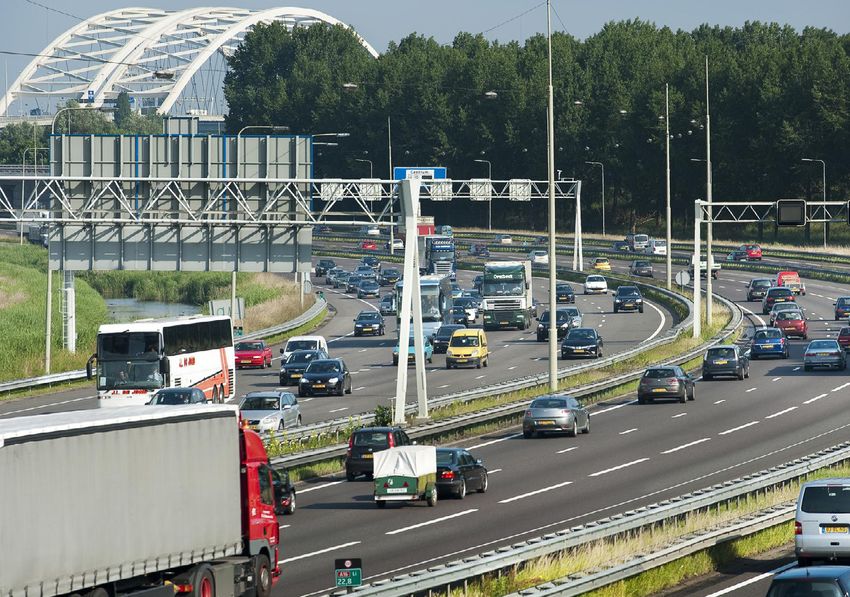
Introduction | Exploration | Transport | Air pollution • Greenhouse gas emissions • Traffic noise • Physical (in)activity • Road safety | Context | Summary

               Contents                          Introduction                                                      03
                                                 Exploration                                                       04
                                                 Transport                                                         08
                                                 Air pollution                                                     16
                                                 Greenhouse gas emissions                                          22
                                                 Traffic noise                                                     27
                                                 Physical (in)activity                                             33
                                                 Road safety                                                       40
                                                 Context                                                           46
                                                 Summary                                                           55
                                                 Acknowledgements                                                  57
                                                 References                                                        58

    2
Introduction | Exploration | Transport | Air pollution • Greenhouse gas emissions • Traffic noise • Physical (in)activity • Road safety | Context | Summary
Introduction
Our current system of policy-making, joint programming and Although some promising trends have further work in the decade to come on
transport and mobility is the exchange of practices. The idea is been observed, traffic-related air transforming the transport sector.
that this eMagazine serves as a joint pollution, noise and road traffic injuries
not sustainable. Traffic is point of reference for further work in still contribute significantly to the Data approach
the cause of several environ- 2020–2030. disease burden in the European region, Multiple data resources have been
mental, economic, social and with a disproportionate disease burden used. For example, on a global scale,
The eMagazine describes what we in certain regions and less affluent data have been used from the
health challenges. In this
know about transport-related environ- groups of society. Motorized road International Monetary Fund (IMF),
eMagazine we describe the mental and health effects in the region transport is also an important source of World Bank, UNECE, International
current impacts of road today. It shows where progress has greenhouse gas emissions. Finally, car Transport Forum (ITF); and on a pan-
been made and where further work dependency, poor use of urban space European level, from the European
transport based on the best
needs to be done. Our story starts with and lack of safety for cyclists and Environmental Agency (EEA), European
knowledge available. some reflections on the main messages pedestrians contribute to physical Free Trade Association (EFTA) and
and challenges, based on interviews inactivity. WHO. Priority has been given to the
This eMagazine has been developed with Francesca Racioppi (WHO), best available data for the specific
under the framework of the Transport, Robert Thaler (Chair of THE PEP) and The eMagazine continues with some themes. Due to the impact of the
Health and Environment Pan-European Khatuna Gogaladze (former Minister contextual descriptions to illuminate COVID-19 pandemic, data have been
Programme (THE PEP), a programme of Environment, Georgia). the differences between countries. used for the year 2019 or most recent
of the United Nations Economic Learning from experiences and putting year available.
Commission for Europe (UNECE) and The actual facts and figures start with a tailor-made policy instruments in place,
the WHO Regional Office for Europe chapter with key facts about transport means also understanding the context. To develop the key messages, topic-
with a focus on road transport, serving patterns and a description of some Differences in economics (gross domes- specific meetings were organized in
and bringing together 56 countries in promising strategies. It shows that tic product (GDP)), income, population 2020 with experts from WHO, EEA,
the UNECE and WHO European region. transport plays an essential role in our density, geographical conditions and UNECE and the National Institute for
The ambition of THE PEP is to acceler- societies and economies. Transport land use are key factors to take into Public Health and the Environment of
ate the transformation of the transport provides access to jobs, education, account, in order to build a programme the Netherlands (RIVM). Where needed,
sector in the decade 2020–2030 to a services, amenities and leisure, while for cooperation and best-fitted approach- an additional evaluation of the litera-
cleaner and healthier system for our contributing to economic growth, es and solutions. Changes in mobility ture was carried out. Contributions to
transport and mobility by bringing employment and trade. At the same due to COVID-19 are also discussed. this eMagazine have been reviewed by
together knowledge from different time, it has an impact on the environ- the experts and the Steering Group of
domains (transport, health and ment and human health. We conclude with a summary of the key THE PEP, looking at the matter in a
environment), working on integrated messages, which can serve as input for more integrated way.
3
Introduction | Exploration | Transport | Air pollution • Greenhouse gas emissions • Traffic noise • Physical (in)activity • Road safety | Context | Summary

Translating solid science into a passion for change
                                                                               Source of a wide variety of                “But”, says Robert Thaler, Chair of the
                                                                               challenges                                 Steering Committee of THE PEP, “when
                                                                               Mobility and transport play an essential   it comes to transport, we are actually
                                                                               role in our societies and economies.       dealing with more than 900 million
                                                                               The sector provides access to jobs,        stakeholders in the UNECE and WHO
                                                                               education, services, amenities and         European region. All residents feel like
                                                                               leisure, while contributing to economic    experts: as road users or passengers of
                                                                               growth, employment and trade. At the       public transport, of course, but also as
                                                                               same time, it has a deep and growing       a citizen who may experience negative
                                                                               impact on the environment and human        impacts – or both at the same time.
                                                                               health. Despite the technological,         Transport has an impact on everyone,
                                                                               political and social progress made, the    which makes the challenge of imple-
                                                                               current transport system and mobility      menting solutions for transport issues
                                                                               patterns remain unsustainable. Traffic     extremely difficult and a hot issue for
This eMagazine is about answering the question: How healthy                    remains the source of a wide range of      politics. There is a gap between the
and environmentally friendly is our transport today? It takes us               challenges at all levels of government.    scientific evidence that we have and
on a journey through facts and figures about the impacts of road                                                          what is actually perceived. Many people
                                                                               Everybody is an expert                     recognize noise as the biggest prob-
transport, different methodologies, strategies and practices for
                                                                               Within THE PEP, facts from research        lem, because they experience the direct
change. Before we dive into the data, let's talk to three experts
                                                                               and practice play a key role. They         relationship between traffic and noise.
who are closely involved in the field of THE PEP. Their vision on              support the efforts of Member States       But it is getting more complicated to
the issue underlines its importance and practical applicability.               when designing policies in the field of    address climate change and related
The facts and figures are not only about quantifying research and              transport, health and environment.         heat waves as a consequence of our
development, but also about smart and widely useful routes for                 These are complex, interrelated and        transport system. And that makes it
improvement. Francesca Racioppi, head of the WHO European                      dynamic themes. This makes it difficult    difficult to gain public support for
Centre for Environment and Health says: “As a scientist, I have                for policy-makers to decide where to       measures to combat emissions”.
                                                                               proceed and how to accelerate
been working on the mobility issue for a quarter of a century. In
                                                                               sustainable change. From a scientific      An uncomfortable truth
that role, you always look for evidence. However, the world does               point of view, we actually know quite      Looking at the facts, we see that there
not change through science alone, but through ambition, brought                well where and how we could make           is work to be done. When it comes
with passion. That is what we now advocate with THE PEP: we                    transport healthier, safer and more        to air pollution from road traffic, the
need to translate solid science into the passion for change”.                  environmentally friendly.                  impacts of air pollution by particulate

    4
Introduction | Exploration | Transport | Air pollution • Greenhouse gas emissions • Traffic noise • Physical (in)activity • Road safety | Context | Summary
matter and nitrogen dioxide (NO2) transport. About her time as minister, gaps in data availability and quality, number of city dwellers are positive
– typically associated with vehicle she says: “We were working on an which are important for a better about change and want to embrace it”.
exhaust emissions – have decreased ambitious strategic document and understanding and comparison of data
due to policy measures like setting action plan to reduce air pollution between countries. Thus, there is New mobility from Lisbon to Moscow
improved fuel quality- and emission from transport. In the end, the plan plenty of room for improvement here. So there is movement and it extends
standards. Yet, for the whole of the was drawn up, but I remember how everywhere, Thaler notes. “European
WHO European Region, WHO estima complicated it was to persuade Setting the scene for a different cities look at each other, find interest-
ted 509 000 premature deaths in 2016. economic sector ministries to support future ing examples for a different approach
Road accidents contribute to more it. They argued that proposed mea Francesca Racioppi recognizes what and set to work. As a result, you see
than 110 000 deaths every year in the sures, such as replacing old cars, would Gogaladze and Thaler are saying: more and more cities with, for example,
region. On average, this means one harm poor people and may affect “For the most part, there is a common a bicycle sharing plan. In Rome and
person is killed every five minutes. negatively the self-employed, for understanding of what the right things Moscow you will find bicycle sharing
At the same time, millions more are example taxi drivers. It was difficult are to do, but it remains very difficult to these days”. At the same time, it is also
seriously injured in road accidents. In to justify that poor environmental actually do them. But things have clear that there is still a long way to go.
addition, road transport is responsible conditions increase inequality, and changed in recent years. In urban Cars remain by far the main means
for about a quarter of energy-related low income people suffer more from regeneration, more and more cities are of transport if we look at the total
greenhouse gas emissions, thus unhealthy air: they live in densely considering cycling and walking as of kilometres travelled. Khatuna
contributing to climate change and populated parts of the city with limited modes of transport, and quality of life Gogaladze says: “A lot has to do with
increased global temperature. So green spaces and they do not have is being taken seriously. Some cities behaviour and habit. A recent study
what prevents us from taking more summer houses where they can let have even made a real U-turn: Utrecht shows that 20% of Georgians prefer to
appropriate and effective actions? their children enjoy the outdoors”. in the Netherlands is an important take the car, even for distances shorter
example. There they had the courage than 1.5 km”. This, she believes, is
Facts and assumptions Data availability and quality to transform an inner-city motorway partly due to the lack of infrastructure.
Khatuna Gogaladze has worked for To allow for effective monitoring of into a waterway and city park, giving “Take our capital, Tbilisi, where about
various international organizations in the impacts of transport and sound back to people public space that can 1.3 million of Georgia's 3.7 million
different capacities as well as for the decision-making, harmonized data on be used to be more physically active, inhabitants live. It is fully equipped for
Ministry of Environment and Natural transport, environment and health is to enjoy the health benefits of blue car traffic. A cycle path has been built
Resources Protection of Georgia – crucial. For all the themes addressed and green spaces and to improve in a few streets, but what are you
serving as minister in 2012–2014. in this eMagazine, data is available the quality of life in the city. This is the supposed to do after that 1 km? Hang
As a minister, she has experienced that at all levels of government, at our challenge: to make people a bit more your bike around your neck? ”
it is quite a struggle to rank facts before institutions and in the private sector. courageous and to get policy-makers
assumptions in the area of traffic and However, there are also significant to look at the long-term. A growing
5
Introduction | Exploration | Transport | Air pollution • Greenhouse gas emissions • Traffic noise • Physical (in)activity • Road safety | Context | Summary
Taking stock of the lessons of is no longer sacred and multimodality increased productivity and lower In Austria, where Thaler is Head of the
the crisis is developing. For the young genera- health-care costs related to non Division of Active Mobility and Mobility
According to Gogaladze, the assump- tion digital access by smartphone is communicable diseases. This shows, Management in the Federal Ministry of
tion has always been that Tblisi's hilly much more important than having for example, a strong case for Climate Action, Environment, Energy,
terrain is not suited very well for a car. Sharing is the key word here investing in promoting walking and Mobility, Innovation and Technology,
cycling. However, this assumption was and sharing systems are growing. cycling in cities and beyond. Francesca the instrument is used to shape
challenged last spring, when COVID-19 Nevertheless, beyond that, there is Racioppi also points to another, less cycling policy. Thaler: “THE PEP and its
responses brought car traffic and often excessive car use in the outskirts quantifiable, potential yield: “We all partnerships are enabling the sharing
public transport to a standstill. “It was and rural areas; here in Austria it is the have one life to live. Who is happy to of an enormous amount of practical
very surprising how many people then most peripheral areas that have the spend hours in traffic jams every day knowledge of clean and active mobility
turned out to have a bicycle and used it highest degree of car ownership, or to breathe bad air? It is not without that can be used by Member States in
to the full, now that it was safe. With a because of poor public transport. Take, reason that more and more young their strategic initiatives and concrete
better infrastructure and, for example, for example, the city of Vienna, which people no longer have owning a car work”.
a strong campaign to emphasize the has a perfect balanced modal split with as a priority – something that was
economic, health and environmental more than 70% of Viennese people unthinkable for a long time. In that Multidisciplinary approach
benefits of cycling and active mobility using walking, cycling and public respect, we are facing a great Racioppi, Gogaladze and Thaler agree
in general, I see room for improve- transport. However, if you then look opportunity in that things can be on the important contribution THE PEP
ment. There is a lot of work to be done at the commuter traffic by people done differently and better”. can make to the transformation of
if we want to encourage people to from outside Vienna, it is almost the transport. Transforming the sector
switch to public transport or bicycles opposite and is dominated by the car. Practical knowledge put to use requires a multidisciplinary approach.
more often. Public transport, for We really have to work on a fair balance That there is a different and better Therefore, collaboration of decision-
example, must be comfortable, between regions and cities when it approach possible can be proven with makers and experts in transport,
convenient and have good connectivity comes to environmentally sound data. Robert Thaler: “For example, I environment, health, spatial planning
to make it competitive with private mobility choices”. consider the development of the Health and economy is crucial to design
cars. Otherwise it will be difficult to Economic Assessment Tool (HEAT) for transport-related policies that deliver
achieve behavioural change”. One life to live walking and for cycling a major success benefits to environment, health,
The facts and figures show that of THE PEP. In that project, an inter well-being and climate simultaneously.
Tailor-made solutions are needed investing in healthier and safer national coalition of scientists made
Robert Thaler also points out the mobility pays off in many ways. The it possible to provide hard evidence Moreover, international, cross-sectoral
difference between the cities and the benefits of a shift towards more active of the health and economic benefits and multi-level (countries, regions and
regions. “In the cities you see the mobility and public transport arise of walking and cycling. That has now cities) cooperation is needed to drive
movement that the position of the car mainly from increased life expectancy, really been made measurable”. the change towards sustainable,
6
Introduction | Exploration | Transport | Air pollution • Greenhouse gas emissions • Traffic noise • Physical (in)activity • Road safety | Context | Summary

                                                                                   and to test new solutions. For example,
                                                                                   we have organized many workshops
                                                                                   and trainings with numerous countries,
                                                                                   where participants have experienced
                                                                                   that much more is possible than
                                                                                   initially assumed. By trial and error,
                                                                                   you can actually see that things can
                                                                                   be done differently. That facilitates
                                                                                   and promotes change”.

                                                                                   Khatuna Gogaladze also sees the
                                                                                   power of THE PEP in experimenting
                                                                                   and bringing different sectors together.
                                                                                   “Integrating transport, health, environ-
                                                                                   mental and quality of life objectives
                                                                                   into urban or any other development
                                                                                   policies is the way forward. THE PEP
                                                                                   gives the opportunity to countries to
                                                                                   learn from each other. It produces clear
                                                                                   recommendations and equips coun-
environmentally friendly and healthy      in public space. It's about the          tries with useful tools. It is up to us how
transport. Robert Thaler: “This inter-    combination of mobility management,      we use these opportunities and
sectoral approach is very important.      pricing, technology and user             whether we follow the path paved by
There is too much silo thinking. THE      perspective”.                            other countries”. Thaler adds: “That is
PEP brings together sectors that often                                             indeed attractive about THE PEP. We
oppose each other. That is also what      Inspire and raise awareness              work as partners on real products and
we need: we need the full picture for     Francesca Racioppi sees THE PEP as       that is a lot more pleasant than just
a holistic approach and not just the      a joint platform for inspiration and     talking and producing paper. Countries
classic technological perspective.        change. “THE PEP brings together         that are actively involved in THE PEP
Technology always has a drawback.         a wide community of people, which        really get something in return.”
Take, for instance, electric cars. This   normally would not meet each other
does not solve the space problems         and are eager to learn from each other

     7
Introduction | Exploration | Transport | Air pollution • Greenhouse gas emissions • Traffic noise • Physical (in)activity • Road safety | Context | Summary

 Transport and mobility
   Transport is about moving people and goods in the most effective and
   efficient way. Transport is not a purpose in itself; it is in support of other
   activities like working, socializing or studying and, as such, is an integrated
   part of our daily life. For many transport professionals, accessibility and
   tackling congestion are the main challenges, giving priority to the work on
   appropriate infrastructure investments, with efforts on capacity, reliability and
   efficiency. Regulatory and policy frameworks are guiding vehicle emissions
   and use of space and safety. Moreover, transport professionals work on the
   demand and supply for transport, with factors like travel time, convenience
   and pricing. Nowadays, there is a growing support for multimodality and safe
   and attractive spaces for walking and cycling.

    8
Introduction | Exploration | Transport | Air pollution • Greenhouse gas emissions • Traffic noise • Physical (in)activity • Road safety | Context | Summary

The challenge
The growing demand for mobility             is changing, mobility will increase as     region, with the highest cycling shares       and walk more than the national
Mobility is an essential part of modern     more people and goods move across          in the Netherlands and Denmark, and           average.
society; it has a positive impact on        towns and across the globe.                the highest walking shares in Spain.
prosperity and well-being. Every day                                                                                                 Even in the cycling countries, a further
billions of trips are made worldwide.       Different cities, different options        In 2016, the modal share of cycling in        growth is possible. Expanding dedi-
For example, on average European            Worldwide, about 7.5 billion trips were    the Netherlands was 27% of all trips          cated cycling lanes, mass bike parkings
Union (EU) citizens travel 12 000 km        made every day in urban areas in 2005.     made, and this was 7% for Austria (2).        at train stations, high-speed bicycle
per year.                                   The share of daily trips made by public    In many countries the share of cycling        connections between urban and
                                            transport was about 16%, walking           is much lower though (1–2%).                  peri-urban areas, as well as fiscal
In the next decades, most scenarios         and cycling about 37%, and private         Although these numbers appear low,            incentives and cycle-promoting
predict a continuously growing world        motorized cars about 47%.                  many cities have seen a growth in             programmes of employers, are
population, an increase in welfare and                                                 cycling in recent years. In cities with       just some of the stimulating examples
further changing mobility and trans-        Cycling and walking shares differ          a dense public transport network and          for a further growth in cycling.
port patterns. The world of transport       across the UNECE and WHO European          a safe cycling network, people cycle

The projected growth of the transport sector

   +50% +70% +1.2bil.
  By 2030, annual passenger traffic will    By 2030, global freight volumes have      By 2050, an additional 1.2 billion cars will
  exceed 80 trillion passenger-kilometres   grown by 70% compared to 2015.            be on the road – double today’s total.
  – a 50% increase compared to 2015.

Source: Sustainable Mobility for All (1).

       9
Introduction | Exploration | Transport | Air pollution • Greenhouse gas emissions • Traffic noise • Physical (in)activity • Road safety | Context | Summary
Evolving challenges for transport It should be noted that the “predict and This approach should encompass a the further growth of unsustainable
professionals provide” approach is still widely used in key role for more conscious consumer forms of mobility. Spatial planning that
What is the best way to travel between a number of countries at the state level choice regarding modes of travel. favours a dense public transport
A and B? That is a key question for and has not yet become “a thing of For this, the mobility system must network, safe and attractive cycling and
many transport planners, researchers the past”. In some cases, or in some be coherent and robust, and all the walking paths and combines functions
and policy-makers. Their work is to countries (e.g. when the road infra- modalities must be sufficiently (housing, working, services) contributes
understand mobility, from both a structure is not sufficiently developed), solid to form convenient, reliable and to sustainable mobility.
traveller (travel time, distance travelled, this approach may be justified. affordable alternatives. This approach
reliability, comfort and experience) and can be supported by mobility manage- Compared space-time consumption
systemsperspective (accessibility, In current policies, the emphasis is ment measures like teleworking, rush Cars and roads take up a lot of the
investments and land use) at accept- shifting again. Nowadays, the approach hour avoidance and an increasing public space in cities: a car occupies
able costs and benefits for society. is often to provide multimodal acces- role for digital services (Mobility as 2.5 times more space than a cyclist
sibility and to limit the negative impacts a Service). Finally, an increasingly does, 5 times more than a pedes-
Mobility policy used to be based on a of car mobility, by facilitating high important role has been set aside trian and 10 times more than a user
“predict and provide” approach, which quality alternatives to mobility by car. for spatial planning in the limitation of of public transport at peak hours.
identified bottlenecks, set priorities
and, as far as possible, expanded road
and rail capacity. In this context, modes Space differences compared to pedestrian
like public transport mainly had a social
5 5
function. When interests in the
development of land use began to play 2
1 1.4 1.4
a part, this approach came under 0.5 0.5
increasing pressure. As a result, the
perception changed; the growing
mobility no longer had to be merely Pedestrian Cyclist Two-wheeled Car Bus (12m) Articulated bus (18m)
motor vehicles
facilitated. People started to think of Peak hour Peak hour
how to shape mobility to improve m2-h/vehicle km 0.3 0.6 1.7 1.8 7 7 10 10
accessibility while reducing the costs Occupation rate 1 1 1.05 1.3 17 50 23 70
and negative impacts. At that time, in
m -h/traveller km 0.3
2
0.6 1.6 1.4 0.3 0.15 0.3 0.15
many countries, the realization of a
modal shift from car to public transport
Note: The traffic demand for space-time of circulation is expressed in square meters per hour (m2-h).
became one of the leading policy
objectives. Source: International Transport Forum (3).
10Introduction | Exploration | Transport | Air pollution • Greenhouse gas emissions • Traffic noise • Physical (in)activity • Road safety | Context | Summary
Modal split in passenger- and freight transport
Passenger transport
The car remains the main mode of
transport across the wider UNECE
Cars Railways Motor coaches, trolleybuses and buses
and WHO European region. UNECE
data shows that the share of passenger
transport by car, expressed as the
percentage of the total passenger- Share of passenger road vehicle transport
kilometres travelled in that year, in % of the total km travelled for the EU-28
decreased slightly between 2000 and 2018
2018 in the region as a whole, and
83.3% 8.0% 8.7%
increased slightly in that same period
in the EU-28 Member States. The
figures show that car use remained 2000
dominant throughout the period. 82.5% 7.1% 10.4%
In contrast, for example in a country
like Germany, a quarter of all trips Source: Based on EEA (4).
are made on foot. However, since the
distance travelled on foot is limited,
the contribution to total kilometres Share of passenger road vehicle transport
travelled is limited (4). in % of the total km travelled for the UNECE region
2018
89.0% 2.3% 8.0%
2000
93.0% 1.6% 5.0%
Note: Differences have been rounded because of aggregated data from different sources.
Source: UNECE (5).
11Introduction | Exploration | Transport | Air pollution • Greenhouse gas emissions • Traffic noise • Physical (in)activity • Road safety | Context | Summary
Mobility in urban areas Mobility in urban areas: different modal splits in cities and in their larger urban zones in 2018
The figure shows the modal split in
Modal share In the city centre
10 different urban areas in number of of journeys
In the broader urban area
trips made. It shows the variety of
modal shares between different cities % % %
cycling/walking public transport rest motorized modes
and shows differences within cities.
Most walking and cycling took place in Amsterdam 58% 16% 26%
the inner city, and a larger share of car 49% 13% 34%
mobility was in the broader urban area.
It also shows that in cities with a higher Barcelona 55% 30% 15%
44% 18% 36%
share in bike-ridership, the use of
public transport has lower shares of
Berlin 42% 25% 33%
trips made.
37% 19% 44%
Oslo 34% 36% 31%
27% 28% 45%
Madrid 35% 34% 31%
34% 25% 40%
London 28% 37% 36%
28% 37% 36%
Copenhagen 63% 13% 24%
41% 10% 49%
Warsaw 21% 47% 32%
25% 40% 35%
Helsinki 44% 31% 25%
38% 22% 39%
Source: Based on EMTA (6).
12Introduction | Exploration | Transport | Air pollution • Greenhouse gas emissions • Traffic noise • Physical (in)activity • Road safety | Context | Summary
Modal split freight Modal split freight
Total land freight transport by road,
rail and waterways has grown steadily, 2500 100
as a result of economic growth and
global trade in most countries of the
region with a short dip caused by the
2008 financial crisis. In the EU, for 2000 80
example, the total road freight
Share of freight transported (%)
volumes in 2017 were around one
Billion tonne-kilometres (tkm)
100
quarter higher than in 2000. The
amount of freight transported by rail 1500 60
in the EU-28 has grown during recent
Modal split between freight
years, but is still below the peak 80 transported by road and rail
recorded in 2007. In 2017, rail freight in billion tonne-kilometres (tkm
1000 40 Rail
transport demand increased by 2.2%
Share of freight transported (%)
100
Inland waterways
compared with the previous year. Road
60
The amount of freight transported Freight transport volume by ro
500 Modal split between freight 20
by inland waterways was stable in 80
transported by road and rail
and modal split within the EU (
the EU-28. in billion tonne-kilometres (tkm) Road EU-28
Rail EU-28
Share of freight transported (%)
40 Rail
Inland waterways
0 Road 0
60 ‘95 ‘00 ‘01 ‘02 ‘03 ‘04 ‘05 ‘06 ‘07 ‘08 ‘09 ‘10 ‘11 ‘12 ‘13 ‘14 ‘15 ‘16 ‘17
Modal split between freight 20 Freight transport volume by road
transported by road and rail and modal split within the EU (%)
in billion tonne-kilometres (tkm) Road EU-28
40 Rail Rail EU-28
Inland waterways
Road
0
‘00 ‘01 ‘02 ‘03 ‘04 ‘05 ‘06 ‘07 ‘08 ‘09 ‘10 ‘11 ‘12 ‘13 ‘14 ‘15 ‘16 ‘17
Source: EEA (4).
20 Freight transport volume by road
and modal split within the EU (%)
Road EU-28
Rail EU-28
0
07 ‘08 ‘09 ‘10 ‘11 ‘12 ‘13 ‘14 ‘15 ‘16 ‘17
13Introduction | Exploration | Transport | Air pollution • Greenhouse gas emissions • Traffic noise • Physical (in)activity • Road safety | Context | Summary
Perspectives
Safe, healthy and affordable solutions walking, related to new concepts for To “shift” is to move towards environ- Their report on first/last/only mile
are available – just not widely imple- urban development. mentally friendly modes of transport, options for passenger and freight
mented. Moreover, there is a rich range which is about walking, cycling or transport, describes urban mobility
of resources on sustainable mobility The “Avoid-Shift-Improve” public transport. Finally, to “improve”, and policy contexts and presents the
and transport. We have selected a few strategy is about occupancy rate, about vehicle current state of knowledge. This is a
key approaches, strategic concepts and In the 1990s, the “Avoid-Shift-Improve” and energy efficiency and about data good reference for all professionals
trends for the transformation of the strategy was introduced by the German sources on travel information. working on, for example, parking and
sector, to inspire those who would like government in order to provide a cycling policies, environmental zones
to work on the alternatives. We see concept to deliver on sustainable The first and the last mile and the role of micro-mobility in cities.
changes in mobility management transport goals (7). To “avoid” is about Making a transport system efficient
approaches, other transport options reducing the length and the number means bringing together people or Building back better with a
in cities (last mile options) and an of trips, and making it easier to goods as early as possible in their “15-minute city”
increasing attention on cycling and avoid travel, like working from home. journey (8). Transporting them sepa- In a “15-minute city”, everyone is able
rately implies a loss of efficiency and to meet most, if not all, of their
often increases negative environmental needs within a short walk or bike ride
Avoid-Shift-Improve approach impacts. However, people or goods from their home (9). This helps to
rarely travel only between two mass reduce unnecessary travel across cities,
transport hubs or stops. That is where provides more public space, injects life
studying the first and last mile options into local high streets, strengthens the
Avoid/Reduce Shift/Maintain Improve come in. Such options allow people or sense of community, promotes health
goods to travel between their starting and well-being, boosts resilience to
point (origin) and the start hub and/ ill-health and climate shocks, and
Reduce or Shift to maintain Improve the energy or between the end hub and their improves cities’ sustainability and
avoid the need share of more of transport
destination. At the same time, they liveability.
to travel environmentally modes and vehicle
friendly modes technology make the transport system as efficient
as possible from a financial, resource
use and environmental point of view,
while meeting any convenience
System Trip Vehicle requirements. The EEA (9) has
efficiency efficiency efficiency conducted some excellent work on
understanding this concept better.
Source: Based on Deutsche Gesellschaft für Internationale Zusammenarbeit (GIZ) (7).
14Introduction | Exploration | Transport | Air pollution • Greenhouse gas emissions • Traffic noise • Physical (in)activity • Road safety | Context | Summary
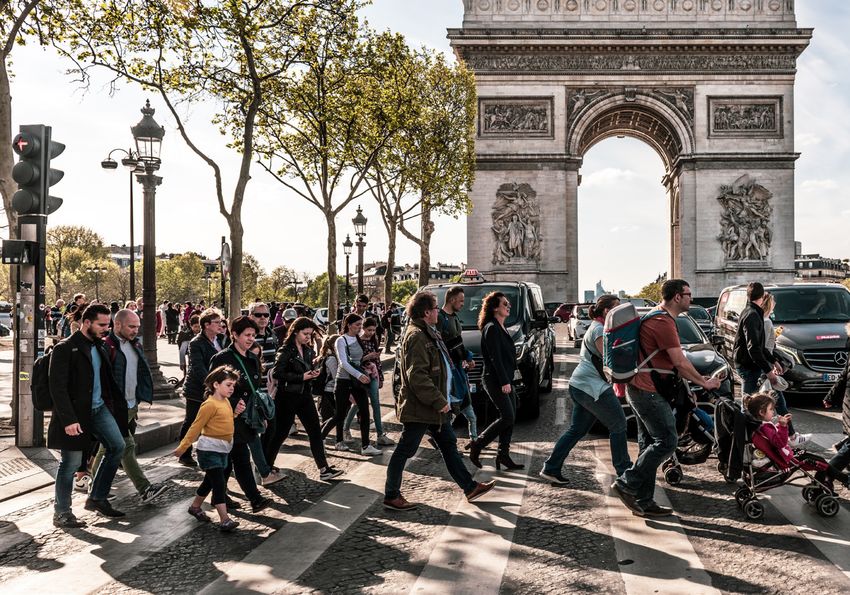
The core principles of a 15-minute city At the same time, new technologies Expected number of electric car models available in Europe
are that residents of all neighbourhoods: create new impacts on urban planning, in late 2019 and in 2021
• have easy access by foot or bicycle health and the environment. A shift
to essential living needs; towards electric cars does not provide End of 2019 2021
• have a variety of housing types, of the health benefits of shifting to active
different sizes and levels of afford transport. To maximize the benefits of
ability, to accommodate many types a real sustainable system, indirect
of households and enable more people effects should be addressed at an early Total 98 214
to live closer to where they work; stage (e.g. improving the composition
• are able to breathe clean air, free of batteries, working conditions in
of harmful air pollutants; manufacturing and the energy used).
• have green spaces for everyone The uptake of electric vehicles should Volkswagen Group 23 41
to enjoy; ideally go hand in hand with policy
Daimler 14 23
• have smaller-scale offices, retail and approaches on the well-to-wheels chain
hospitality, and co-working spaces (resources), circular economy (produc- BMW Group 12 21
so that more people can work close tion methods and recycling), energy Hyundai-Kia 12 18
to home or remotely. transition (source of power, energy
efficiency) and active transport. Peugeot-Citroen-Opel 9 17
The rise of electric vehicles Renault-Nissan-
7 17
Mitsubishi
A pathway towards zero-emission The latest figures on charging stations
solutions has evolved through the (https://www.eafo.eu) give an impres- Volvo-Geely 6 16
introduction of electric vehicles, with sion of the emerging market for electric Jaguar-Land Rover 5 16
also ”shift” potential of electrification cars in our region. Nowadays, all car
Tesla 4 15
in public transport, rail freight, motor- manufacturers offer electric models
cycles and bikes. This represents a and countries are stimulating the roll Toyota-Lexus 4 13
significant turning point towards an out of the required charging
Ford 1 8
irreversible end to the use of fossil fuels infrastructure.
in transport. Others 1 5
Fiat Chrysler 4
* Includes
Note: Includes plug-in hybrid and plug-in
fully electric hybrid and fully electric models
models.
Source: Reproduced under creative commons from Transport and Environment (10).
15Introduction | Exploration | Transport | Air pollution • Greenhouse gas emissions • Traffic noise • Physical (in)activity • Road safety | Context | Summary
Air pollution
Road transport leads to both exhaust and non-exhaust (brake, tyre, road wear)
emissions of air pollutants. Air pollution is a major cause of premature death
and disease and is the single largest environmental health risk in Europe.
WHO provides guideline values to protect health, which will be revised in the
near future. However, current concentration levels are generally above these
recommended guideline levels. Emissions from transport have decreased, but
passenger and freight volumes have been gradually increasing. Still, in 2018,
74% of the EU urban population breathed air that exceeded the particulate
matter 2.5 micron (PM2.5) WHO Air Quality Guideline (AQG); 99% was exposed
to ozone levels above WHO AQG. Traffic-related air pollution also has negative
impacts on ecosystems. Additional reduction measures can further improve
human health, especially within urban areas.
16Introduction | Exploration | Transport | Air pollution • Greenhouse gas emissions • Traffic noise • Physical (in)activity • Road safety | Context | Summary
EEA category Origin
Passenger cars
Engine exhaust
Light duty vehicles
Heavy duty vehicles and buses Tyre and brake wear
Mopeds and motorcycles
What we know Other road transport Road abrasion
Emissions from road traffic Emissions from road transport in 2018 (% per air pollutant)
Road transport leads to both exhaust
and non-exhaust (brake, tyre, road PM10 PM2.5
EEA category Orig
wear) emissions of air pollutants (11).
66% 16% 48% 25% Passenger cars
The most important emissions are
Light duty vehicles
particulate matter (black carbon,
Heavy duty vehicles and buses
primary PM2.5, primary PM10), nitrogen 8% Mopeds and motorcycles
oxides (NOx), and non-methane volatile Other road transport
organic compounds (NMVOC). Primary 9% 11%
pollutants are directly emitted to the 1% Emissions from road transport in 2018 (% per
atmosphere, whereas secondary 14%
pollutants are formed in the atmos- 2% PM10
EEA category Origin
phere through chemical reactions and
NOx NMVOC
Passenger cars 66% 16%
microphysical processes from gaseous Engine exhaust
Light duty vehicles
precursors. NOx emissions determine
Heavy duty vehicles and buses Tyre and brake wear
the population exposure to NO2, but 32% 1% 48% 29%Mopeds and motorcycles
39% 8%
also contribute to the formation of Road abrasion
Other road transport
secondary PM2.5 and PM10 and, 9%
together with NMVOC, to ozone Emissions from road transport in 2018 (% per air pollutant) 1%
formation (12).
PM10 PM2.5
For long-term exposure, particulate
NOx
matter (measured and modelled as 19% 66% 6% 16% 48% 25%
black carbon, PM2.5 and PM10) and 19% 7%
NO2 are the most used indicators for 8% 32% 1% 48%
the air pollution mixture. For short- Source: Based on EEA (13).
term exposure, ozone is a relevant air 9% 11%
pollutant generated in the atmosphere 1%
from emissions of its precursors
14%
including those from road traffic. 2%
NOx NMVOC
19%
32% 1% 48% 29% 39%
17Introduction | Exploration | Transport | Air pollution • Greenhouse gas emissions • Traffic noise • Physical (in)activity • Road safety | Context | Summary
Development in emissions of pollutants
160
140
120
Index (% of 2000)
100 Black carbon
Carbon monoxide
80
NMVOC
60 NOX
PM2.5
40
PM10
20 Passenger
transport
0 Freight
transport
2000 2002 2004 2006 2008 2010 2012 2014 2016 2018
Note: Only pollutants are shown for which road transport contributed more than 5% of the total EU-28
emissions in 2018. For comparison, passenger transport (pkm) and freight transport (tkm) are shown.
Source: Reproduced from EEA (12).
18Introduction | Exploration | Transport | Air pollution • Greenhouse gas emissions • Traffic noise • Physical (in)activity • Road safety | Context | Summary
The impact
Health effects are emitted near breathing height. Vulnerable groups and health effects of air pollution
Air pollution is a major cause of Emissions from transport have
premature death and disease and is the decreased, but volumes of passenger Who is more affected
single largest environmental health risk and road freight transport have been
in Europe. Heart disease and stroke are gradually increasing. In 2018, a
the most common reasons for the prema- significant proportion of agricultural
ture deaths attributable to air pollution, areas and natural ecosystems were
followed by lung diseases and lung damaged by air pollution. The air
cancer (12). The exposure burden of pollutants that currently cause most People with chronic lung/ Elderly Children Pregnant Deprived (urban)
higher pollutants falls disproportion- damage to ecosystems are ozone, heart disease, diabetes women communities
ally on different social groups (14). The ammonia and NOX. Ground-level ozone
Mortality Morbidity
International Agency for Research on can damage crops, forests and other
Premature death Reduced lung function,
Cancer has classified air pollution in vegetation, impairing their growth and
due to heart respiratory infections and
general, as well as particulate matter affecting biodiversity. The deposition disease and stroke aggravated asthma and
as a major component of air pollution of nitrogen compounds can cause chronic bronchitis in both
children and adults
mixtures, as carcinogenic. eutrophication, an oversupply of
Premature death Hospitalizations with
nutrients. Eutrophication can affect
due to lung disease cardiovascular disease or
Exposure and impacts on ecosystems terrestrial and aquatic ecosystems and and lung cancer respiratory disease
Transport continues to be a significant leads to changes in species diversity
source of harmful air pollution, and invasions by new species. Impact on fertility,
Post-neonatal death pregnancy, newborns
especially as NO2 and particulate matter (age 1–12 months) and children
Health effects of air pollution (2018) Type 2 diabetes, obesity,
systemic inflammation
PM2.5 NO2 Ozone
Estimated Years of Estimated Years of Estimated Years of Alzheimer's disease
premature life lost premature life lost premature life lost and dementia
deaths deaths deaths
EU-28 379 000 4 381 000 54 000 610 000 19 400 232 000 Sources: Based on WHO Regional Office for Europe (15) and EEA (12).
41 countries 417 000 4 806 000 55 000 624 000 20 600 247 000
covered by the EEA
Source: Adapted from EEA (12).
19Introduction | Exploration | Transport | Air pollution • Greenhouse gas emissions • Traffic noise • Physical (in)activity • Road safety | Context | Summary
What are we facing?
Air pollution concentration levels are Premature deaths attributable to Percentage of the population exposed to concentrations
generally above the guideline levels exposure to ground-level ozone have above certain air pollution levels
recommended by WHO. For example, increased by 20% in the 41 countries
in 2018, 74% of the EU urban popula- covered by the EEA, and by 24% in 2018 EU-28 urban Urban population Reporting stations Reporting stations
population expo- exposure to that registered that registered
tion breathed air that exceeded the the EU-28. sure to concen- concentrations concentrations concentrations
trations above above WHO AQG above EU above WHO AQG
PM2.5 WHO AQG; 99% was exposed to EU standards (a) value standards (a) value
ozone levels above the WHO AQG. A switch to electric vehicles will not
The high exposure to air pollutants of solve the problem of particulate matter, PM10 15% 48% 19% 53%
people living along busy roads is not since other sources (asphalt, tyres,
reflected in the average exposure of industry, agriculture and natural
the population. sources) also contribute to particulate 20 EU Member All countries except
States and 6 other Estonia, Iceland and
matter exposure. countries Ireland
Although exposure levels and impacts
from particulate matter and NO2 have PM2.5 4% 74% 4% 70%
decreased, air pollution still has a
significant health impact and is the
6 EU Member All countries except
single largest environmental risk in States and 2 other Estonia, Finland
Europe. For the whole of the WHO countries Iceland and Ireland
European Region, WHO estimates that 34% 99% 41% 96%
O3
509 000 premature deaths per year are
attributable to ambient air pollution,
measured as particulate matter of 20 EU Member States
2.5 microns in aerodynamic diameter and 5 other countries
(PM2.5) in 2016 (16). The EEA estimates
4% 4% 8% 8%
that attributable to PM2.5 417 000 died NO2
prematurely and over 4.8 million years
of life were lost every year based on
16 EU Member 16 EU Member
2018 data covering 41 countries (12). States and 3 other States and 3 other
(b) (b) countries (b) countries (b)
The estimated numbers of premature (a) Thefollowing
The
(a) following EU
EU standards
standardsare
areconsidered:
considered:PMPM
10
daily limitlimit
daily
10
value,
value, PM 2.5
annual limit value,
PM annual limit value, O target value, NO annual limit value.
deaths attributed to PM2.5 and to O3 target
2.5
value, NO2 annual3
limit value. 2
(bFor
) ForNO
(b) NO22,,the
the EU annuallimit
EU annual limitvalue
value and
and the
the WHO
WHO AQG
AQG are are the same.
the same.
NO2-exposure have declined since 2009
by 13% and 56% respectively. Source: Based on EEA (12).
20Introduction | Exploration | Transport | Air pollution • Greenhouse gas emissions • Traffic noise • Physical (in)activity • Road safety | Context | Summary
Perspective on solutions A combined effort in urban planning, technical measures, regulation
and changes in behaviour is urgently needed to reduce air pollution.
Less/cleaner emissions Modal shift
Reduce journey times
of public transport
The elimination of polluting vehicles
Low emission zone and the increase in electric vehicles
will reduce air pollution emissions.
Governments can reduce air pollution by
emission regulation and policies to stimulate
the use of cleaner alternatives. Cities and
regions can develop urban policies that reduce
car use (e.g. compact cities or 15-minute cities).
Use of bio- Reduce Change the Minimize the availability of
fuels or move traffic density vehicle fleet parking places
towards zero- (less old cars) Synergetic and
emissions antagonistic effects
?
Introducing zero-emission
vehicles may lead to an increase
in emissions from the energy
Promote Change the Reduce lanes supply sector.
active allocation of the for cars
mobility roads permanently:
Encourage higher penetration Limit
of cleaner (Euro 6/electric) cars traffic speed
Increase space for
Promote public transport
cyclists and public
100
80 transport
Replace parking
places with green
areas for recreation
Source: Adapted from EEA (12).
21Introduction | Exploration | Transport | Air pollution • Greenhouse gas emissions • Traffic noise • Physical (in)activity • Road safety | Context | Summary
Greenhouse gas emissions
Greenhouse gas emissions contribute to climate change. The energy use of
road transport is one of the largest contributors to greenhouse gas emissions,
responsible for about 20% of all such emissions in 2018 for the EU alone. On a
global scale, transport emits around 23% of the energy-related carbon dioxide
(CO2) that feeds global warming. Without immediate action, its share could
reach 40% by 2030. Currently, the rise in transport volumes outweighs
improvements in vehicle energy efficiency. Without a global decrease in the
use of fossil fuels, temperatures will further rise with worldwide effects. The
projected increase in greenhouse gas emissions will lead to more damage to
our environment, our homes, and the health and well-being of our citizens.
As signatories of the Paris Agreement on climate change, all UNECE and WHO
European region countries have committed to contribute to global efforts to
limit climate change to below 2 ºC.
22Introduction | Exploration | Transport | Air pollution • Greenhouse gas emissions • Traffic noise • Physical (in)activity • Road safety | Context | Summary
What we know
Energy use of road transport is greenhouse gases emitted by vehicles transport modes. The largest increases Greenhouse gases emitted differ
one of the largest contributors are CO2 and methane (CH4). up to 2030 are projected for the aviation between specific fossil fuels types used
of greenhouse gases sector, followed by international in road transport. Diesel causes less
The use of fossil fuel in transport Between 1990 and 2018, greenhouse maritime transport. These sub-sectors carbon emissions per kilometre than
causes greenhouse gas emissions. gas emissions from road transport are therefore expected to constitute a petrol, but causes more emissions of
Amounts are influenced by vehicle- increased in most countries. In parti higher proportion of transport sector air pollutants. In 2018, the sales of
kilometres driven on the one hand and cular, in the EU they increased by 20%. emissions in the coming years. The petrol cars exceeded those of diesel
improvements in energy efficiency This was due to a rise in transport number of vehicle-kilometres is still cars (60%/40%).
of vehicles on the other. The main volumes that has outweighed improve- growing and is projected to grow for the
ments in vehicle efficiency. Emissions next 20 years due to increasing incomes
Road transport emissions from maritime transport and aviation and trade, despite the current dip
have also increased since 1990. because of COVID-19 measures.
Road transport emissions showed a
decline between 2007 and 2013 due Direct emissions Indirect emissions
Direct emissions
Light duty Motorcycles Passenger
vehicles cars to the economic recession, high oil 900900
1%
12% 60% prices and improvements in energy
800800
efficiency. But, due to economic growth
Million tonnes CO2 equivalents
and declining oil prices, emissions 700700
increased again between 2013 and 600600
Greenhouse gas 2017; transport was the fastest
emissions from road growing source of greenhouse gas 500500
transport 400
emissions in the EU. While green- 400
house gas emissions declined in most 300
300
sectors in the EU in these years,
200
emissions from transport increased. 200
Heavy duty 100
vehicles 100
27% Road transport constitutes the highest 0
0 1990 1992 1994 1996 1998 2000 2002 2004 2006 2008 2010 2012 2014 2016 2018
proportion of overall transport
1990 1992 1994 1996 1998 2000 2002 2004 2006 2008 2010 2012 2014 2016 2018
Number of years
emissions (around 71% in 2018), but
this is projected to decrease in the Transportation Industry Residential Commercial Other sectors
next 15 years, since road transport
Source: Based on EEA (17). decarbonizes faster than the other Source: Based on EEA (18).
23Introduction | Exploration | Transport | Air pollution • Greenhouse gas emissions • Traffic noise • Physical (in)activity • Road safety | Context | Summary
The impact
Greenhouse gas emissions have Increasing summer temperatures will precipitation patterns, including level and as such influences air
far-reaching consequences for our lead to an increase in heat-related drought conditions, affect the quantity, pollution levels. Thus, greenhouse gas
environment and health morbidity and mortality. Increased quality and stability of food production. emissions also contribute to respiratory
Global emissions of greenhouse health risks are expected to be the Drought frequency is also projected to disease from smog and air pollution.
gases cause climate change. They will greatest in the southern parts of increase in central and western Europe,
increase climate hazards in Europe Europe and within cities (heat islands). whereas it may decrease in some limited Climate change tends to affect
during the 21st century and beyond, In northern Europe cold-related regions of northern Europe. Cascading vulnerable groups the most. The
such as droughts, with consequences morbidity and mortality is expected impacts of climate change from outside number of climate refugees will
for food production, vector borne to decrease. Increasing temperatures Europe may affect agricultural income increase if no worldwide mitigation
diseases and allergies; heavy rains and could also stimulate new and existing and price levels in Europe through and adaptation measures are
flash floods; forest fires; and sea level vector borne diseases. changes in trade patterns. taken (20).
rise. Storms and heavy rains and flash
floods could occur in many parts of Rising atmospheric CO2 concentrations, CO2 contributes to the production of
Europe. higher temperatures and changes in ozone by trapping radiation at ground
Surface air temperature anomaly for Below average over Above average over
the north Atlantic virtually all of Europe, more
January–December 2020 west of Ireland so in the north and east
C
0 7 Below average, Most above the average
particularly parts over a large part of
6 of western Canada Siberia and the seas
Above average to the north
4
Above average over Below average,
2 most other areas particularly parts of
of land and ocean northern India
Average 0
-2
Below average
Below average over
-4 over the eastern
several oceanic areas in
Below average equatorial Pacific
the southern hemisphere
-6
-7
Source: Reproduced from Copernicus (19).
24Introduction | Exploration | Transport | Air pollution • Greenhouse gas emissions • Traffic noise • Physical (in)activity • Road safety | Context | Summary
What are we facing?
If no measures are taken, mobility. An important way to realize the EU, but could still entail increased
the temperature will further emission reductions is to reduce the local air pollution risks. The use of
rise with worldwide impact number of vehicle-kilometres and biofuels for transport was 8% in 2018;
and in conflict with the Paris invest in a significant modal shift. the 2020 target was 10%.
agreement
Phasing out old vehicles will not Energy consumption
Energy consumption inintransport
transport (million terajoules)
(million terajoules)
Emissions continue to rise solve the problem 18
Despite a temporary dip in emissions If vehicle-kilometres continue to rise,
due to COVID-19 measures, it is the crucial question is whether this can 16
expected that emissions will continue be compensated for by improved
to rise if no measures are taken. energy efficiency of vehicles. This will 14
Consequently, the targets of the Paris depend on the renewal of the existing
Agreement would not be reached, vehicle fleet: the phasing out of old 12
which would have a significant impact vehicles with high emission factors and
worldwide. the penetration of new vehicles with 10
substantially less or zero greenhouse
Energy consumption in transport
With current policies, road transport gas emissions. (million terajoules) 8
18
emissions in 2030 will remain 20% Other liquid biofuels
above the 1990 level. Additional The switch towards
16
zero-emission 6 Aviation gasoline
Electricity road
measures reported in particular by vehicles is still modest, but will also Ship gasoline
Energy consumption in transport
EU Member States could bring 2030 (millionimprove terajoules) air quality.
14 4 Natural gas
18 Biogasoline
emissions down to the 1990 level.
Other liquid biofuels Rail gas/diesel oil
But this would still be significantly However, it is12important to realize 2 Aviation gasoline Electricity rail
16
higher than the 90% reduction needed that – by introducing zero-emission Electricity road Liquefied petroleum
Energy consumption in transport vehicles – the 10 Ship gasoline Biodiesel
for climate neutrality in 2050 (21). responsibility for clean 0
(million terajoules) 14 ‘90 ‘91 ‘92 ‘93 ‘94 ‘95 ‘96 ‘97 ‘98 ‘99Natural ‘02 ‘03 ‘04 ‘05 ‘06 ‘07 Ship
‘00 ‘01 gas diesel/gas
‘08 ‘09 oil ‘13 ‘14 ‘15 ‘16 ‘17
‘10 ‘11 ‘12
18 energy production for transportation Biogasoline Ship residual fuel oil
8 Other liquid biofuels Rail gas/diesel oil Aviation kerosene
Apart from the COVID-19 lockdowns 12 in is passed on to the energy sector.
Aviation gasoline Electricity rail Road gasoline
16
2020, measures to reduce total vehicle Therefore a reduction in greenhouse
6 Electricity road Liquefied petroleum Road diesel
kilometres have not been very effective.
10 gas emissions by the transport sector Ship gasoline Biodiesel Oil-derived fuels
14 Natural gas Ship diesel/gas oil 70% reduction from 2008 oil
During the past 30 years, efficiency may imply an4 increase in emissions Biogasoline Ship residual fuel oil consumption
8
improvements were not sufficient to by the energy sector. Increased use of Rail gas/diesel oil Aviation kerosene
12
2 of the climate policy in Electricity rail Road gasoline
compensate for increased vehicle biofuels is part Source: Reproduced from EEA (22).
Liquefied petroleum
6 Road diesel
10 Biodiesel Oil-derived fuels
0 Ship diesel/gas oil 70% reduction from 2008 oil
‘90 ‘91 ‘92 ‘93 ‘94 ‘95 ‘96 ‘97 ‘98 ‘99 ‘00 ‘01 ‘02 ‘03 ‘04 ‘05 ‘06 ‘07 ‘08 ‘09 ‘10 ‘11 ‘12 ‘13 ‘14 ‘15 ‘16 ‘17
4 Ship residual fuel oil consumption
25 8 Aviation kerosene
2 Road gasolineYou can also read