Drivers' perceptions of cyclists - Prepared for Charging and Local Transport Division, Department for Transport
←
→
Page content transcription
If your browser does not render page correctly, please read the page content below
Drivers’ perceptions of cyclists
Prepared for Charging and Local Transport Division,
Department for Transport

L Basford, S Reid, T Lester (TRL Limited),
and J Thomson, A Tolmie (University of Strathclyde)

                          TRL Report TRL549
First Published 2002 ISSN 0968-4107 Copyright TRL Limited 2002. This report has been produced by TRL Limited, under/as part of a contract placed by the Department for Transport. Any views expressed in it are not necessarily those of the Department. TRL is committed to optimising energy efficiency, reducing waste and promoting recycling and re-use. In support of these environmental goals, this report has been printed on recycled paper, comprising 100% post-consumer waste, manufactured using a TCF (totally chlorine free) process.
CONTENTS
                                                                       Page

Executive Summary                                                        1

1 Introduction                                                           3
  1.1 General background                                                 3
  1.2 Overall methodology                                                3
  1.3 Theoretical framework                                              3

2 Qualitative Research (Phase One)                                       3
  2.1 Review of literature                                               3
     2.1.1 Driver behaviours of concern to cyclists                      4
     2.1.2 Locations, road design and conditions of
           concern to cyclists                                           4
  2.2 Analysis of STATS 19 accident data                                 4
     2.2.1 Driver types and cycle accident involvement                   5
     2.2.2 Self-reported driver behaviour                                5
  2.3 Focus groups and individual depth interviews with drivers          6
     2.3.1 Drivers’ perceptions of road users                            7
     2.3.2 Driver behaviour towards other road users                     8
     2.3.3 Perceptions of cyclists                                       8
     2.3.4 Reactions to sketches of different cyclist types findings     9
     2.3.5 Cyclist/driver interaction                                   10
     2.3.6 Reactions to video clips of different scenarios findings     11
     2.3.7 Summary of general tendencies (attitudes and
           behaviours towards cyclists)                                 11
  2.4 Findings from the ‘Qualitative Research’ phase                    13
  2.5 Findings in relation to social psychological theory               13

3 Quantitative Research (Phase Two)                                     13
  3.1 General perceptions of other road users                           13
  3.2 Reasons for the perceived annoyance of cyclists                   14
  3.3 Perceptions of cyclist types                                      14
  3.4 Driving situations                                                15
     3.4.1 Scenario One: Pedestrian refuge                              15
     3.4.2 Scenario Two: Advanced stop line                             16
     3.4.3 Drivers’ perception of the average driver                    16
  3.5 Comparative perceptions of cyclists and drivers                   16
  3.6 Giving priority to cyclists on the road                           17
  3.7 Suggestions for improving the driver/cyclist relationship         17
  3.8 Awareness of cycling facilities                                   17
  3.9 Findings from the ‘Quantitative Research’ phase                   18
  3.10 Findings in relation to social psychological theory              18

                                                                              iii
Page
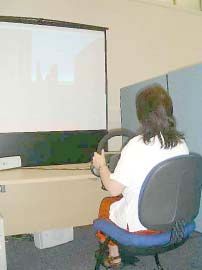
4 Testing of the Research (Phase Three) 18
4.1 The Virtual Reality testing 18
4.1.1 The Worlds 19
4.1.2 Data collection 19
4.1.3 The sample 19
4.1.4 The experimental procedure 20
4.1.5 Questionnaire responses 20
4.1.6 Behavioural measurements 23
4.1.7 Relationship between the questionnaire responses and
behavioural measures 24
4.2 Video intervention 25
4.2.1 Methodology 25
4.2.2 Results 25
4.2.3 ‘Video Intervention’ conclusions 28
4.3 Findings from the ‘Testing of the Research’ phase 28
4.4 Findings in relation to social psychological theory 29
5 Conclusions and Recommendations 29
6 References 31
7 Acknowledgements 32
Appendix A: Relevant psychological frameworks and
methodologies 33
Appendix B: The Virtual Reality equipment 37
Abstract 38
Related publications 38
ivExecutive Summary
Increasing the amount of cycling and improving the safety The data gathered from each of the research phases are
of cyclists are key aims of the Government’s transport highly supportive of the conceptual framework and
strategy, as set out in the White Paper ‘A New Deal for suggest that the ‘Theory of Planned Behavior’ could
Transport – Better for Everyone’ (DETR, 1998). Previous provide an appropriate structure for steering future
research has shown that one of the main deterrents to research in this area.
cycling is a fear of traffic, often attributed to the attitudes Throughout the research it was observed that drivers do
and behaviour of drivers. not have particularly strong feelings towards cyclists
This report summarises the methodology and results of a compared to their level of feelings towards other groups of
research project that investigated drivers’ perceptions of road users. However, when prompted, it is clear that
cyclists. The key aims of the research were to: motorists hold negative views of cyclists and tend to
l compare the views of the identified driver types; classify them as an ‘out group’ with significantly different
l compare the views of drivers within different characteristics from most other road users.
geographical areas; Analysis of the research suggests that the
unpredictability and the inherently or deliberately
l investigate driver tolerance of cyclists and behaviour
‘different’ behaviour of cyclists are seen to be particular
towards different types of cyclists;
sources of irritation to drivers when those issues then
l investigate driver behaviour in different driving compromise the drivers’ own convenience.
situations; When encountering a cyclist in circumstances that
l explore levels of knowledge of cycling facilities; require care, most drivers appear to recognise that they
l investigate drivers’ suggestions for improving the should give consideration to the cyclist. However, their
driver/cyclist interaction; and actual behaviour may be affected by their perception of the
‘social norm’ and the related pressure that they feel from
l examine levels of driver and cyclist adherence to the
other drivers as part of their ‘in group’.
Highway Code.
This research has also revealed evidence that the
The research was phased and broadly categorised to response of drivers when encountering cyclists is
ensure coverage of all the essential aspects of the topic and influenced by the context of the encounter. The apparent
to allow for development of understandings and concepts as lack of understanding of how to use certain types of
the project progressed. Each research phase was completed infrastructure leads to a diversity of improvised driver
prior to commencement of the subsequent phase to allow for responses at these locations that may be unsettling or
interim findings to guide the direction of the following alarming to cyclists. Where infrastructure is understood
work. The research methodology was as follows: and clearly defines ownership of the road space, this
l Qualitative Research – This phase began with a review appears to increase driver confidence when encountering
of relevant literature and analysis of STATS 19 accident cyclists. Where a cyclist is encountered within a context
data. The findings from the initial work were then used that causes a driver to slow down or deviate, drivers’
to direct the composition and content of eight group estimation of the cyclist’s discourtesy was seen to increase
discussions and twenty individual depth interviews that regardless of the cyclist’s actual behaviour.
were held with a representative sample of the public. On the basis of this research, a number of
l Quantitative Research – With input from the recommendations may be made relating to highway
‘Qualitative Research’ phase, interview questionnaires design, awareness raising, enforcement and areas for
were designed and completed with a controlled sample future research:
of 620 drivers. These interviews were held to gather l physical road features that force cyclists and drivers into
more precise data on drivers’ attitudes, intentions and close proximity should be avoided, or where this is
behaviours towards cyclists. unavoidable, motor vehicle speeds at such locations
l Testing of the Research – This phase allowed for clearer should be reduced;
linking of attitudes and perceptions with actual driver l highway designs that deliberately require cyclists to
behaviour through simulated trials and effectiveness of
obstruct traffic in order to produce a traffic calming
interventions to change driver responses.
effect should be avoided as they are likely to cause
At each phase of the research, findings were explored particular frustration to drivers;
with respect to a number of psychological theories, l education of drivers should focus not on helping them to
particularly the ‘Theory of Planned Behavior’. This theory predict cyclist behaviour but on understanding the
posits that human intentions are formed as a result of the circumstances, including driver behaviour, that will
interaction of three elements: influence cyclist behaviour;
l attitude; l training to improve awareness of required behaviours at
l social norm; and road features and cyclist facilities may be helpful for
l perceived behavioural control. both drivers and cyclists;
1l the current low level of enforcement of traffic law with
regard to both drivers and cyclists should be increased;
l further research should be conducted in order to
establish whether the frustration experienced by drivers
is translated into negative behaviour; and
l further research into the regional variations in attitude to
cyclists may be useful in identifying practices likely to
promote a better relationship between cycle users and
motorists.
21 Introduction called the ‘Theory of Planned Behavior’. The ‘Theory of
Planned Behavior’ states that ‘behaviour is the endpoint of
1.1 General background cognitive decisions’. Intentions (which precede behaviour)
are influenced by the following three factors:
Previous work on attitudes to cycling and cycling facilities
was commissioned by the Department and carried out by l attitude;
TRL Limited. These projects focussed on attitudes from l social norm; and
the point of view of cyclists and potential cyclists. The l perceived behavioural control.
general aim of this study was to probe other people’s
perception of, and attitudes towards, cyclists when driving, These elements may be briefly explained as follows:
i.e. drivers’ perception of cyclists. l Attitude encompasses a range of factors but may be
The earlier attitudes work revealed that one of the main summarised as general orientation towards, in this case,
reasons for people dismissing cycling as a genuine form of cyclists and the degree to which they are viewed as
transport was fear of actual and perceived road danger. legitimate road users. Attitude also encompasses the
Cyclists said it was the attitudes and behaviour of many subjective assessment of the characteristics of cyclists as
drivers that contributed to this fear. Conflicts between sharers of road space.
drivers and cyclists could also be a result of difficulties in l Social Norm arises when a decision is required and
spotting a cyclist against a background of a complex traffic reflects what the individual believes to be the prevailing
environment. It was proposed that changing drivers’ social consensus on the appropriate response to a given
attitudes and, at the same time, making cyclists more set of circumstances.
conspicuous by changes in road conditions, could l Perceived Behavioural Control is the degree to which
contribute to more people taking up cycling. the individual believes that they have the ability to act as
The earlier work also showed that cyclists are not they would wish. For example, an individual may wish
perceived to be high on most drivers’ road user status to travel by train rather than drive and may appreciate
hierarchy. This perception also has implications for driver that this would have a moral benefit that would accord
behaviour and safety of cyclists, as other research has with the ‘social norm’. But they may believe that they
shown that road users who are deemed to be of low status are unable to exercise this option (i.e. to behave in a
are treated with less care and consideration. certain way) because the train service is too unreliable.
TRL led the research project with extensive input from They may therefore choose to drive but that behaviour is
The University of Strathclyde and also Ipsos-RSL. not necessarily indicative of a negative attitude towards
train travel. Rather their level of perceived behavioural
1.2 Overall methodology control is too low for them to follow the prompting of
The main stages of the study methodology are as follows: their own attitude and those of society.
l review of literature; Perceived behavioural control has important
l cluster analysis of STATS 19 accident data to identify implications for research programmes as, to bring about a
driver types more likely to be involved in cyclist change in behaviour, it is important to influence
casualties; inappropriate perceived behavioural control.
l focus groups with drivers; The background to and relevance of the ‘Theory of
Planned Behaviour’ is discussed in more detail in
l qualitative individual depth interviews with drivers; Appendix A. This appendix contains details of and findings
l quantitative interviews with drivers; from the review of conceptual and applied psychological
l analysis of self-reported driver behaviour; literature that was conducted by the University of
l development of ideas for improving cyclists’ safety, Strathclyde as part of the study’s Literature Review.
based on the above;
l prioritisation and feasibility testing of ideas; 2 Qualitative Research (Phase One)
l testing drivers and scenarios using the TRL Virtual
Reality equipment; 2.1 Review of literature
l testing driver responses to different interventions using A literature review was an important first step in the
video clips; and project. It established and clarified the key points of the
l to produce recommendations for measures, initiatives existing knowledge and research methods relevant to
and programmes that will change drivers’ perception of drivers’ perceptions of cyclists. The output from the
cyclists and create a better and safer environment for literature review also assisted in the design and focus of
cycling, which will in turn encourage more cycling. subsequent stages of the project.
The literature review provided information on the
1.3 Theoretical framework following:
The following theoretical framework has been established l driver behaviour of concern to cyclists;
to guide the research. It is based on a model that has been l locations, road design and conditions of concern to
developed in the United States over the last fifteen years cyclists;
3l types of driver involved in accidents with cyclists; l on the approach to pedestrian refuges/traffic islands
l previous studies of driver attitudes and behaviour, of (where drivers may be tempted/pressurised to overtake
relevance to this project; and cyclists without sufficient space);
l the psychological conceptual framework for analysing l at T-junctions (where drivers from the minor road may
driver attitudes and behaviour pertinent to this project pull out in front of cyclists approaching from the right
(summarised in Appendix A). on the main road);
l at roundabouts (where drivers sometimes fail to see
The review drew on previous cycling and behavioural
cyclists who are circulating on the roundabout);
research and a new study of national accident data
compiled by TRL and was undertaken jointly by TRL and l at junctions (where drivers sometimes overtake the
the University of Strathclyde. cyclists and then turn left across them);
l cycle lanes (which some drivers treat as parking
2.1.1 Driver behaviours of concern to cyclists bays); and
Many of the TRL cycling research reports have drawn l contra-flow cycle lanes (where oncoming drivers are
attention to the issue of cyclists’ concern about driver driving too fast).
behaviour. ‘Attitudes to Cycling’ (Davies et al., 1997)
discovered that one of the most important factors Problem driver behaviours
contributing to non-cycle use (other than car dependence) The identified set of problem locations generated a
was the fear of danger from motor vehicles (specifically complementary list of driver behaviours that cause
driver behaviour and traffic speeds). Some of the drivers problems to cyclists:
who took part in the discussion groups readily admitted to
l drivers attempting to overtake cyclists without sufficient
getting annoyed with cyclists and to driving in an aggressive
space;
way as a result. In the ‘New Cycle Owners’ report (Davies
et al., 1998), many of those new cyclists who had ventured l drivers overtaking cyclists and then turning left across
onto main roads described the experience in a very negative them;
way (‘absolutely petrifying’, ‘traffic thunders past’). A l drivers from the minor road pulling out in front of
quarter of those involved in the project said that their cyclists on the major road;
experience of cycling on busy roads had caused them to l drivers failing to see cyclists who are circulating on the
reduce the amount of cycling that they did. roundabout;
Several TRL reports have looked at specific traffic
l oncoming traffic failing to give way to cyclists (when
situations that are known to cause problems for cyclists.
the cyclist has right of way);
These have often revealed some of the specific problems that
underlie the general concerns about traffic danger and rider l excessive speed and rapid acceleration/braking by
behaviour. For example, a study into ‘Further Developments drivers;
in the Design of Contra-Flow Cycling Schemes’ (Ryley et al., l obstructive parking and opening of car doors;
1998) found that cyclists could feel intimidated by oncoming l apparent inattention by drivers (causing cyclists to
motor vehicles which came too close, vehicles that drove at question ‘has he seen me?’); and
excessive speed, and vehicles emerging from side roads or
l aggressive behaviour involving some of the above.
accesses. TRL’s summary report ‘Achieving the Aims of the
National Cycling Strategy’ (Davies et al., 1998) concluded
that ways were needed to ensure far higher levels of driver 2.2 Analysis of STATS 19 accident data
care toward vulnerable road users, rather than just seeking While it is appreciated that this is not an accident study, it
engineering solutions. was felt it would be very valuable to analyse the accidents
involving pedal cyclists over the three years 1996 - 1998,
2.1.2 Locations, road design and conditions of concern to using the national STATS 19 accident database for Great
cyclists Britain, with respect to two main dimensions:
The Literature Review identified some specific issues l what types of driver, vehicle, location and light and
relating to drivers’ perception of cyclists, driver weather conditions are most frequently involved in
behaviour at road narrowings, road design and road user accidents with cyclists?
training and education. These issues had implications for l are there differences in the distribution of these factors
the project as follows: between accidents involving cyclists and those that do not?
The analysis of the accident database was not intended
Problem locations to provide a detailed study of cyclist accidents but to
There are a number of physical settings and facilities provide information to help decide which driver types to
where cyclists experience problems as a result of driver include in the group discussions and the individual depth
behaviour. These include: interviews. It was also useful in selecting the traffic
l narrow lanes, including those created by parked cars scenarios on which drivers were to be questioned.
(where drivers may be tempted/pressurised to overtake The key findings of the analysis of the 1996 - 1998
cyclists without sufficient space); accident data are as follows:
4l 10% of all reported injury accidents involve a cyclist; Table 1 Drivers involved in car collisions with a cyclist
l 8% of all reported injuries are to cyclists; (two-vehicle) by sex, for the year 2000
l most drivers involved in accidents with cyclists are aged Cyclist casualty
25 to 49, particularly 25 to 39; Sex of
driver Child Adult None Total
l younger drivers (17 to 24) are less likely to be involved
in accidents with cyclists whereas older drivers (40 and Male 2,875 5,687 18,315,514 18,324,080
over) are more likely to be involved, relative to 61.5% 67.6% 56.5% 56.5%
accidents not involving cyclists;
Female 1,800 2,729 14,092,462 14,096,991
l most drivers (almost 70%) involved in accidents with 38.5% 32.4% 43.5% 43.5%
cyclists are male. This is similar to the general ratio of
male to female drivers involved in all accidents; Total 4,679 8,416 32,407,976 32,421,071
100% 100% 100% 100%
l three-quarters of accidents involving cyclists occur on
single carriageway two-lane roads;
l almost three-quarters of accidents involving cyclists
occur at or close to a junction: T-junctions (40%), Table 2 Drivers involved in car collisions with a cyclist
crossroads (10%), roundabouts (9%), and private drives (two-vehicle) by age, for the year 2000
(6%); and
Driver Cyclist casualty
l most accidents involving cyclists occur in daylight age
(79%) and in good weather conditions (84%). group Child Adult None Total
The STATS 19 analysis showed some differences 17-20 285 516 1,175,256 1,176067
between the distribution of types of driver, vehicle, 6.1% 6.1% 3.6% 3.6%
location, light and weather conditions found in accidents
involving cyclists and those not involving cyclists. 21-29 933 1,695 5,068,875 5,071,503
19.9% 20.1% 15.6% 15.6%
However, these differences are at least partly explained by
differences in the distribution of cycling and driving 30-39 1,340 2,243 7,838,207 7,841,790
activity over the road network, over the day and as 28.6% 26.7% 24.2% 24.2%
affected by weather and lighting conditions. One may
40-49 862 1,740 6,531,922 6,534,524
conclude therefore that accidents involving cyclists share
18.4% 20.7% 20.2% 20.2%
many of the attributes of other accidents.
50-59 701 1,216 5,586,782 5,588,699
15.0% 14.4% 17.2% 17.2%
2.2.1 Driver types and cycle accident involvement
Given the evidence of car drivers’ salience in cycle 60-69 326 575 3,650,009 3,650,910
accident involvement, (as part of Phase Two of the 7.0% 6.8% 11.3% 11.3%
research study,) accident statistics for the year 2000 were
70+ 232 431 2,556,926 2,557,588
analysed for any more information about the types of 5.0% 5.1% 7.9% 7.9%
driver involved. Transport Statistics Great Britain provides
details of the proportion of the population holding a full Total 4,679 8,416 32,407,976 32,421,071
car-driving licence divided by age group and sex. 100% 100% 100% 100%
Factoring these percentages by estimates of the Great
Britain population in 2000 (the year of the data used in this than drivers of other ages. A driver in the two oldest
section of analysis) gives an estimate of the number of groups, 60 and above is much less likely to collide with
drivers licensed to drive cars. These numbers can be cyclists.
combined with casualty data to develop tabulation Some caution is needed when using these data. Risk is
showing cyclists injured in two vehicle collisions against being assessed implicitly against licensed driver numbers
car driver sex and age groups. Analysis by each driver but not mileage. Driver traffic includes learner drivers and
group compared to all licensed drivers shows significant other unlicensed drivers so that these two tables
gender and age dependent variations. underestimate total driver numbers. In addition, driver
Table 1 shows that adult cyclists are much more likely mileage varies with both sex and age. Part of the apparent
to be injured by a male driver than a female driver even
excess casualties generated by male drivers and the
after allowing for the fact that more drivers are male. The
reduced number of casualties involving older drivers may
odds ratios suggest that the odds of a male driver being
reflect differences in driver mileage.
involved in a collision with a child cyclist are about 1.2
times higher than the odds of a female driver being
involved. For an adult cyclist casualty this ratio is even 2.2.2 Self-reported driver behaviour
higher at about 1.6. An extension to the questionnaire survey carried out in
The effect of driver age is also significant in the year Phase Two of this work was conducted in order to
2000 data: the data are shown in Table 2. Drivers aged 30 - ascertain whether drivers with different characteristics
49 are more likely to be involved in collisions with cyclists were more likely to behave in negligent or deliberately
5unsafe ways. Although this work was carried out some minutes and two hours. Visual stimuli were used to
months after the Phase One Focus Group work and was promote discussion and where feasible, videos of
based on the questionnaire sample described in the situations of concern to cyclists were used. A topic guide
summary of Phase Two work, below, it is appropriate to was devised based on the results of the Literature Review
report on the findings in this report section. and the STATS 19 analysis.
The areas surveyed in Phase Two were Hull, York,
Leamington Spa, Bristol and Camden. The drivers were Individual depth interviews
divided into two groups - domestic drivers and professional The purpose of the individual depth interviews was to
drivers – with quotas for each. These groups were then investigate in greater detail the issues arising from the
stratified: domestic drivers by age and sex; professional Focus Groups, and to see if there were any other aspects of
drivers by vehicle types (HGV, van and company car). driver perception and behaviour that needed to be included
At the end of each survey the respondents were handed in subsequent stages of the study.
a single sheet driver behaviour questionnaire (DBQ) and
post-paid envelope addressed to TRL. They were asked to
complete the questionnaire and post it to TRL. From a total The sample
of 620 interviewees, TRL received 313 driver behaviour Qualitative research does not aim to represent the general
questionnaires, a response rate of 50 per cent. There were population in the way that quantitative surveys do, but
no significant differences between the sample returning a rather to concentrate on the types of people who would be
DBQ and the rest of the interview sample in terms of age most likely to provide a spectrum of opinions relevant to
or sex: 38 per cent of each sub-sample was female, and the the subject of the research. The Literature Review and the
ages were distributed across a span from 17 to 75. There STATS 19 analysis gave indications for the types of driver
were differences in the response to a question about the that are of concern to cyclists, and should therefore be
respondent’s income: 9 per cent of the DBQ sample had questioned in this section of the study. These included:
refused to provide information about their income or said l high mileage/low mileage drivers;
that they did not know what it was compared with 28 per l domestic (car) drivers and professional (goods and
cent of the total 620 interviewees. Respondents, who did passenger) drivers;
not provide income data, were less likely to return a driver
l large car/small car drivers;
behaviour questionnaire than those who did provide
income data (odds ratio about 1:5). l young/old drivers; and
The questionnaire left with respondents was the most l experienced/inexperienced drivers.
recent version of the Manchester Driver Behaviour Other categories of drivers that were investigated
Questionnaire (MDBQ) (Lawton et al., 1997). There are included:
twenty questions: each starts with the description of a
l drivers who cycle; and
driving fault and respondents are asked to indicate how
frequently they perform each fault. In designing the scale l drivers who do not cycle.
the faults were characterised as Highway Code violations The sample of driver types was also structured to
(HCV), aggressive violations (AV) and driver errors (E) provide a good regional and socio-economic
Analysis of the data gathered via this questionnaire representation. The five areas of the country used were:
revealed no significant associations between driver
l York;
characteristics and self-reported tendency to commit
errors, Highway Code violations or aggressive violations. l Hull;
Nevertheless, it must be borne in mind that this data l Leamington Spa with Coventry;
related to self-reported behaviour and there is a significant l Camden; and
likelihood that respondents may have been tempted to give
l Bristol.
‘correct’ rather than strictly honest answers.
Method of analysis
2.3 Focus groups and individual depth interviews with
All research sessions (Focus Groups and individual depth
drivers
interviews [IDIs]) were audio recorded. Notes were taken
The key stage of the study’s ‘Qualitative Research’ took at all of the Focus Groups and transcripts were made from
the form of eight group discussions, or ‘Focus Groups’, the audio recordings of the IDIs. These notes and
followed by twenty individual depth interviews held with transcripts were then translated onto content analysis grids
individuals. In total, 78 drivers were involved. whereby the different groups and IDIs could be compared
easily. The content analysis forms the basis of the
Focus groups conclusions from this section of the study.
Focus groups are recognised as an established technique When looking at the different attitudes towards cyclists
for producing quality qualitative information at an early it was important to bear in mind the different variables of
stage of a project, where the topic is relatively the sample and any effect that these may have had on
unresearched. For this study, each Focus Group comprised responses. These variables include:
of between eight and ten people and lasted between ninety
6l interview methodology used (i.e. the differences in inconsiderate of them. This displays the typical
response that may be caused by the group environment psychological trait that people like to think they act better
of the Focus Groups as opposed to the one-to-one than what they perceive as the ‘social norm’.
rapport of the IDI);
l gender – any difference in the responses of men versus Road users’ hierarchy
women; Respondents were asked to consider whether they believed
l age; a hierarchy existed according to different types of road
users. They could base it on any variables they saw most
l driver type – differences between professional and
appropriate.
domestic drivers, and within these two groups;
The responses given indicated that hierarchies were
l cyclists versus non-cyclists; and generally based on a logical order in relation to size of
l geographic location of the Focus Groups and IDIs. vehicle – i.e. the larger the vehicle, the more respect it
received from other road users; the smaller the vehicle, the
Presentation of the research findings in this report
more likely it was to come off the worst in an altercation.
generally relates to both the results of the Focus Groups
(Respondents considered motorcycles as an exception to
and the IDIs. Differences in responses according to any of
this rule as their speed and manoeuvrability were thought
the aforementioned variables is highlighted where relevant.
to compensate for their lack of size.)
It is significant that when discussing other road users,
2.3.1 Drivers’ perceptions of road users motorists seldom mentioned cyclists spontaneously, their
Problem areas for motorists immediate associations being with drivers of other motor
Initially the discussions were focussed on problems for vehicles such as ‘the white van’, taxis and HGVs. Often,
drivers in general, rather than prompting specific respondents had to be prompted before they thought of
consideration of cyclists. When discussing problems facing cyclists.
the motorist, those that were most readily identified (in When the moderator, in both the Focus Groups and the
both the Focus Groups and the IDIs) were: individual depth interviews, entered cyclists into the
discussion, they were the subjects of rather negative
l The general and overall increase in traffic congestion,
imagery, which may suggest an underlying conflict between
with numbers of vehicles growing faster so that existing
drivers and cyclists. Respondents placed cyclists, perhaps
roads can no longer accommodate them, was the main not surprisingly, at the bottom of the road user hierarchy. (It
preoccupation for most. It was stated that the driver now should be noted though that respondents completely
has to allow more time for everyday journeys and travel, excluded pedestrians from their hierarchies, as the subjects
when other demands on time are also becoming greater did not consider pedestrians as ‘true’ road users.)
and greater. Respondents justified the low positioning of cyclists not
l With the increasing number of vehicles on the roads, only by their size and lack of speed but also because of their
what was called ‘inconsiderate driving’ became not only seeming oblivion to the motor vehicles around them.
more in evidence but also more unacceptable. It was felt Respondents expressed that the respect that drivers of
that arrogance (such as ‘hogging’ the middle or ’fast’ larger vehicles demonstrate towards other vehicles
lane), unpredictable behaviour (such as failing to signal diminishes in proportion to the other vehicle’s size – i.e., the
intentions) or generally not behaving in a courteous and smaller the other vehicle, the less their respect. However, it
generous manner (allowing traffic in from the side, etc.) should be clarified that this did not necessarily mean that
could only exacerbate the problems caused by the they would behave discourteously towards these smaller
increasing numbers of vehicles on the roads. Also road users. Size was also reported as having other
relevant here were comments made regarding the speed implications: such as, the fact that cycles are smaller
travelled at by elderly drivers and the more uncertain meaning that they are harder to see. Drivers accused cyclists
novice drivers. It was notable that some respondents’ of not being aware of this and respondents who were drivers
definition of ‘unacceptably slow’ seemed to include of larger vehicles reported that this tended to infuriate them
those drivers travelling at the speed limit. (particularly HGV and bus drivers). Those respondents who
were cyclists (and the drivers of other smaller vehicles) said
It appears that drivers are demanding more uniform and they were unaware that the size of the larger vehicles
predictable behaviour from other road users to cope with impacted on their ability to see other vehicles beside and
the growing traffic congestion. As the traffic environment behind them. It was stated that the mass of larger vehicles
becomes more volatile, drivers may increasingly results in many blind spots, of which other motorists and
appreciate other road users who demonstrate awareness of road users seemed to be unaware.
their immediate and upcoming situations, including other When prompted, all the professional drivers, regardless
users’ intentions. Also, reliance on compromise with and of whether they were carrying goods or passengers, tended
courtesy from other road users may be considered more to be less accepting of cyclists’ presence on the roads they
critical to the duration and ease of a journey. were using. They felt their livelihood was being interfered
Those attending the Focus Groups expressed a general with – particularly if they were held up by a cycle, which
tendency to be critical of other road users, regardless of was obviously slower than other vehicles, within their
mode. Respondents would claim to be considerate of other lane. It was reported that being caught behind a cyclist
drivers, but perceived many other drivers as being added further to the pressure on their work schedules.
72.3.2 Driver behaviour towards other road users 2.3.3 Perceptions of cyclists
Respondents were asked what they understood by Respondents were asked to consider the case of cyclists in
‘considerate’ driving, and which factors determined what more detail and gave their spontaneous associations.
was good or bad behaviour in relation to other road users.
The main characteristics which were felt to distinguish a Reasons for cycling
considerate driver from an inconsiderate one, were as In the individual depth interviews, drivers were asked why
follows: they thought people used cycles to get around. It was felt
l awareness of others; that they were doing it for:
l being aware of what is happening a long way ahead/ l economy;
reading the road; l enjoyment;
l awareness of speed and space ratios (braking distances l to get fit; and
and times needed by other types of vehicles);
l convenience.
l smooth, constant speed (erratic speed was seen as
irritating – for example, hesitancy of learners); It was not felt that environmental issues motivated many
l respect of the road rules; cyclists, or that the ability to get through urban gridlock
was a motivator, but that these were considered as
l proper signalling of intentions; and fortunate by-products.
l proper use of the vehicle:
– giving way when required, but also giving way when First impressions/associations of ‘cyclists’
one has the right of way, i.e. letting people in from As noted in other sections of this study, when drivers were
side roads, or allowing oncoming traffic to turn right asked to specifically focus on cyclists, associations with
in heavy traffic; them were found to be predominantly negative rather than
– visible gratitude for other’s courtesy (a wave, flashing positive. It is important to note that although some level of
one’s lights) and acknowledgement of kindness; and negativity appears to exist, there does not appear to be any
– courteous behaviour encouraged courteous behaviour. over-riding hostility shown by drivers towards cyclists.
Respondents provided the following reports of their
(Note that all the above attributes were perceived by immediate impressions of and associations with cyclists:
respondents to be absent from most cyclists’ behaviour
on the roads.)
Positives Negatives
While courtesy forms a key component of this list of
characteristics of a ‘considerate’ driver, motorists then l Healthy – in terms of personal l Vulnerable – perceived greater
went on to justify drivers’ lack of courtesy to cyclists by and environmental benefits; and potential for involvement and
seeing cyclists not as being ‘proper’ road users. l Brave – cycling in motorised then injury or death from traffic
traffic despite their lack of any accidents;
Although according to the law cycles and motor
real protection. l Irresponsible – due to an
vehicles are equals on the road, many drivers involved absence of training or formal
in the study, particularly those driving for a living, did commitment to lawful
not accept this fact. Reasons behind this lack of behaviour;
l Despised – cycling should be
acceptance included the perception that cyclists were
provided for through separate
apparently not obliged to financially contribute to the facilities and not allowed on
road usage (no road tax, no insurance). roads;
As well as feeling that cyclists were getting special l Dangerous – cyclists pose risks
treatment by not having to contribute financially, other to themselves and other road
users;
aspects of cyclists’ behaviour were felt to exacerbate bad l Erratic/Unpredictable – for
feeling towards them. These included cyclists’ apparent example: weaving in and out of
disregard for the rules of the Highway Code (such as traffic, not signalling inten-
passing through red lights) as well as general inconsiderate tions, etc.;
l Arrogant – it was felt that
and potentially dangerous behaviour, such as failing to
cyclists seemed to believe they
signal before manoeuvring. were invincible or that other
It appears that confusion regarding the road user status road users were responsible for
of cyclists may contribute to drivers’ inconsistent their safety; and
treatment of cyclists, compared to other motorised road l Inconvenient – basic character-
istics of cycling were perceived
users. Cyclists are classed as equals on the road in one
as fundamentally different and
aspect of the law, yet appear to be exempt from some of delaying to motorised road use.
the enforcement issues and other requirements (such as
licensing) faced by other road users. Also, the actions of
some cyclists, such as riding on the footway, are in The respondents’ first impressions of cyclists are on the
obvious breach of the Highway Code rules that other road whole negative and are consistent with the images that
users must physically and legally abide by. This may came out of the hierarchy projective exercise explained
further aggravate the cyclist/driver relationship. above (Section 2.3.1). Many of these impressions could
8suggest resentment towards cyclists, such as the feeling It was found that how the cyclist looked had a definite
that cyclists, unlike other road users, lacked responsibility effect on the way motorists believed the cyclist would behave.
(having no road tax, insurance, or licence). Interestingly, Pictures of cyclists wearing helmets were generally
there was no mention even among those who cycled that considered to be more serious and sensible on the road
cyclists pay taxes indirectly, such as through council tax than those without. Respondents identified one exception
and other general taxation; or that many cyclists are also to this feeling; packs of racing cyclists, though wearing
car owners and therefore do pay road tax; or that some helmets, were not considered to be as sensible as lone
cyclists do choose to carry third party liability insurance. cyclists in helmets, but this was because the erratic
behaviour of the group outweighed the positive
2.3.4 Reactions to sketches of different cyclist types associations of a cycling helmet.
findings In general it was felt that people who had arranged
In the group discussions, sketches of different types of appropriate and/or specialist cycling equipment and clothing
cyclist were handed out, participants asked to describe were more likely to have also the experience and/or training
them and to say what sort of behaviour they would expect to employ correct cycling behaviour. However, there was also
from each type of cyclist. a contrasting (minority) feeling that cyclists wearing helmets
The pictures shown to the Focus Groups showed: might be more timid and cautious than those without, wearing
a helmet out of fear rather than as a sensible precaution.
l a family cycling, where each member of the family wore
a helmet;
Ideal cyclists
l a girl on a cycle with a helmet on;
When respondents were asked to define characteristics of an
‘ideal cyclist’, it was found that the ideal cyclist had to be a
responsible one. Respondents suggested that this would be
demonstrated through awareness and courtesy towards other
road users, as well as abiding by the Highway Code, as
motorised vehicle drivers are required to do. A cycling
proficiency test certificate or licence was seen as a good
indication of responsibility acceptance and the concept was
welcomed by cyclists and drivers alike. However, the
enforcement of such a system was acknowledged as difficult
or even impossible. A sizeable minority of respondents
suggested that a minimum cycling age could be introduced
to reduce the numbers of inexperienced children on cycles
on the road. (No estimates of an appropriate minimum
cycling age were specified.)
Drivers, particularly those that did not cycle themselves,
felt that ‘having the proper kit’ was an indication that the
l a young man on a cycle, without a helmet on; cyclist was likely to behave responsibly. The ‘proper kit’
l an older woman on a cycle with a pet riding in the was deemed to include:
cycle’s front basket, the woman was not wearing a l wearing a helmet, for protection and prevention of
helmet; injury;
l having working lights and reflectors, for visibility; and
possibly
l the addition of mirrors (as on a motorcycle), to enable
the cyclist to see behind them.
The obligatory wearing of cycle helmets (as with
seatbelts) was felt by many respondents to be a step that
should already have been taken. In fact, a minority of
respondents had assumed that it was already mandatory
with enforcement of the law being extremely lax.
It was felt that an ideal cyclist, to justify their ‘right’ to
the road, would provide some financial contribution or
road tax, however minimal. Again there was some call for
the requirement of insurance for cyclists, to protect drivers
from solely having to pay for the costs of a collision that
l a pack of professional-looking cyclists, all with helmets may not be their fault. At the time of conducting this
on; and ‘Qualitative Research’, the only method of recovering
l a young boy riding a BMX cycle on one wheel whilst costs from the cyclist was to pursue a potentially expensive
wearing no helmet. and time-consuming civil law suit.
9Visibility issues motorists on roundabouts, but it was very difficult for
One of the problems with cyclists in traffic had been them to do so in competition with motor vehicles.
identified as their seeming invisibility in certain situations
l poor visibility:
and conditions. Discussion was held on the factors that
were believed to conceal cyclists and the following were – rain, fog, dusk – times when cyclists’ visibility was
identified: reduced even more than usual particularly since many
motorists appear to not actively look for cyclists.
l external factors such as poor weather conditions or lack
of lights; l uneven road surface:
l inherent factors such as the small size of a bicycle – pot holes, drains, grates – all areas where cyclists
relative to most other vehicles; could suddenly veer into the road in front of
l poor cycling behaviour such as lack of signalling and motorists.
coming up on the inside of vehicles;
l parked cars/car doors opening:
l physical barriers to perception such as blind spots
caused by vehicle dimensions and lack of noise of – situations where cyclists could be forced to swerve
cycles; and into the motorists’ path.
l driver unfamiliarity with cyclists and therefore their not l bollards and pedestrian refuges:
expecting to see cyclists.
– narrowings where motor vehicles have to slow down.
Previous research had suggested that a reason behind – cycle lanes suddenly coming to an end with no clear
poor visibility of cyclists during the daytime could be due route for the cyclist to follow; forcing them back into
to drivers not expecting to see them and therefore not the mainstream of traffic.
looking out for them. This suggestion was put to
respondents. Many agreed that this could be true, as l ignoring the rules of the road:
drivers already had a number of things to be aware of – cyclists going the wrong way along a one way street;
when driving. However, according to a number of – cyclists jumping red lights; or
individual interviews this was felt to be no more than a
‘poor excuse’ for blatant disregard. These respondents felt
– cyclists riding on pedestrian footways.
that some drivers who did not perceive cyclists as being an l knots of cyclists emerging suddenly into the traffic flow:
‘equal road-user’ did not treat cyclists with due care and
– outside schools and factories.
attention, purposefully disregarded them, and if challenged
about their behaviour they would simply claim that they It is interesting to note that drivers identified that
had not seen the cyclist. cyclists put themselves at particular risk when ignoring the
rules of the road. In response to this statement, it may be
2.3.5 Cyclist/driver interaction important that the education and publicity exists to ensure
Respondents now addressed the subject of types of driver that cyclists are aware of the correct and legal behaviour.
behaviour which they believed were of most concern to Such training should be extended to include all road users,
cyclists and what types of situation contributed to driving including drivers.
which was less considerate to cyclists. Respondents were also asked for their opinions on
Drivers were asked what they thought were the most general road design and the road environment. One problem
problematical occasions for cyclists on the roads. The area that was identified was the lack of knowledge about the
situations that they felt were most hazardous for cyclists are: correct use of cycle facilities on the roads, not only on the
motorists’ part but also on the cyclists’. This lack of
l left turns in general:
knowledge was felt to be a result of insufficient publicity
– either the left turning motorist cutting in on a left regarding the correct usage of such facilities and a lack of
turning cyclist; or more dangerously; enforcement of any rules that may apply.
– cutting in front of the cyclist who was going straight Thus, for example, neither cyclists nor motorists knew if
ahead, with the motorist believing he could make a it was anything more than extremely inconvenient if motor
left turn prior to the cyclist reaching the junction. vehicles drove or parked in the cycle lane, or pulled up to
the advanced stop line (ASL) if there were no cyclists in
l right turns: the ASL area.
– the cyclist having to cut across the flow of traffic to Inconsistencies in the design of cycle facilities were also
make his turn. an important factor in confusion over their usage. For
instance, cycle lanes were found to differ in four ways:
l roundabouts:
l coloured green;
– motorists were more used to concentrating on motor
vehicles, therefore not being aware of or overlooking l coloured red;
cyclists; and l no colouring at all; or
– cyclists were expected (and it was believed that they l no colour and no boundary line (solid or otherwise),
were obliged by the rules of the road) to act like only an intermittent cycle symbol.
10Also, the actual facilities provided were not always seen l roundabout – Here two cyclists were travelling on a
to be adequate. For example, (from a cyclist’s point of roundabout. A car at an entry to the roundabout pulled
view) they tended to lack continuity, stopping and starting forward in front of the cyclists causing them to swerve
without warning. They were also felt to be incompatible around;
with bus routes, in that buses legitimately had to block l left-turning vehicle – This showed a van driver turning
cycle lanes in order to pull up at bus stops. On a more left directly in front of a cyclist who was intending to go
positive note, however, no matter how inadequate the straight ahead;
facility, its existence was felt to raise the awareness of
l advanced stop line with central cycle lane – This
cyclists on the road to at least some degree.
Conversely, there was some underlying feeling that non- showed a cyclists’ advanced stop line (ASL) at traffic
use of cycle lanes where they did exist may cause lights, which allows cyclists to position themselves
resentment, fuelling such attitudes as ‘cyclists get all this ahead of the motor vehicles. This particular ASL had a
special treatment and then don’t use them’. On the other central feeder cycle lane to allow cyclists to reach the
hand, ASLs were felt to legitimise cyclists’ action of right-hand lane;
sitting in front of traffic (to get a head start) but this could l advanced stop line with left-hand cycle lane – This
cause two possible reactions: was an example of a mandatory cycle lane (on the
l cyclists were no longer breaking the law by crossing the left-hand side) feeding into an ASL facility at the
white line (something which could annoy drivers); or traffic signals; and
l cyclists were now encouraged/permitted to slow down l cycle track crossing a side road – This scenario showed
traffic and cause delay and thus frustration and a cycle track on the footway that crossed a side road
resentment. junction. The side road had an additional set of give-
way markings, intended to control road users and allow
It appears that cycle facilities had their own set of issues cyclists to continue uninterrupted across the side road. A
to be considered. A lack of awareness and knowledge of car had crossed the first set of markings and was thus
usage among drivers coupled with a lack of enforcement blocking the cycle track; cyclists used the main road in
of correct usage certainly seemed to be a common order to get past.
problem. These facilities also seemed to be a potential
cause of resentment towards cyclists, due to issues over A key finding which should be noted was that, when
their perceived funding by drivers and not cyclists, but also commenting on the scenarios it was usually the behaviour
because of their existence and the way they legitimised of the cyclist that was criticised – no matter how small the
some of the more annoying behavioural aspects of cyclists, misdemeanour. Few links were made between the cyclist’s
such as holding up traffic by sitting in front of vehicles at behaviour and any external influences that could be
ASLs. In conjunction with other suggestions that there was affecting their choice of behaviour; i.e. the respondents’
some element of disregard for cyclists because of their lack comments indicated that they thought the cyclist’s actions
of importance (in terms of the hierarchy) and issues of were inherent and dispositional behaviours. In contrast, the
inequality with regard to the lack of cyclist contribution to motorists’ misdemeanours were excused or justified in
road maintenance and facilities etc. it could be inferred terms of the situational influences. As this tendency
that some drivers may purposefully disregard cyclist seemed to continue across the groups and the individual
facilities because they fail to respect cyclists. depth interviews and was unprompted, it is unlikely that
group dynamics had any significant effect on this finding.
2.3.6 Reactions to video clips of different scenarios Another overall finding from these scenarios was that
findings people were not familiar with cycle lanes and advanced
The research sessions consisted of general discussion of stop lines at traffic lights so they were not commonly
road user behaviour and interaction, which included understood. It seemed that implementation of cycle
looking at scenarios (in video and still photograph formats) facilities is accompanied by little publicity, so how the
which depicted situations where cyclists and other road facilities are to be used is little known.
users would come into contact and potentially conflict. According to the respondents’ reactions to the scenarios,
Respondents were then asked to describe their likely the majority of drivers claimed they would behave with
behaviour and that of other road users (such as the average consideration when coming into contact with cyclists
driver) in such situations. within the different types of situation. How true this was is
The scenarios used in this section of the ‘Qualitative hard to say. Perhaps more interesting is the way in which
Research’ included: drivers tended to criticise the behaviour of cyclists before
l narrow traffic lane (road works) - This showed a cyclist
that of the drivers depicted within each scene. This aligns
travelling along a road narrowed to a single lane of with the psychological prediction of targeting of members
traffic by road works. The cyclist was being followed by of an ‘out group’.
a line of vehicles apparently trying to judge whether it
was safe to overtake; 2.3.7 Summary of general tendencies (attitudes and
l pedestrian refuge – This scenario was of a cyclist behaviours towards cyclists)
approaching a pedestrian refuge with cars overtaking When respondents were generally asked which road users
him close to the narrowing; they found irritating, until prompted, cyclists did not
11particularly feature in discussions. This would tend to did not care about their behaviour. As previously mentioned
contradict the view of some cyclists that drivers habitually there was no recognition of the fact that cyclists pay general
adopt an aggressive posture towards them. Only when taxes, may have cars and therefore pay road tax and that
prompted were drivers prepared to discuss cyclists at all, some cyclists do in fact hold insurance.
although once initiated, discussion showed attitudes towards
cyclists and cycling were generally negative for the majority Cyclists and non-cyclists
of respondents (as seen during both the hierarchy exercise Whether a respondent cycled or not, not surprisingly, had
and through the drivers’ first impressions of cyclists). an important effect on responses and attitudes. Those who
For the purposes of this research project, it was were cyclists were in the favourable position of being able
necessary to direct respondents to particularly focus to see things from both the cyclist’s and the driver’s point
attention on their opinions of and reactions to cyclists. The of view. These respondents were better able to distinguish
reporting on this research may create the impression that between different types of cyclists, separating the good
drivers’ opinions of cyclists were particularly negative, in from the bad. Non-cyclists, on the other hand, were
relation to views of other road users, however this is not generally guilty of linking all cyclists to the same (usually
intended and the context of the responses and data should negative) behaviour by association. This phenomenon is
always be remembered. typical of the psychological tendency to regard members
The vulnerability of cyclists was a concern expressed by of a group as more similar to each other than is actually the
many and had two aspects: case (as documented by Tajfel and Turner, 1986).
l with regard to a fear of injuring the cyclist in an On the whole, however, the attitudes of those who
accident; and cycled did not vary significantly from those who did not
l with regard to the damage that could be caused to an cycle. They tended to see things from the driver’s
involved vehicle and the ultimate liability (no insurance perspective and could be just as negative about cyclists as
for cycles). other drivers who were non-cyclists.
Cyclists therefore tended to have similar views to most
Professional drivers were undoubtedly the most negative other non-cycling domestic drivers. It was non-cycling
in their views towards cyclists. Those driving larger professional drivers (as mentioned above) that tended to
vehicles in particular (HGVs and buses) were less hold more extreme views. Nonetheless, those drivers who
accepting of cyclists as legitimate road users, due to lack cycled did have greater insight than other drivers did in
of insurance, a lack of financial contribution (no road tax), some aspects. For example, they, not surprisingly, tended to
and a lack of some sign of proficiency (no licence or test know more about cycling facilities and how they operated.
certificate). These respondents tended to be of the opinion When looking at the scenarios, they could rely more on
that cyclists should not be on the road at all. The slowness personal experience and talk about how they had reacted in
of cycles was frustrating for those with time pressures on real life. They could identify with such issues, as they knew
their jobs (both goods and passenger carriers). The that they were more commonplace than other non-cycling-
attitudes and behaviour of cyclists was seen to exacerbate drivers thought (such as being ‘cut-up’ by a motor vehicle).
this frustration. Cyclists were described as being arrogant, They were more realistic when it came to how they expected
especially when they were seen to be flouting the rules of cyclists to react and behave in cycle lanes.
the Highway Code (jumping red lights, riding on footways,
riding the wrong way along a one-way street), and ‘getting
Group dynamics
away with it’, but also when they were seen to be acting
As in all research studies, it is noted that the methodology
irresponsibly (coming up the inside of a vehicle, changing
used can have an effect on the results. Possible influencing
lanes or direction without signalling or checking behind).
of results may have occurred in the following ways:
Unpredictability was also a criticism levelled at the
cyclist from the majority of respondents. However, this l being in a group of peers can encourage ‘posturing’ and
stirred different reactions in different road user types. subservience whereby more dominant members’ views
Women and those drivers who also cycled tended to are taken up by the less confident majority who do not
sympathise with this unpredictability, understanding or wish to appear stupid or admit to an unpopular
speculating on the difficulties that cyclists were perceived viewpoint.
to face: l conducting a lengthy discussion on a similar topic can
l lack of consideration from other road-users; also affect opinions. Boredom of repeating opinions can
in some cases lead to respondents saying anything to
l difficult road conditions;
placate the moderator. However, this cannot be
l lack of visibility etc. attributed to where respondents were assessing the
In contrast, professional drivers and some male domestic different scenarios (video clips) as the criticism of
drivers tended to blame the cyclist for not knowing what he cyclist behaviour was common across all groups and
was meant to do, apparently through a lack of proper most individual depth interviews.
training and the absence of any obligatory cycling test. l a related factor was the way in which the stimulus
These groups also felt that cyclists were not responsible for materials used was different in the groups compared to
the consequences of their actions, as they did not pay the individual depth interviews. The fact that stills of a
insurance and were generally free from enforcement, and so particular point in the scenario were shown in the
12You can also read