Quarterly Global Outlook 3Q 2021 - What Diverges Will Eventually Converge - UOB
←
→
Page content transcription
If your browser does not render page correctly, please read the page content below

Quarterly Global Outlook 3Q 2021
What Diverges Will
Eventually Converge

Content

     03      Executive Summary                 43      China
             What Diverges Will
             Eventually Converge               44      Hong Kong

                                               45      India
     10      Central Bank Outlook
                                               46      Indonesia
     13      Key Events In 3Q
                                               47      Japan
     14      FX, Interest Rate &               48      Malaysia
             Commodities Forecasts
                                               49      Philippines

                                               50      Singapore
     15      Asia Focus
             Recovery Delayed, Not Derailed    51      South Korea

     23      FOMC Focus                        52      Taiwan
             Let’s Talk About                  53      Thailand
             Talking About Tapering
                                               54      Vietnam

     27      FX Strategy                       55      Australia
             USD Weakness Drawing To A Close   56      Eurozone
             Due To Fed’s Hawkish Shift
                                               57      New Zealand
     34      Rates Strategy
                                               58      United Kingdom
             Not Buying The Drop In Yield
                                               59      United States of America
     39      Commodities Strategy
             Stay Bullish On Commodities
             As Current Rally Still Has Legs
                                               60      FX Technicals

                                               66      Commodities Technicals

                                               Information as of 18 June 2021

                                               Scan the QR Code for
                                               a list of all our reports

                                               Email: GlobalEcoMktResearch@UOBgroup.com
                                               URL: www.uob.com.sg/research
                                               Bloomberg: UOBR

    Quarterly Global Outlook 3Q 2021
2
    UOB Global Economics & Markets Research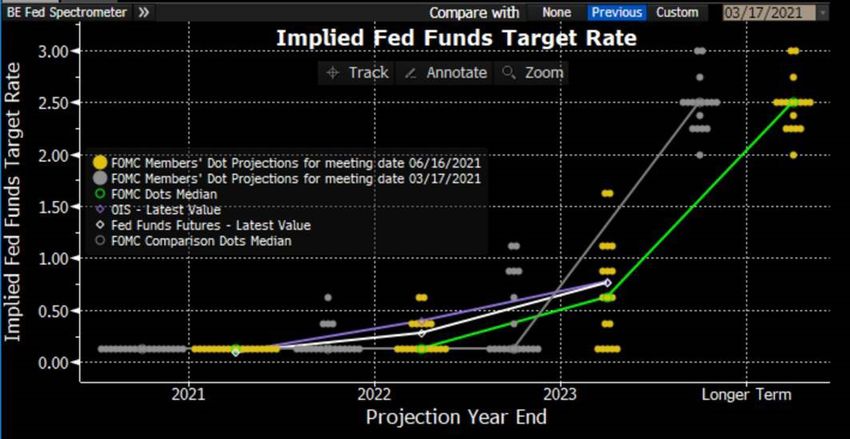
Executive   What Diverges Will Eventually Converge
         Summary
                     “There is always a divergence between our perception and what actually exists.”

                     George Soros

                     It’s been more than a year since COVID-19 first broke out. Depending on which part of the world
                     you are at, your perception of the global fight against COVID-19 can be vastly different. Some
                     US cities have already declared victory against COVID-19 and no longer makes it mandatory for
                     those who are fully vaccinated to wear masks. Whereas for many in Asia, wearing of masks is still
                     very much a daily part of life whenever we step out of our homes. As COVID-19 wears on, there
                     is an increasing divergence in growth and recovery prospects, increasing divergence in monetary
                     policies and increasing divergence between rising inflation and the nonchalant yield curve.

                      US And Europe Are Way Ahead Of Asia In Terms Of Vaccination Drive

                      Source: Macrobond, UOB Global Economics & Markets Research (* UOB Estimates)

                      45%
                      40%
                      35%
                      30%
                      25%
                      20%
                      15%
                      10%
                       5%
                       0%

                     The most obvious divergence is the stark contrast in vaccination rates between developed nations
                     vs the rest of the world. After a very shaky start, the US and Europe have now led by a wide margin
                     in terms of their efforts to get their populace vaccinated. As of 10 Jun 21, more than 42% of the
                     populations in the US and UK, and 23% of the European Union are fully vaccinated. In contrast,
                     Asia (excluding China and its OECD members) is falling far behind in vaccination efforts with only
                     2.5% of population fully vaccinated. While China does not publish official data on fully vaccinated
                     persons, its National Health Commission reported the number of administered vaccines is at about
                     845 million doses (as of 10 Jun) of which we estimated that China would have a vaccination rate
                     between 30% and 37%, much higher than the sub 5% vaccination rate for India and Indonesia.

                      Diverging Recovery Prospects For G20 Nations

                      Source: Macrobond, UOB Global Economics & Markets Research

                      8.00
                              OECD: Diverging recovery prospects for G20 nations
                      7.00    (Years to pre-pandemic GDP per capita)
                      6.00

                      5.00

                      4.00

                      3.00

                      2.00

                      1.00

                      0.00

                                                                                                        Quarterly Global Outlook 3Q 2021
EXECUTIVE SUMMARY                                                                                                                          3
                                                                                                 UOB Global Economics & Markets Research
The key consequence of this divergence in vaccination rate is the resultant divergence in recovery
                                        prospects. In its latest Economic Outlook report dated May 2021, the OECD noted that this is “No
                                        Ordinary Recovery”. While the OECD did upgrade global GDP growth this year significantly to 5.8%
                                        from its previous forecast of 4.2% made in Dec 2020, it also warned that the recovery remains
                                        uneven and vulnerable to fresh setbacks, depending on the effectiveness of vaccination programs
                                        as well as public health policies.

                                        Specifically, the OECD noted that “South Korea and the United States are reaching pre-pandemic
                                        per capita income levels after about 18 months. Much of Europe is expected to take nearly 3 years
                                        to recover. In Mexico and South Africa, it could take between 3 and 5 years.” While it is easy to make
                                        generalizations, the recovery path is wrought with much uncertainty given the unpredictable nature
                                        of the pandemic, with the latest outbreak across Asia triggered by the highly transmissible delta
                                        strain that originated from India.

   Amidst the renewed                   Our macroeconomic team has also noticed this divergence in economic recovery prospects. Amidst
    COVID-19 outbreak                   the renewed COVID-19 outbreak across Asia, the GDP growth expectations for this year for the
  across Asia, the GDP                  various economies that were more impacted by the outbreak have all been downgraded in recent
   growth expectations                  months. Specifically, India’s GDP growth was downgraded to 8.5% from 10.5%, Thailand’s GDP
     for this year for the
various economies that                  was downgraded to 1.5% from 3.5%, Indonesia’s GDP growth downgraded to 3.8% from 4.0% and
   were more impacted                   Philippines downgraded to 5.5% from 7.0%.
  by the outbreak have
  all been downgraded                   While this is clearly a setback for recovery for Asia, our view remains that this is a temporary hiccup
       in recent months.                in Asia’s growth recovery path. China’s stable growth revival, coupled with robust export rebounds
                                        across the region will help the rest of Asia to play catch up once this latest round of outbreak is
                                        brought under control. Growth across Asia should recover and converge once again towards the
                                        end of the year.

    Beyond the diverging                Beyond the diverging growth prospects, there is also divergence between the monetary policies of
        growth prospects,               the US Federal Reserve (FED) vs the rest of the Developed Market (DM) central banks. On one
              there is also             hand, a number of DM central banks have started to embark on the path of tightening monetary
     divergence between
    the monetary policies               policy. Specifically, the Central Bank of Iceland has hiked by 25 bps, the Norges Bank has guided
        of the US Federal               for a rate hike before end of this year, while both the Bank of Canada (BoC) and Reserve Bank of
    Reserve (FED) vs the                New Zealand (RBNZ) have guided for rate hikes in 2022.
    rest of the Developed
      Market (DM) central               Whereas on the other hand, the FED has until most recently insisted that inflation is transitory. Now
                    banks.
                                        that the dot plot in the latest June FOMC has brought forward the timeline for the start of the FED
                                        rate hike into 2023, this divergence between monetary policies between the FED and other DM
                                        central banks have started to converge. We now see a possible start to tapering at the end of this
                                        year, followed by the start of FED rate hike in June 2023.

                                         10 Year US Treasuries Yield Has Diverged From Rising CPI And PPI

                                         Source: Macrobond, UOB Global Economics & Markets Research

                                         12                                                                                                                     3.50
                                         10
                                                                                                                                                                3.00
                                          8
                                          6                                                                                                                     2.50

                                          4
                                                                                                                                                                2.00
                                          2
                                                                                                                                                                1.50
                                          0
                                          -2                                                                                                                    1.00
                                          -4
                                                                                                                                                                0.50
                                          -6
                                          -8                                                                                                                   0.00
                                           Jan 17   May 17 Sep 17    Jan 18   May 18 Sep 18    Jan 19   May 19 Sep 19   Jan 20   May 20 Sep 20   Jan 21   May 21
                                                        US Headline CPI (%)                US Headline PPI (%)              10Y US Treasuries Yield (%) - RHS

        Quarterly Global Outlook 3Q 2021
4                                                                                                                                           EXECUTIVE SUMMARY
        UOB Global Economics & Markets Research
Moving on to the topic of “Inflation is transitory”, there is also a clear divergence between rising
                             headline CPI and PPI figures across key economies vs the recent pullback in long term bond
                             yields. Specifically, against our expectation of further climb in the 10 year US Treasuries yield,
                             the benchmark yield has instead pulled back from its peak of 1.75% in early April and retreated
                             to current level of around 1.5%. This retreat in long term bond yield is in stark contrast and has
                             diverged noticeably from the sharp rise in various inflation indicators for the US, with headline CPI
                             jumping to 5% and headline PPI spiking to 9.5%, both for the month of May.

 While the recent spike      Is inflation indeed transitory? Or have investors got it wrong about US Treasuries? While the recent
   in inflation across 2Q    spike in inflation across 2Q can be explained away in part due to the very low base effect from last
can be explained away        year as well as various commodities supply and materials supply chain disruption, it remains to be
  in part due to the very
                             seen whether inflation will indeed pull back across 2H.
     low base effect from
      last year as well as
    various commodities      As for the pullback in long term Treasuries yield, there is evidence to suggest that it is in a large part
    supply and materials     due to flow related dynamics. In short, US money market is flushed with cash. The repo market
              supply chain   cash glut whereby the FED’s daily overnight reverse repo operations now exceeded a record USD
    disruption, it remains
                             500 bn, has extended to infect the longer end of the Treasuries market as well. Despite uncertain
      to be seen whether
inflation will indeed pull   inflation risks, the 10 year US Treasuries does look very attractive at around 1.50%, compared to
         back across 2H.     overnight repo that generates no yield at all. On this divergence, our view remains that longer term
                             yield will eventually resume their climb back up once the flow related dynamics dissipate.

                             In the commodities space, gold tried to play catch up in 2Q, to narrow the divergence between the
                             on-going strong rally in Brent crude oil above USD 70 / bbl and LME Copper to USD 10,000 / MT.
                             Will this divergence between gold and the broader commodities complex narrow in the coming
                             quarter to result in a more synchronized commodities rally?

                             In the FX space, there is also clear divergence amongst Asian currencies. Specifically, the prospects
                             for the IDR, INR and THB are likely to diverge further from the rest of the Asia FX complex which
                             trade more in sync with the CNY.

                             What will the 3rd quarter of 2021 bring? Will there be further uncertainty and divergence in terms
                             of economic prospects and monetary policies? Or will expectations normalize and converge once
                             more nations are fully vaccinated against COVID-19 and resume a more confident and sustained
                             recovery path? We hereby present our updated suite of quarterly macroeconomic, monetary policy,
                             FX, Rates and Commodities forecasts.

       FX Strategy           The latest hawkish shift by the Fed means that the current bout of USD weakness since mid- 2020
    USD Weakness             may be drawing to a close. We now expect the USD to consolidate and bottom against most Major
 Drawing To A Close          and Asian FX in 2H21 before beginning a gradual recovery in 1H22. In the Major FX space, various
      Due To Fed’s           Developed Market (DM) central banks have already started monetary policy normalisation either by
      Hawkish Shift          reducing its pace of asset purchases or hinting for a rate hike before end-2022. Rate hikes, a key
                             determinant of currency strength, would take place faster for this set of DM central banks compared
                             to the Fed where rate hikes would likely begin in mid-2023. As such, the USD repricing effect is likely
                             to be more gradual in the Major FX space. Overall, we expect DXY to bottom around 91 over the
                             next two quarters, followed by a modest recovery towards 93 by mid-2022.

                             In Asia, we made a series of growth downgrades across some Asian economies in the 2Q21 due to
                             a fresh wave of COVID-19 infections that hindered their respective economic recovery. In particular,
                             we continue to be defensive on the THB, IDR and INR. Tapering, even with the Fed keenness
                             to avoid a repeat of 2013 Taper Tantrum, would still put pressure on some Asian FX, especially
                             the above mentioned trio. For the remainder of Asian FX, a strong growth outlook this year and a
                             relatively firm CNY will lean against the emerging USD strength. As such, we expect a phase of
                             consolidation for most of USD/Asia in 2H21 before a modest uplift in 1H22. In particular, our updated
                             2Q22 forecasts for USD/CNY and USD/SGD are 6.48 and 1.36 respectively.

                                                                                                 Quarterly Global Outlook 3Q 2021
EXECUTIVE SUMMARY                                                                                                                    5
                                                                                          UOB Global Economics & Markets Research
Rates Strategy                  Investors’ focus on inflation has remained very much unabated during 2Q 2021, and this consensus
         Not Buying                  narrative for higher price pressures was validated by the 13-year high print of 5% y/y for the May
    The Drop in Yield                Consumer Price Index (CPI) this month. Breaking down the 10Y UST price action, we can see that
                                     the prevailing 10Y UST breakeven inflation has remained little changed when compared to its end
                                     1Q 2021 levels. In the absence of major shifts in inflation expectations, the 10Y UST yield change
                                     since the end of March has been driven by falling real yields. This suppression of real yields has
                                     mostly been a short-term demand and supply phenomenon instead of resulting from any material
                                     downgrades to economic growth expectation. The Fed’s latest decision to bring forward the Dot plot
                                     into 2023 for rates liftoff also validated our inflation expectations.

                                     Overall, In terms of our forecast for longer term US and SG yields, we retain the upward yield
                                     adjustment trajectory and see 2.00% as reasonable year end targets for both 10Y UST and SGS. As
                                     for shorter term US and SG yields, we retain the flat yield adjustment trajectory and see 0.18% as a
                                     reasonable yearend target for 3M US LIBOR, while 3M SOR and 3M SIBOR should settle at around
                                     0.25% and 0.40% by end 2021 respectively. Having said that, in line with our macroeconomic team’s
                                     updated timeline for the first FED rate hike, we have also brought forward our anticipated liftoff for
                                     money market rates to Jun 2023 as well.

       Commodities                   It was an eventful second quarter for the commodities complex in which LME Copper and Brent
            Strategy                 crude oil staged strong price rallies. The confluence of strong global growth recovery following the
      Stay Bullish On                post-COVID economic reopening coupled with the still very relaxed and expansionary monetary
     Commodities As                  policies across the world helped to fuel the synchronized rally in commodities across the board.
    Current Rally Still              LME Copper has now rallied to the historic level of USD 10,000 / MT. Over the near term, some
            Has Legs                 consolidation is in order given expectation of rebound in copper mine production. However, over the
                                     longer run, demand for refined copper stays strong and the projected surplus may not materialize
                                     given the stronger than expected demand from infrastructure and electronic vehicles. As such, after
                                     some consolidation at USD 10,000 / MT in 3Q21, we expect a gradual climb higher to USD 11,000
                                     / MT by 2Q22.

                                     As for Brent crude oil, the latest demand projections from OPEC were decidedly bullish. OPEC
                                     expects global GDP to grow by a strong 5.5% this year. And coupled with strong vaccination drive
                                     across the world, plus the snap back in transportation fuel demand, OPEC now forecast a jump in
                                     global oil demand to “surpass” 99 mio bpd by 4Q this year, which OPEC notes will “put us back in
                                     the range of pre-pandemic levels”. In terms of market parameters, Brent crude oil has reverted to
                                     a comfortable backwardation over the past quarter, indicative of the resumption of global demand.
                                     Overall, as long as OPEC maintains its discipline, and keeps to the current production agreement,
                                     we can expect Brent crude oil to climb further. We now expect Brent crude oil to climb up to USD
                                     80 / bbl by 2Q22.

                                     On the other hand, gold’s upside above USD 1,900 / oz is now capped by the hawkish tilt from the
                                     Fed. Most of the positive drivers for gold remain valid. These included strong rebound in China’s gold
                                     jewelry demand, slowdown in outflows from gold ETFs and relative weakness in bitcoin resulting in
                                     the pullback of the bitcoin vs gold ratio. Going forward, if inflation rises further, real yield may well
                                     head further south. This is where gold can draw strength from its traditional demand as a hedge
                                     against inflation. But Fed’s to bring forward its rate hiking cycle into 2023 has stopped gold’s 2Q
                                     rally in its tracks. While we stay positive for gold, any potential upside strength is now limited and
                                     curtailed. Overall, we lower our gold forecast and now see gold topping out at USD 1,900 oz in 1H22.

                                     Hereafter is a brief synopsis of key Focus pieces as well as key FX and Rates views.

     Quarterly Global Outlook 3Q 2021
6                                                                                                                        EXECUTIVE SUMMARY
     UOB Global Economics & Markets Research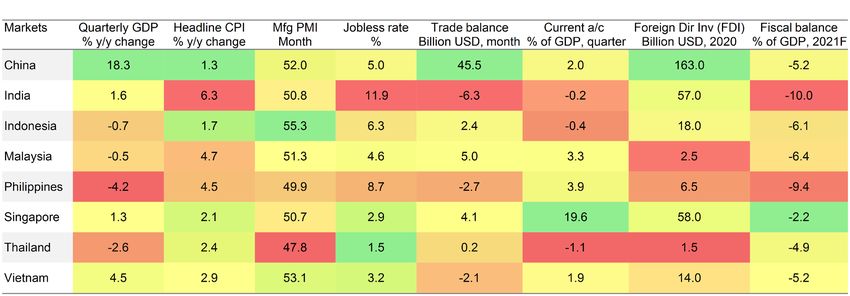
Asia Focus       Global GDP growth has been successively upgraded by international agencies, but wealthier
 Recovery Delayed,      developed economies lead in the current recovery cycle while developing economies visibly lag.
      Not Derailed      The clear differentiator of an economy’s recovery trajectory is the availability of COVID-19 vaccine.

                        Much of Asia’s recovery to date has been driven by manufacturing and the related rebound in
                        exports, but the divergence in rebound for in-person services sectors is delayed by a slow vaccine
                        rollout, thus holding back a more comprehensive recovery for many Asian economies.

                        The downside pressures from the resurgence of the pandemic and the arrival of new COVID-19
                        variants in 1H21 consequently led to us downgrading growth projections of several Asian economies
                        (such as India, Indonesia, Philippines, Malaysia and Taiwan) across 2Q21. That said, we are not
                        expecting a return to recession in 2021 for now, just a softer recovery and we anticipate gradual
                        improvements in 2H21 as vaccines become more widely available, although the likelihood of Asia
                        attaining reasonably high vaccination rates (75% of the population) within the next 12 months is
                        very low.

      FOMC Focus        In the June FOMC, the Federal Reserve’s (FED) acknowledgement of the beginning of the “talk
     Let’s Talk About   about the talk” about Quantitative Easing (QE) tapering during FOMC Chair Powell’s post-meeting
       Talking About    press conference, as well as the updated economic and interest rate projections, could now set in
             Tapering   motion for taper discussion which will lead to the fleshing out of the tapering process of its asset
                        purchase program.

                        We project the first indicative hint could be released during the Jackson Hole Symposium (26 Aug)
                        and further articulated into a pledge of the taper timeline in the 21/22 September 2021 FOMC.

                        We now expect the first taper to be carried out in December 2021 and the tapering process will
                        last for nearly 1.5 years until May 2023. Thereafter, we project two 25bps rate hikes in 2023, first to
                        0.25%-0.50% in June and then to 0.50%-0.75% in December.

           Global FX    USD/JPY: With 10-year Treasury yield                  GBP/USD: Even with steady recovery from
                        edging higher towards 2% by end-2021                  the lows last March, GBP is still attractive on
                        while 10-year Japanese Government Bond                valuations. To recall, GBP/USD was trading
                        yield stay tethered at 0% due to BOJ’s yield          above 1.45 and GBP/SGD above 1.90 before
                        curve control, a widening yield gap would             the Brexit referendum on June 2016. However,
                        spur outwardly investment and exert upward            we will moderate our trajectory for GBP/USD
                        pressure on the USD/JPY. Hence, we update             given the emerging USD. Overall, we update
                        our USD/JPY forecasts to 112 in 3Q21, 113 in          GBP/USD to be at 1.40 in 3Q21, 1.41 in 4Q21
                        4Q21 and 114 in both 1Q22 and 2Q22.                   and 1.42 in both 1Q22 and 2Q22.

                        EUR/USD: Going forth, EUR/USD may                     AUD/USD: In 2H21, global commodity prices
                        also draw further support from the bloc’s             are likely to stay well bid as more economies
                        EUR750bn recovery fund which is on track              reopening would spur further demand. Also,
                        to make its first disbursement this summer.           we expect the RBA to taper its bond buying
                        However, the latest hawkish shift from the            program to AUD75bn from AUD100 bn in July.
                        Fed is an important new catalyst that may             These are factors likely to lift sentiment on the
                        have cemented the EUR/USD’s double-top                AUD, which would be measured against the
                        at around 1.23. From here, we see a period            repricing on the USD due to the Fed’s taper.
                        of consolidation for EUR/USD at around 1.19           Overall, we expect AUD/USD to consolidate
                        across 3Q21 and 4Q21, followed by a retreat           at 0.75 in 2H21, followed by 0.74 in 1Q22 and
                        to 1.17 in 1Q22 and 1.16 in 2Q22.                     0.73 in 2Q22.

                                                                              NZD/USD: NZD/USD is still likely be
                                                                              supported at 0.70 in 2H21 due to the global
                                                                              reflation trade, strong commodity prices and
                                                                              buoyant global risk appetite. Next year, as
                                                                              repricing for the Fed rate lift-off gains traction,
                                                                              we expect NZD/USD to edge lower to 0.69 in
                                                                              1Q22 and 0.68 in 2Q22.

                                                                                           Quarterly Global Outlook 3Q 2021
EXECUTIVE SUMMARY                                                                                                                   7
                                                                                    UOB Global Economics & Markets Research
Asian FX                USD/CNY:       While the robust Chinese            USD/KRW: Now, with a strong domestic
                                    economy continues to provide the basis of          growth outlook and BOK flagging “orderly”
                                    a firm CNY, against the prospect of further        policy normalization, the KRW looks set
                                    measures by policymakers, further gains of         to catch up with its regional peers in 2H21
                                    the CNY against the USD would be more              in year-to-date gains against the USD.
                                    modest with more two-way fluctuation going         Externally, the KRW will also be underpinned
                                    forth. This is in contrast to the straight-line    by a brightening global trade outlook as more
                                    8% appreciation in the CNY in 2H20. Overall,       economies emerge from the pandemic. Next
                                    we now see mild USD/CNY strength ahead,            year, the KRW may face lesser headwinds
                                    at 6.43 in 3Q21 and 4Q21, 6.45 in 1Q22 and         from the Fed’s tapering as the BOK is expected
                                    6.48 in 2Q22, with the latter CNY weakness         to be one of the first Asian central banks to
                                    spurred by a reversion of China’s growth to        hike rates in 1Q22. Overall, our updated USD/
                                    a more sustainable level (5.7% in 2022) and        KRW forecasts are 1,110 in 3Q21 and 4Q21,
                                    broadening USD recovery.                           1,120 in 1Q22, and 1,140 in 2Q22.

                                    USD/SGD: In the case of the SGD, given             USD/MYR: Despite near-term downside
                                    the fast grip of its virus situation and an        risks to growth prospects, underlying support
                                    accelerated vaccine rollout, sentiments on         for the MYR includes healthy external
                                    the currency quickly rebounded and SGD was         positions (i.e. sustain current account surplus,
                                    seen firming back towards 1.33 /USD after a        ample foreign reserves, and continued FDI
                                    brief drop to almost 1.34 /USD. The ensuing        inflows) and higher oil prices. Increasing
                                    relaxation of social measures meant that SGD       global crude oil prices and progressive
                                    can stay bid, consolidating at 1.33 /USD till      COVID-19 immunization program to contain
                                    end-2021 in-line with a strong CNY. Next           the pandemic provides impetus for MYR
                                    year, Fed tapering will have a modest effect       recovery towards 4.14 /USD in 3Q21. After
                                    on USD/SGD, lifting the pair to 1.35 in 1Q22       which, USD/MYR will track a broad recovery
                                    and 1.36 in 2Q22.                                  in the USD as the Fed’s normalizing plans
                                                                                       come into focus. Hence we expect the pair at
                                    USD/HKD: Going forth, the Fed’s tapering           4.15 in 4Q21, 4.16 in 1Q22 and 4.17 in 2Q22.
                                    plan is likely to be the biggest determinant of
                                    USD/HKD. Drawing comparison to the 2013’s          USD/IDR: Overall, we do not expect the
                                    “Taper Tantrum”, upside volatility of USD/HKD      current bout of IDR strength to persist and we
                                    may be capped as long as the Libor-Hibor           continue to expect a higher trajectory in USD/
                                    spread stays near zero. Overall, we reiterate      IDR. Reasons to be cautious on the IDR include
                                    the view that the HKD will stay tethered to the    a persistent and widening current account
                                    stronger end of its Convertibility Undertaking     deficit and the still-high virus infection rate in
                                    at 7.75 /USD until the Fed begins its next rate    the country also casts a cloud of uncertainty
                                    hike cycle in mid-2023.                            over the expected economic recovery. More
                                                                                       importantly, the Fed’s tapering plans could
                                    USD/TWD: It is clear by now that TWD is            spur portfolio outflows and weigh on the IDR.
                                    drawing support from strong external demand        At the same time, volatility in the FX markets
                                    for its tech exports, buoyant risk appetite        could be limited by a combination of BI
                                    underpinned by global reflation, and limited       drawing down its FX reserves, intervention in
                                    impact from virus to Taiwan’s 2021 GDP.            the FX domestic-NDF or local bond markets.
                                    So, until the growth hit is significantly larger   Our updated USD/IDR forecasts at 14,700 in
                                    than expected, we remain comfortable in our        3Q21, 14,800 in both 4Q21 and 1Q22, and
                                    view for TWD staying strong at 27.7 against        14,900 in 2Q22.
                                    the USD in 2H21. Next year, as the USD
                                    recovery takes on a firmer footing, USD/TWD
                                    is expected to reverse higher, towards 28.0 in
                                    1Q22 and 28.2 in 2Q22.

    Quarterly Global Outlook 3Q 2021
8                                                                                                                    EXECUTIVE SUMMARY
    UOB Global Economics & Markets Research
Asian FX   USD/THB: With growth risks still skewed to         USD/VND: While the FX manipulator label of
                      the downside, we continue to be defensive          Vietnam was dropped in April, the US Treasury
                      on the THB. Moreover, Thailand’s previously        will continue enhanced engagements with
                      strong current account surplus – a strong factor   Vietnam on FX practices. Furthermore, the
                      that underpinned the THB’s outperformance          SBV has also reduced the frequency of its FX
                      in the past couple of years has since dwindled     intervention (to keep the VND from rising) to
                      significantly. Furthermore, the latest hawkish     once a week instead of daily from February.
                      shift from the Fed may exert further pressure      All these mean is that while the upcoming Fed
                      on the THB. Overall, we reiterate our view of      taper may weigh on the VND, depreciation
                      further THB weakness, with updated forecasts       pressures on the VND would be limited as
                      at 32.5 /USD by end-2021 and 33.2 /USD by          it invites scrutiny from US authorities. Our
                      mid-2022.                                          updated USD/VND forecasts are 23,000 in
                                                                         3Q21 and 4Q21, followed by 23,100 in 1Q22
                      USD/PHP: Both external and internal                and 23,200 in 2Q22.
                      forces remain supportive of PHP over the
                      next 6 months and would help offset part of        USD/INR: While the virus situation has
                      the depreciation pressures due to the Fed’s        seemingly improved, India’s growth outlook
                      tapering plans. As such, we see limited            remains uncertain. In addition, the latest
                      losses of the PHP to 48.70 /USD (vs spot of        double-down of bond purchases (G-SAP
                      48.40 /USD) across 3Q21 and 4Q21. Next             2.0) by the RBI in its latest June meeting and
                      year, as the Fed’s normalization comes into        India’s dual deficits are structural tailwinds
                      sharper focus together with increased political    which may continue to weigh on the INR.
                      uncertainty when Duterte’s term ends, we           Externally, the Fed tapering may also spur
                      expect the PHP to weaken further to 49.0 /         portfolio outflows and adds to the downside
                      USD in 1Q22 and 49.5 /USD in 2Q22.                 of the INR. Overall, we keep to our upward
                                                                         trajectory of USD/INR and reiterate our
                                                                         forecasts at 76.0 in 3Q21, 76.5 in 4Q21, 77.0
                                                                         in 1Q22 and 77.5 in 2Q22.

                                                                                     Quarterly Global Outlook 3Q 2021
EXECUTIVE SUMMARY                                                                                                         9
                                                                              UOB Global Economics & Markets Research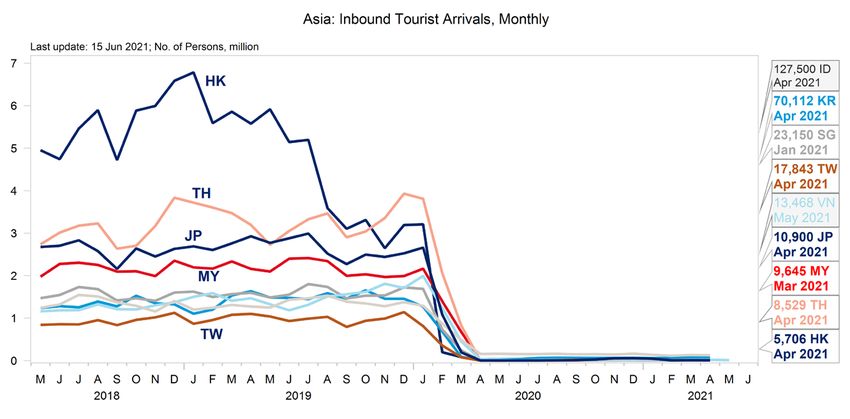
“
Central Bank
                               Current      Quantum of rate      Next        Our Forecast                          Our
Outlook                         Rate        cuts since 2020     Meeting      End-3Q 2021                       View/Outlook

                                                                                            The “talk about the talk” about QE tapering and
                                                                                            updated Dot plot during Jun FOMC could set
                                                                                            in motion for taper discussion. Jackson Hole
     FED                        0.25%             -150bps      27-28 July       0.25%       Symposium (26 Aug) could see the first hint of
     United States                                                                          taper and we expect first taper to be done in Dec
                                                                                            2021.

                                                                                            The BOJ is not expected to tighten policy anytime
                                                                                            soon and will maintain its massive stimulus in the
                                                                                            next few years. Concerns tilted to the BOJ having
     BOJ                       -0.10%                -         15-16 July      -0.10%       reached the limits of its monetary policy and will
     Japan                                                                                  remain in a holding pattern until at least April 2023.

                                                                                            The ECB’s latest announcement – that purchases
                                                                                            under the Pandemic Emergency Purchase
                                                                                            Programme (PEPP) over the coming quarter will
     ECB                        0.00%                -          22 July         0.00%       continue to be conducted at a significantly higher
     Eurozone                                                                               pace than during the first months of this year –
                                                                                            reinforces our view that the ECB will remain highly
                                                                                            accommodative for longer.

                                                                                            With “tapering” out of the way, the next question
                                                                                            will probably be how – and when – the BOE will
                                                                                            enter a formal tightening cycle. We doubt any form
     BOE                        0.10%             -65bps        24 June         0.10%       of rate increase will happen before 2023.
     United Kingdom

                                                                                            The RBA has emphasised that the cash rate path
                                                                                            will be based on actual economic outcomes and
                                                                                            will not be lifted until full employment has been
     RBA                        0.10%             -65bps         6 July         0.10%       achieved and inflation is sustainably at target. We
     Australia                                                                              do not see these conditions occurring until late-
                                                                                            2023.

                                                                                            Despite the more positive tone at the latest
                                                                                            meeting, we believe that the RBNZ would want
                                                                                            to wait for the true economic picture to become
     RBNZ                      0.25%              -75bps        14 July         0.25%       clearer. Our call remains for the OCR to be
     New Zealand                                                                            unchanged at 0.25% until at least early 2023.

                                                                                            With private consumption continuing to lag,
                                                                                            the PBOC is likely to refrain from broad-based
                                                                                            monetary policy tightening even as credit growth
     PBOC                       3.85%             -30bps        21 June         3.85%       will continue to slow. We maintain our forecast for
     China                                                                                  the benchmark 1Y LPR at 3.85% for the rest of
                                                                                            2021.

                                                                                            There is comparatively less room for the CBC
                                                                                            to raise its benchmark discount rate given that it
                                                                                            had only cut by 25 bps last year, one of the least
     CBC                       1.125%             -25bps      23 September     1.125%       amongst the Asian central banks. The COVID-19
     Taiwan                                                                                 uncertainties will likely keep the CBC on hold at
                                                                                            1.125% through 2021.

        Quarterly Global Outlook 3Q 2021
10                                                                                                                        EXECUTIVE SUMMARY
        UOB Global Economics & Markets Research
“
Central Bank Current Quantum of rate Next Our Forecast Our
Outlook Rate cuts since 2020 Meeting End-3Q 2021 View/Outlook
The BOK has signalled preparations for an orderly
interest rate normalisation at its May meeting and
sees the ultra-low interest rate contributing to
BOK 0.50% -75bps 15 July 0.50% financial risks if normalisation happens “too late”.
South Korea We expect the first rate hike to take place in 1Q22
if the positive economic outlook is sustained.
BSP has dropped its concerns on the build-up
of second round inflationary pressures in its
May monetary policy statement, and remains
BSP 2.00% -200bps 24 June 2.00% confident that the domestic economy will continue
Philippines to improve. Hence, we expect BSP to keep its
powder dry and use its ammunition with caution.
The improving economic environment and
inflationary risks for the year ahead will likely be
key factors that will determine MAS’ monetary
MAS 0% slope - October 2021 No change policy decision in October 2021. Our base case
Singapore outlook is for the MAS to keep policy parameters
unchanged in its upcoming October 2021 meeting.
With additional fiscal aids to cushion the impact of
full lockdown, we expect BNM to monitor the fluid
situation leading up to July’s meeting. Resumption
BNM 1.75% -125bps 7-8 July 1.75% of rate cuts may be tough in an environment of
Malaysia higher inflation expectations and other central
banks maintaining status quo.
Going forward, we are of the view that BI will
keep its accommodative monetary policy via
other macro prudential, and liquidity-supporting
BI 3.50% -150bps 21-22 July 3.50% measures to effectively transmit the cumulative
Indonesia 150bps reduction of the benchmark interest rate
into the economy. We keep our BI rate forecast
steady at 3.50% for the rest of the year.
We continue to observe that policy space remains
very limited, while fiscal policies will likely do the
heavy lifting in supporting economic growth. In all,
BOT 0.50% -75bps 23 June 0.50% we keep our call for BOT to leave its benchmark
Thailand rate unchanged at 0.50% for the whole of 2021.
With the uncertain outlook, it is likely for the
State Bank of Vietnam (SBV) to stay put for now
and keep its key policy rates unchanged, for the
SBV 4.00% -200bps - 4.00% refinancing rate at 4.0% and rediscounting rate at
Vietnam 2.5%.
Coupled with the strong fiscal response seen in
the recent Union Budget FY2021/22, the sovereign
bond purchases in 2H21 appears to be the choice
RBI 4.00% -115bps 6 August 4.00% policy tool to mitigate India’s slowdown. As such,
India we expect RBI to keep its policy rate unchanged at
4.0% for the whole of 2021.
Quarterly Global Outlook 3Q 2021
EXECUTIVE SUMMARY 11
UOB Global Economics & Markets ResearchReal GDP Growth Trajectory
y/y% change 2020 2021F 2022F 1Q20 2Q20 3Q20 4Q20 1Q21 2Q21F 3Q21F 4Q21F
China 2.3 9.1 5.7 -6.8 3.2 4.9 6.5 18.3 8.0 6.5 5.8
Hong Kong -6.1 6.7 3.0 -9.1 -9.0 -3.6 -2.8 7.9 7.7 5.7 5.4
India -9.0 8.5 6.0 3.0 -24.4 -7.4 0.5 1.6 19.6 8.4 6.6
Indonesia -2.1 3.8 5.0 3.0 -5.3 -3.5 -2.2 -0.7 6.2 5.0 4.9
Japan -4.7 2.5 2.2 -2.0 -10.3 -5.8 -1.4 -1.0 7.8 3.3 1.3
Malaysia -5.6 4.0 5.5 0.7 -17.2 -2.7 -3.4 -0.5 5.6 5.0 5.8
Philippines -9.6 5.5 6.5 -0.7 -17.0 -11.6 -8.3 -4.2 11.5 8.4 6.7
Singapore -5.4 5.5 3.5 0.0 -13.3 -5.8 -2.4 1.3 10.8 6.2 4.0
South Korea -0.9 3.7 3.0 1.5 -2.6 -1.0 -1.1 1.9 5.6 3.7 3.6
Taiwan 3.1 5.9 3.0 2.5 0.3 4.3 5.1 8.9 7.6 3.5 3.7
Thailand -6.1 1.5 3.5 -2.1 -12.1 -6.4 -4.2 -2.6 6.3 2.3 0.8
Vietnam 2.9 6.7 6.8 3.7 0.4 2.7 4.5 4.5 7.0 7.3 8.0
Australia -2.4 4.3 3.2 1.4 -6.3 -3.7 -1.1 1.1 8.4 5.9 3.9
Eurozone -6.6 4.4 4.7 -3.3 -14.6 -4.1 -4.9 -1.3 12.5 2.2 4.3
New Zealand -1.2 4.9 3.3 0.3 -9.2 3.1 1.2 3.6 13.2 0.5 2.3
United Kingdom -10.0 4.7 5.5 -2.2 -21.0 -8.7 -7.8 -8.4 15.6 4.9 6.5
United States (q/q SAAR) -3.5 6.8 2.8 -5.0 -31.4 33.4 4.3 6.4 13.4 3.6 4.1
Note that India’s annual growth refers to its fiscal year print
Source: CEIC, UOB Global Economics & Markets Research
Heat Map Of Key Macro Indicators In The Region
Source: Macrobond, UOB Global Economics & Markets Research
Quarterly Global Outlook 3Q 2021
12 EXECUTIVE SUMMARY
UOB Global Economics & Markets ResearchKey Events In 3Q 2021
July August September
1 July August September
The Communist Party of China China’s Beidaihe meeting, or Russia Legislative Elections
(CPC), which has ruled China “summer summit” is where will be held on or before 19
since 1949, to mark 100th China’s leaders and elders September, to define the
anniversary. from earlier generations have composition of the Russian
an informal, closed-door Parliament’s lower chamber
discussion. (the State Duma) for the next
7-11 July five years.
G20 Finance Ministers and
central bank governors meeting
in Venice, Italy. Negotiation
on international corporate tax
changes could take center
stage.
21-22 September
Federal Reserve policy makers
may articulate their QE tapering
23 July - 8 August timeline in their September
The 2020 Summer Olympics FOMC.
will be held in Tokyo, Japan.
Expect a scale-down event
as overseas spectators are
banned, and stringent health 26-28 August 26 September
protocols for athletes and Kansas City Fed Reserve’s German Federal Election 2021:
officials. annual economic policy Germans will be voting to elect
symposium in Jackson Hole, the 20th Bundestag. The result
Wyoming, is a potential risk – after coalition negotiations
event for Fed to make tapering likely to involve two or three
announcement. In the past, parties – will decide who will
the Jackson Hole Symposium succeed Angela Merkel, who is
has occasionally been used as standing down after 16 years as
a platform to signal major Fed Chancellor.
policy changes.
28 August
The Taiwan Referendum is
meant to settle the debate on:
import of American pork, which
31 July contains ractopamine and
The US Debt Ceiling is the energy security related issues.
maximum amount the US
government is allowed to borrow
to meet its financial obligations.
The Congress voted in July 2019
to suspend the debt limit till 31
July this year. The US national
debt currently exceeds a record
US$28 trillion (as of 16 Jun
2021).
Quarterly Global Outlook 3Q 2021
13
UOB Global Economics & Markets ResearchFX, Interest Rates & Commodities
FX 17 Jun 21 3Q21F 4Q21F 1Q22F 2Q22F RATES 17 Jun 21 3Q21F 4Q21F 1Q22F 2Q22F
USD/JPY 110 112 113 114 114 US Fed Funds Rate 0.25 0.25 0.25 0.25 0.25
EUR/USD 1.19 1.19 1.19 1.17 1.16 USD SOFR 0.01 0.11 0.11 0.11 0.19
USD 3M LIBOR 0.13 0.15 0.18 0.20 0.20
GBP/USD 1.39 1.40 1.41 1.42 1.42
US 10Y Treasuries Yield 1.52 1.75 2.00 2.10 2.25
AUD/USD 0.76 0.75 0.75 0.74 0.73
JPY Policy Rate -0.10 -0.10 -0.10 -0.10 -0.10
NZD/USD 0.70 0.70 0.70 0.69 0.68
EUR Refinancing Rate 0.00 0.00 0.00 0.00 0.00
DXY 91.9 91.7 91.8 92.8 93.2 GBP Repo Rate 0.10 0.10 0.10 0.10 0.10
AUD Official Cash Rate 0.10 0.10 0.10 0.10 0.10
USD/CNY 6.45 6.43 6.43 6.45 6.48 NZD Official Cash Rate 0.25 0.25 0.25 0.25 0.25
USD/HKD 7.76 7.75 7.75 7.75 7.75 CNY 1Y Loan Prime Rate 3.85 3.85 3.85 3.85 3.85
USD/TWD 27.76 27.70 27.70 28.00 28.20 HKD Base Rate 0.50 0.50 0.50 0.50 0.50
USD/KRW 1,132 1,110 1,110 1,120 1,140 TWD Official Discount Rate 1.13 1.13 1.13 1.13 1.13
KRW Base Rate 0.50 0.50 0.50 0.75 0.75
USD/PHP 48.39 48.70 48.70 49.00 49.50
PHP O/N Reverse Repo 2.00 2.00 2.00 2.00 2.00
USD/MYR 4.14 4.14 4.15 4.16 4.17 SGD SORA 0.11 0.16 0.16 0.16 0.24
SGD 3M SIBOR 0.43 0.40 0.40 0.40 0.40
USD/IDR 14,355 14,700 14,800 14,800 14,900
SGD 3M SOR 0.24 0.25 0.25 0.25 0.25
USD/THB 31.39 32.00 32.50 32.80 33.20
SGD 10Y SGS 1.47 1.70 1.95 2.05 2.15
USD/VND 22,964 23,000 23,000 23,100 23,200
MYR O/N Policy Rate 1.75 1.75 1.75 1.75 1.75
USD/INR 74.08 76.00 76.50 77.00 77.50 IDR 7D Reverse Repo 3.50 3.50 3.50 3.75 4.00
THB 1D Repo 0.50 0.50 0.50 0.50 0.50
USD/SGD 1.34 1.33 1.33 1.35 1.36 VND Refinancing Rate 4.00 4.00 4.00 4.00 4.00
EUR/SGD 1.60 1.58 1.58 1.58 1.58 INR Repo Rate 4.00 4.00 4.00 4.00 4.00
GBP/SGD 1.87 1.86 1.88 1.92 1.93
COMMODITIES 17 Jun 21 3Q21F 4Q21F 1Q22F 2Q22F
AUD/SGD 1.01 1.00 1.00 1.00 0.99
Gold (USD/oz) 1,779 1,800 1,850 1,900 1,900
SGD/MYR 3.09 3.11 3.12 3.08 3.07
Brent Crude Oil (USD/bbl) 73 73 76 80 80
SGD/CNY 4.81 4.83 4.83 4.78 4.76
JPY/SGDx100 1.22 1.19 1.18 1.18 1.19 LME Copper (USD/mt) 9,316 10,000 10,500 11,000 11,000
Quarterly Global Outlook 3Q 2021
14 FORECASTS
UOB Global Economics & Markets ResearchASIA Recovery Delayed, Not Derailed
FOCUS
Global GDP growth has been successively upgraded by international agencies, but wealthier
developed economies lead in the current recovery cycle while developing economies visibly
lag. The clear differentiator of an economy’s recovery trajectory is the availability of COVID-19
vaccine.
Much of Asia’s recovery to date has been driven by manufacturing and the related rebound
in exports, but the divergence in rebound for in-person services sectors is delayed by a
slow vaccine rollout, thus holding back a more comprehensive recovery for many Asian
economies.
The downside pressures from the resurgence of the pandemic and the arrival of new
COVID-19 variants in 1H21 consequently led to us downgrading growth projections of
several Asian economies (such as India, Indonesia, Philippines, Malaysia and Taiwan) across
2Q21. That said, we are not expecting a return to recession in 2021 for now, just a softer
recovery and we anticipate gradual improvements in 2H21 as vaccines become more widely
available, although the likelihood of Asia attaining reasonably high vaccination rates (75% of
the population) within the next 12 months is very low.
Upgraded Global After the sharp declines in business activities globally due to COVID-19 pandemic in 2020 (especially
Growth Outlook during 2Q and 3Q), the economic growth outlook in 2021 is much brighter due to the additional
But Divergence fiscal support in key large economies (US, Eurozone), the accelerated vaccine rollout and take-up
In Parts of Asia rates (especially in developed economies), better disease prevention and control measures (for
some countries/regions), gradual return/adapting to “a new normal”, and low base of comparisons
(notwithstanding the subsequent resurgence of COVID-19 infections).
Across the second quarter, international agencies including the International Monetary Fund (IMF),
in its Apr 2021 WEO, upgraded its global economic growth forecast to 6% in 2021 (from 5.5% made
previously in Jan 2021), after an estimated contraction of 3.3% in 2020. At 6%, that will be the
fastest pace of global growth since 1976 but also comes off the steepest annual downturn of the
post-war era last year as the pandemic brought commerce around the world to a near stand-still
at times. That upgrade largely reflected a rapidly brightening outlook for the US economy, which
the IMF projected growing by 6.4% in 2021, the fastest since the early 1980s (UOB Est 6.8%).
Meanwhile, the Organisation for Economic Cooperation and Development (OECD) on 31 May, also
revised its global economic growth higher to 5.8% this year and 4.4% in 2022 (from its estimates
of 5.6% and 4.0% respectively in its previous forecasts released in March) as did the World Bank
(8 Jun) which projected global growth to reach 5.6% in 2021, and thereafter to moderate to 4.3% in
2022, and then to 3.1% in 2023.
While it is good news to see growth rates turning positive and the worst phase of the pandemic
over, a number of countries and regions are seeing new waves of infections (from India to Thailand,
and many developing economies where the vaccine rollout is at a less advanced stage compared
to developed economies), and some are back into lockdown mode again – a reminder that this
pandemic is still with us and remains a global challenge and a huge uncertainty, especially in the
very near term.
While the downside Even as the global economy returns to growth, it will be an uneven recovery differentiated across
risks to growth are economies with developed economies (led by the US) leading the charge, while many developing
more pronounced
economies lagged as the availability of vaccines appear to be the clear differentiator of an economy’s
versus the upside risks,
we are not expecting recovery trajectory. That said, while the downside risks to growth are more pronounced versus the
a return to recession upside risks, especially in the immediate two quarters (as shown by the “pessimistic” scenario in
in 2021 for now, just a the growth trajectory charts and table below), we are not expecting a return to recession in 2021 for
softer recovery. now, just a softer recovery.
Quarterly Global Outlook 3Q 2021
ASIA FOCUS 15
UOB Global Economics & Markets ResearchMuch of Asia’s Much of Asia’s recovery to date has been driven by manufacturing and the related rebound in
recovery to date exports. And within these economies, while some sectors are affected less and are even thriving
has been driven by (such as electronics-related manufacturing and e-commerce), other sectors and employees are
manufacturing and
the related rebound still under pressure from social distancing measures, movement restrictions, and extended border
in exports. closures (such as tourism/travel, aviation, accommodation, entertainment, F&B, among others).
The divergence and delayed rebound of in-person services sectors is thus holding back a more
comprehensive recovery for many Asian economies.
ASEAN’s economy China’s 2020 GDP expansion of 2.3% stood out as one of the few economies with positive growth
is likely to rebound in amid the pandemic. We expect 2021 GDP growth of 9.1% in anticipation of stronger pent-up
2021 by about 4.9% demand as vaccination programs worldwide get underway. As a whole, ASEAN’s economy is
on the back of strong
likely to rebound in 2021 by about 4.9% (2020: –3.4%) on the back of strong Asia macroeconomic
Asia macroeconomic
numbers especially numbers especially that of exports, with the region led by China’s economic recovery.
that of exports, with the
region led by China’s But the downside pressures have arisen from the resurgence of the pandemic and the arrival of
economic recovery. new COVID-19 variants in 1H21. As a consequence, we downgraded growth outlook of several
Asian economies (such as India, Indonesia, Philippines, Malaysia and Taiwan) across 2Q21 before
the projected gradual improvements in 2H21 as vaccines will likely become more widely available.
However, the likelihood of Asia attaining reasonably high vaccination rate within the next 12 months
is still low, based on available data and our estimates.
Chart 1: After The 2020 Plunge, World Trade Has Recovered Robustly
With Asia Leading The Upward Momentum…
Source: Macrobond, UOB Global Economics & Markets Research
Chart 2: …In Tandem With The Surge In Asian Industrial Production
From The COVID-19 Induced Declines More Than One Year Ago
Source: Macrobond, UOB Global Economics & Markets Research
Quarterly Global Outlook 3Q 2021
16 ASIA FOCUS
UOB Global Economics & Markets ResearchChart 3: However, Tourism Numbers Remain Well Below Pre-Pandemic Levels….
Source: Macrobond, UOB Global Economics & Markets Research
Chart 4: …And The Economies Which Are Most Dependent On Tourism,
Are Worst Hit As Would Be Expected
Source: Macrobond, UOB Global Economics & Markets Research
Quarterly Global Outlook 3Q 2021
ASIA FOCUS 17
UOB Global Economics & Markets ResearchSelected ASEAN Economies – With the ongoing pandemic, below we outline the divergence and
downside uncertainty (as shown by the spread between base and pessimistic scenarios) which is
likely to be the widest in 2Q and 3Q 2021, before narrowing in the subsequent quarters.
INDONESIA Growth Trajectory – Base, Optimistic, Pessimistic
10.0
8.0
6.0
4.0
2.0
0.0
-2.0
-4.0
-6.0
1Q20 2Q20 3Q20 4Q20 1Q21 2Q21F 3Q21F 4Q21F 1Q22F 2Q22F 3Q22F 4Q22F
Base Pessimistic Optimistic
Risk Factors To Recovery And Growth Outlook
Downside - a sudden upturn in cases due to the emerging COVID-19 variant, which could
diminish the recovery prospects. The country’s ability to minimize the virus spread amidst the
ongoing vaccination drive and continuation of the fiscal support will be the key to growth trajectory.
Upside - the approval of a private vaccination program (namely Gotong Royong vaccination
program) will help to accelerate the inoculation rate.
MALAYSIA
Growth Trajectory – Base, Optimistic, Pessimistic
10.0
5.0
0.0
-5.0
-10.0
-15.0
-20.0
1Q20 2Q20 3Q20 4Q20 1Q21 2Q21F 3Q21F 4Q21F 1Q22F 2Q22F 3Q22F 4Q22F
Base Pessimistic Optimistic
Risk Factors To Recovery And Growth Outlook
Downside - ongoing pandemic related uncertainties, if stricter containment measures are rein-
troduced or extended further, slow vaccine roll-out, weaker-than-expected global recovery, high-
er cost pressures, and taper tantrum risks that could exacerbate financial volatility and Ringgit
weakness.
Upside – If vaccination rates accelerate and domestic COVID-19 infection rate is contained that
allows more economic sectors to reopen on a sustained basis and normalise, effectiveness of
fiscal measures, a stronger-than-expected global recovery.
(Domestic political developments when state of emergency ends on 1 Aug 2021 also plays a
critical role in the economic landscape).
Quarterly Global Outlook 3Q 2021
18 ASIA FOCUS
UOB Global Economics & Markets ResearchPHILIPPINES Growth Trajectory – Base, Optimistic, Pessimistic
20.0
15.0
10.0
5.0
0.0
-5.0
-10.0
-15.0
-20.0
1Q20 2Q20 3Q20 4Q20 1Q21 2Q21F 3Q21F 4Q21F 1Q22F 2Q22F 3Q22F 4Q22F
Base Pessimistic Optimistic
Risk Factors To Recovery And Growth Outlook
Downside - could mainly emanate from further extension of stricter community quarantine, delays
in vaccine supplies and inoculation program, heightened global commodity supply constraints
which stoke CPI inflation beyond the central bank’s target range, and year-end weather-related
natural disasters.
Upside – mainly from a faster-than-expected safe reopening of economy following a progressive
vaccination program, a stronger-than-expected global recovery that lifts the nation’s exports and
overseas remittances inflows, further improvement in outsourcing activities due to higher global
digital adoption, and expedition in government’s mega projects
SINGAPORE
Growth Trajectory – Base, Optimistic, Pessimistic
15.0
10.0
5.0
0.0
-5.0
-10.0
-15.0
1Q20 2Q20 3Q20 4Q20 1Q21 2Q21F 3Q21F 4Q21F 1Q22F 2Q22F 3Q22F 4Q22F
Base Pessimistic Optimistic
Risk Factors To Recovery And Growth Outlook
Downside - a re-spike of COVID-19 cases, which result in another circuit breaker in 2H21, GDP
growth may fall to as low as 3.0% in 2021.
Upside - improving global economic backdrop, uptick in semiconductor demand, and Singapore’s
continued success in vaccinating its population against COVID-19.
Quarterly Global Outlook 3Q 2021
ASIA FOCUS 19
UOB Global Economics & Markets ResearchTHAILAND Growth Trajectory – Base, Optimistic, Pessimistic
10.0
5.0
0.0
-5.0
-10.0
-15.0
1Q20 2Q20 3Q20 4Q20 1Q21 2Q21F 3Q21F 4Q21F 1Q22F 2Q22F 3Q22F 4Q22F
Base Pessimistic Optimistic
Risk Factors To Recovery And Growth Outlook
Downside - one of Asia’s most affected economy since 2020, the resurgence of COVID-19 is the
key reason for Thailand’s relatively softer performance year-to-date.
Upside - a quick resolution to managing COVID-19 through an acceleration of vaccination of its
population could see Thailand’s borders reopening by 4Q21.
VIETNAM
Growth Trajectory – Base, Optimistic, Pessimistic
10.0
9.0
8.0
7.0
6.0
5.0
4.0
3.0
2.0
1.0
0.0
1Q20 2Q20 3Q20 4Q20 1Q21 2Q21F 3Q21F 4Q21F 1Q22F 2Q22F 3Q22F 4Q22F
Base Pessimistic Optimistic
Risk Factors To Recovery And Growth Outlook
Downside - vulnerable to further business disruptions given the slow pace of vaccination and
presence of more contagious virus variants.
Upside – In a much better position to handle outbreaks and the government is aiming to secure
150 million vaccine doses this year to cover 70% of its population.
Quarterly Global Outlook 3Q 2021
20 ASIA FOCUS
UOB Global Economics & Markets ResearchBased on the spread between the base case and the other two scenarios, most of the Asian economies seem to be seeing
the balance of risks to GDP growth more to the downside, except for some exceptions like China, Japan and New Zealand.
Real GDP Growth Trajectory
Scenario Actual Base Optimistic Pessimistic
y/y% change 2020 2021F 2022F 2021F Diff 2022F Diff 2021F Diff 2022F Diff
China 2.3 9.1 5.7 9.7 0.6 6.0 0.3 8.7 -0.4 5.5 -0.2
Hong Kong -6.1 6.7 3.0 7.6 0.9 3.7 0.7 5.5 -1.2 2.5 -0.5
India -9.0 8.5 6.0 10.0 1.5 7.0 1.0 6.5 -2.0 5.0 -1.0
Indonesia -2.1 3.8 5.0 4.8 1.0 5.5 0.5 2.0 -1.8 4.0 -1.0
Japan -4.7 2.5 2.2 4.0 1.5 2.6 0.4 1.7 -0.8 2.0 -0.2
Malaysia -5.6 4.0 5.5 5.0 1.0 6.0 0.5 3.0 -1.0 4.5 -1.0
Philippines -9.5 5.5 6.5 6.7 1.2 6.8 0.3 4.3 -1.2 6.2 -0.3
Singapore -5.4 5.5 3.5 6.5 1.0 4.0 0.5 3.0 -2.5 2.5 -1.0
South Korea -0.9 3.7 3.0 4.3 0.6 3.6 0.6 3.0 -0.7 2.6 -0.4
Taiwan 3.1 5.9 3.0 6.5 0.6 3.8 0.8 5.0 -0.9 3.0 0.0
Thailand -6.1 1.5 3.5 2.0 0.5 4.0 0.5 0.0 -1.5 2.5 -1.0
Vietnam 2.9 6.7 6.8 7.1 0.4 7.0 0.2 5.4 -1.3 6.9 0.1
Australia -2.4 4.8 3.2 5.8 1.0 4.2 1.0 2.0 -2.8 2.3 -0.9
New Zealand -1.2 4.0 3.3 5.2 1.2 4.7 1.4 3.0 -1.0 1.4 -1.9
Source: CEIC, UOB Global Economics & Markets Research Esitmates and Forecasts
For India, full-year growth are illustrated based on its fiscal calendar
Looking from the perspective of real GDP returning to pre-pandemic level (4Q 2019), it is quite telling that most of the North
Asian economies have already done so by 1Q 2021, but most of the ASEAN economies are likely to achieve that much later
this year. The extreme differences are between Vietnam (already exceeded in 1Q 2021) and Thailand (to exceed only by 4Q
2022, well lagging behind its ASEAN peers).
The Quarter When Real GDP Level (seasonally adjusted where available) Exceed GDP of 4Q 2019
y/y% change 4Q19 3Q20 4Q20 1Q21 2Q21F 3Q21F 4Q21F 1H22F 2H22F 1H23F
China Based on index level x
Hong Kong HKD 695.89bn x
India INR 36.1tln x
Indonesia IDR 2,770tln x
Japan JPY 547tln x
Malaysia MYR 355.7bn x
Philippines PHP 4.92tln x
Singapore SGD 121.8bn x
South Korea KRW 469.78tln x
Taiwan NTD 4.87tln x
Thailand THB 2.8tln x
Vietnam VND 1,214tln (non SA) x
Australia AUD 497bn x
Eurozone EUR 2.85tln x
New Zealand NZD 66.1bn x
UK GBP 545bn x
US USD 19.354tln x
Source: CEIC, UOB Global Economics & Markets Research Esitmates and Forecasts
Quarterly Global Outlook 3Q 2021
ASIA FOCUS 21
UOB Global Economics & Markets ResearchWith the exception of Singapore, most of the ASEAN economies are unlikely to achieve 75% of fully vaccinated population in the next
12 months. That implies, a longer wait for the recovery of in-person services sectors such as tourism, and in turn, will hold back a more
broad-based recovery for these economies.
Timeline For 75% of Population Fully Vaccinated (UOB Estimates)
y/y% change 2Q21F 3Q21F 4Q21F 1Q22F 2Q22F 3Q22F 4Q22F 1Q23F 2Q23F 3Q23F 4Q23F Beyond 2023
China x
Hong Kong x
India x
Indonesia x
Japan x
Malaysia x
Philippines x
Singapore x
South Korea x
Taiwan x
Thailand x
Vietnam x
Australia x
Eurozone x
New Zealand x
UK x
US x
Source: Macrobond, UOB Global Economics & Markets Research Esitmates and Forecasts
Quarterly Global Outlook 3Q 2021
22 ASIA FOCUS
UOB Global Economics & Markets ResearchFOMC Let’s Talk About Talking About Tapering
FOCUS
In the June FOMC, the Federal Reserve’s (FED) acknowledgement of the beginning of the
“talk about the talk” about Quantitative Easing (QE) tapering during FOMC Chair Powell’s
post-meeting press conference, as well as the updated economic and interest rate projections,
could now set in motion for taper discussion which will lead to the fleshing out of the tapering
process of its asset purchase program.
We project the first indicative hint could be released during the Jackson Hole Symposium (26
Aug) and further articulated into a pledge of the taper timeline in the 21/22 September 2021
FOMC.
We now expect the first taper to be carried out in December 2021 and the tapering process
will last for nearly 1.5 years until May 2023. Thereafter, we project two 25bps rate hikes in
2023, first to 0.25%-0.50% in June and then to 0.50%-0.75% in December.
FED Begins Post-June 2021 FOMC decision, we have revised our Quantitative Easing (QE) tapering timeline
“Talking About and brought forward our FED rate hike expectations to 2023 (up from 2024).
The Talk” For
QE Taper Even though the June FOMC statement was largely within expectations, the factors that shifted
our FED policy timeline were FOMC Chair Powell’s post-meeting press conference, the updated
economic (updated Summary of Economic Projections) and interest rate projections (Dot plot chart).
1. Inflation while transitory, may be an increasing concern - The FED, as widely expected,
kept its policy rates and asset purchase program unchanged in its June FOMC. It also made
no change to its inflation assessment in the FOMC text as it continued to succinctly note that
“Inflation has risen, largely reflecting transitory factors” (same as April FOMC).
That said, the most material adjustment to the forecasts was seen for 2021 inflation as both
headline and core PCE in 2021 were revised higher, to 3.4% (previous forecast: 2.4%) and
3.0% (previous forecast: 2.2%) respectively. This was not unexpected given the recent price
developments, but FED’s transitory theme remained intact as the subsequent inflation in 2022
(2.1%) and 2023 (2.2%) were similar to previous forecasts while the long term PCE inflation
remains anchored at 2%. (Please refer to Table in our report, US Jun 21 FOMC: Talk About
Taper Talk, With Hikes Brought Forward To 2023, dated 17 Jun 2021)
During his post-decision press conference, FOMC Chair Powell while maintaining his mantra
that the recovery is incomplete, risks remain and “substantial further progress” still some way off,
he highlighted inflation has increased notably in recent months and will likely remain elevated
in coming months before moderating. He added that there is upward pressure from rebound in
spending and the bottleneck effects putting upward pressure on inflation have been larger than
anticipated. He assessed that inflation could turn out to be higher and more persistent than the
FED expected, and the central bank would be prepared to adjust policy if inflation expectation
moved too high. He also did not dismiss the possibility that inflation will stay high for longer
than expected, and feed into expectations, and that by 2023, the FED views that inflation will
be higher in relation to high employment. All these comments signaled a hawkish outlook
for inflation, in our view.
Quarterly Global Outlook 3Q 2021
FOMC FOCUS 23
UOB Global Economics & Markets Research2. Shifting rate hike expectations towards 2023 among FOMC participants – According to
its updated June summary of economic projections and its Dot plot chart, the FOMC will still
keep its policy rates at 0.0%-0.25% range (median at 0.1%) in 2021 and 2022, but the median
view of the appropriate FED funds rate at end-2023 has now moved up to 0.6% (from 0.1%
previously in March).
Importantly, the number of the FOMC’s 19 participants (including voters and non-voters for this
year’s FOMC) have turned less dovish: 7 participants now expecting a rate hike in 2022 (up
from just 4 participants in March 2021 FOMC) while 13 participants (a majority) now expect
a hike in 2023 (up from 7 in March). Of this majority, 11 participants expect at least two 25bps
rate hikes.
During the press conference, Powell noted that many participants forecast conditions for lift-
off will be met sooner than previously thought although he was also quick to clarify that the
Dot plot projections do not represent a committee decision or plan. That said, the bias for rate
normalization has clearly shifted away from the previous line in the sand (i.e. 2024).
3. FOMC Chair Powell is shifting position too – That’s right. Powell looked like he has shifted from
his previous position of “it is not time yet” to begin talking about QE taper, to acknowledging
that officials discussed the cutting back on its bond-buying program at the June FOMC,
characterizing it as “talking about talking about” meeting.
Powell noted “assuming that is the case (of continued progress ahead toward that objective), it
will be appropriate to consider announcing a plan for reducing our asset purchases at a future
meeting. So at coming meetings the committee will continue to assess the economy’s progress
toward our goals and will give advanced notice before announcing any decision. The timing, of
course, will depend on the pace of that progress and not on any calendar.”
Another important point was that Powell viewed that progress toward the FED’s dual
employment and inflation goals was happening somewhat faster than anticipated. He
particularly noted the sharp rebound in growth that now has the FED seeing GDP growth at
7% in 2021.
FOMC Outlook – While the latest June FOMC statement contained no surprises, the comments from Powell’s press
QE Tapering Could conference and the updated economic and interest rate projections, suggest to us that there is a
Now Happen By shift forward in the FED policy timeline. The beginning of the “talk about the talk” of QE taper could
End-2021, Rate now be set in motion for taper discussion which will lead to the fleshing out of the tapering process
Hikes By Mid-2023 of its asset purchase program.
In our view, the In our view, the first indicative hint of taper could be released during the annual Jackson Hole
first indicative hint Symposium (26 Aug) and further articulated into a pledge of the taper timeline in the 21/22
of taper could be September 2021 FOMC.
released during the
annual Jackson Hole
Symposium. We now expect the first taper to be carried out in December 2021 and the tapering process
will last for nearly 1.5 years until May 2023. Thereafter, we project two 25bps rate hikes in
2023, first to 0.25%-0.50% in June and then to 0.50%-0.75% in December.
If all these factors This is premised on the return to economic/social normalcy on the continued successful rollout of
remain in place, vaccinations across the US, additional US stimulus in the form of Biden’s infrastructure spending,
and with the US the continued jobs recovery in the current cycle (which remains about 7 million jobs below pre-
economy, jobs
pandemic level but is picking up pace in recent months), and barring a serious resurgence in
market and inflation
continue their COVID-19 infections and deaths due to COVID-19 variants. If all these factors remain in place, and
uptrend, then the with the US economy, jobs market and inflation continue their uptrend, then the taper talk will quickly
taper talk will quickly become more than just “talk”.
become more than
just “talk”.
Quarterly Global Outlook 3Q 2021
24 FOMC FOCUS
UOB Global Economics & Markets ResearchYou can also read