Quarterly Global Outlook 1Q 2020 - Macro Stabilisation Versus Trade Tirades In Year Of The Rat - UOB
←
→
Page content transcription
If your browser does not render page correctly, please read the page content below

Quarterly Global Outlook 1Q 2020
Macro Stabilisation Versus
Trade Tirades In Year Of The Rat

Quarterly Global Outlook 1Q2020
Macro Stabilisation Versus
Trade Tirades In Year Of The Rat

As we usher in a new decade & a          Our base case (at 65%) is still for US
new cycle of the Lunar calendar,         and China to sign the Phase 1 trade
the central theme for 2020 looks to      deal by end-2019 or early 2020
be an extension of the key risks in      with the US delaying or cancelling
2019: the global growth slowdown         additional tariffs scheduled for mid-
amidst ongoing US-China trade            Dec. The next phase is unlikely to
developments. Even as most major         be achieved in 2020 as it covers
economies have downgraded their          areas where both US and China
growth forecasts for 2020, macro         have little common ground while the
developments could see some              negotiations will take place in a year
stabilization on the horizon. And we     when the US will be distracted by
emphasize it is stabilization, not the   domestic political issues.
decisive growth recovery just yet.
                                         Geopolitics will stay in the spotlight
And yet crucially, a lot still depends   for 2020, including various elections
on the outcome of the US-China           in Asia-Pacific and most importantly,
negotiations and 15 Dec (2019)           the Trump Impeachment proceeding
could be a key date.                     and the US Presidential elections.

“I am an optimist. It does not seem to be much use being anything else.”

Winston Churchill
CONTENT

06      EXECUTIVE SUMMARY                      39   China
        Macro Stabilisation Versus
                                               40   Hong Kong
        Trade Tirades In Year Of The Rat
                                               41   India
                                               42   Indonesia
13      FX, INTEREST RATE &
        COMMODITIES FORECASTS                  43   Japan
                                               44   Malaysia
14      ASEAN FOCUS I
        Mega Trade Deal Is Further Boost       45   Myanmar
        To ASEAN’s Long-Term Potential         46   Philippines
                                               47   Singapore
17      ASEAN FOCUS II
        ASEAN-5: Has The Slowdown              48   South Korea
        In Growth And Trade Bottomed?
                                               49   Taiwan

21      INDONESIA FOCUS                        50   Thailand
        Recap Of 2019 And Quick Take           51   Vietnam
        On 2020 Assets Market
                                               52   Australia
24      MALAYSIA FOCUS                         53   Eurozone
        Budget 2020 Key Takeaways
                                               54   New Zealand
                                               55   United Kingdom
25      FX STRATEGY
                                               56   United States of America
        Recovery In Risk Appetite
        To Weigh On The USD
                                               57   FX Technicals
30      RATES STRATEGY
        2020 Singapore Bond Market Outlook:    63   Commodities Technicals
        Range Bound Yield Expectation Begins
        With Chunky Duration

35      COMMODITIES STRATEGY
        Gold Cools Down As Brent Crude Oil
        And LME Copper Outlook Improve

Information as of 05 December 2019

Scan the QR Code for
a list of all our reports

Email: GlobalEcoMktResearch@UOBgroup.com
URL: www.uob.com.sg/research
Bloomberg: UOBR
EXECUTIVE SUMMARY
Macro Stabilisation Versus
Trade Tirades In Year Of The Rat
As we usher in a new decade & a new decisive growth recovery just yet. While In Asia, the unequivocal attention
cycle of the Lunar calendar, the central IMF’s global growth estimate for 2020 continues to be on China, the epicenter
theme for 2020 looks to be an extension was also lowered, it is nonetheless of the global growth slowdown, but
of the key risks in 2019: the global expected to be higher at 3.4%, an we have kept our growth forecast
growth slowdown amidst ongoing US- improvement from 2019. Among unchanged at 5.9% in 2020 (from
China trade developments. The health the developed economies, the US the expected 6.1% in 2019) on the
of the global economy continued to continues to fare better than the rest, assumption of no major escalation in
deteriorate in line with the escalation even amidst conflicting signals from its US-China tensions. And as China is
of US-China trade tensions. From economic data, although US growth is slowing, so will the rest of Asia. That
2018’s 3.6% global growth rate, the still seen slowing from 2.5% in 2019 to said, there are pockets of growth
IMF has downgraded 2019’s growth 1.5% in 2020. A similar outlook faces the recovery and some economies are
rate further to 3.0% in its October WEO Eurozone as growth momentum falters benefitting from the shift in supply chain
(from 3.2% made in Jul), making it the but the bloc is still expected to etch out as a result of the on-going US-China
worst year since 2008/2009. It was also positive growth, albeit lower at 1.0% in trade tensions, such as Taiwan in North
accompanied by stark warnings about 2020 (from a projected 1.1% in 2019). Asia and Vietnam in South East Asia.
global manufacturing downturn and One exception in our view is Japan
rising trade barriers, and the need for which we see as having a strong risk And yet crucially, a lot still depends
inclusive growth. of slumping into recession in 2020, and on the outcome of the US-China
that would be a good enough reason negotiations and 15 December (2019)
Even as most major economies have for Japan’s government to roll out a could be a key date. Our base case (at
downgraded their growth forecasts for substantial stimulus package and the 65%) is still for US and China to sign the
2020, macro developments could see BOJ to renew easing monetary policy Phase 1 trade deal by end-2019 or early
some stabilization on the horizon. And in 2020. 2020 with the US delaying or cancelling
we emphasize it is stabilization, not the the new additional tariffs scheduled on
REVISED SCENARIOS FOR US-CHINA TRADE
BEST CASE BASE CASE WORSE CASE
Significant de-escalation of US- US delays/cancels new additional US-China Phase 1 trade
China tensions. tariffs scheduled on 15 Dec 2019. agreement does not materialize
and the delayed/planned additional
US cancels new additional tariffs US and China signs Phase 1 trade tariffs are imposed.
scheduled on 15 Dec 2019. deal by end-2019 or early 2020,
but negotiations for Phase 2 deal The entire bilateral merchandise
US and China signs Phase 1 will be more protracted than in the trade comes under additional
trade deal by end-2019 and a Best Case scenario, going well tariffs.
Phase 2 agreement (which may beyond 2020.
include intellectual property, The tariff rates may be raised
forced technology transfer and High probability for Phase 2 further and trade conflict extends
state subsidies to industries) is negotiation to break down into other areas including services
concluded by end-2020 though intermittently during 2020 and new trade and investment restrictions
this may not remove most of the tariffs or enforcement measures etc.
existing additional tariffs. may be implemented.
5% 65% 30%
Probability Probability Probability
Source: UOB Global Economics & Markets Research
Quarterly Global Outlook 1Q 2020
6 EXECUTIVE SUMMARY
UOB Global Economics & Markets Research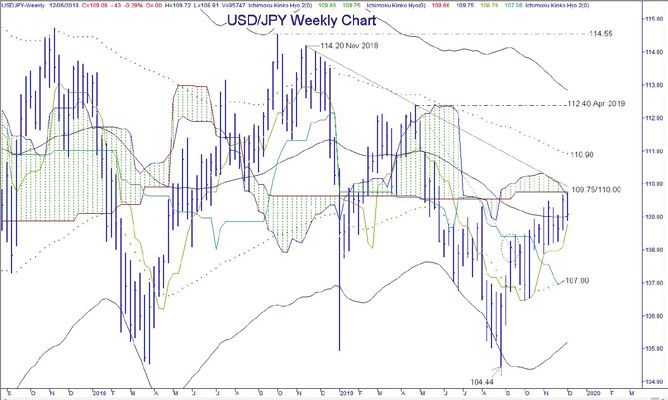
15 December. The next phase is likely to       gift from the former ECB President           Why is this important? Trump will be
be even more difficult as it covers areas      Draghi) remains in play but the new ECB      the first president running for re-election
where both US and China have little            President Lagarde may find it difficult to   under impeachment proceeding. We
common ground while the negotiations           get everyone in ECB governing council        assume that post-impeachment (which
will take place in a year when the US          to agree to more easing. Meanwhile,          Trump is either acquitted by the Senate
will be distracted by domestic issues          it is clear that China’s easing cycle has    or the Senate does not even take it up),
(Trump impeachment proceedings, US             started, although the pace of declines       US politics will be even more polarized
Presidential elections) for most of 2020.      seen in the MLF, 7D reverse repo rate        with Trump and the Republican party
If the US-China Phase 1 trade agreement        and the LPR fixings has been milder than     becoming even more entrenched against
does not materialize and the additional        anticipated, suggesting a measured and       the Democrats, while Trump could be
tariffs are imposed on 15 Dec, then that       cautious approach by People’s Bank           more emboldened to push the envelope
will be a risk-off catalyst for financial      of China (PBoC) to guide interest rates      and adopt an even more antagonistic
markets and the worsening of trade             lower. Across Asia, we expect the low        stance in the upcoming presidential
tensions will threaten to extinguish the       policy rate environment to continue in the   elections because he is convinced that
nascent macro stabilization. That is our       new year with moderate rate cuts from        his support base will not punish him.
worst case scenario at a sizeable 35%          Malaysia, Philippines and Indonesia.         There will be much political fireworks in
probability. Trump’s signing of the Hong                                                    the US for 2020.
Kong Human Rights and Democracy                What To Watch In 2020?
Act into law (27 Nov) and the US House         Besides the on-going US-China trade          Even before 2020 is upon us, the key
passing the Xinjiang Bill (3 Dec) deflated     tensions, US President Trump continues       election to watch will be the UK general
trade optimism while Trump’s comment (3        to burnish his “Tariff Man” credentials on   election on 12 Dec 2019 where a
Dec) that he may prefer waiting until after    other fronts: slapping steel and aluminum    decisive victory for Boris Johnson and
the US elections to sign a deal with China     tariffs back on Brazil and Argentina         the Conservative party could finally put
further clouds the timing of Phase 1.          for currency manipulation, threatening       the “hard exit” Brexit issue to rest, while
                                               to impose tariffs on French goods in         a Labour victory would prolong the Brexit
At the end of the day, the reality remains:    response to the proposed French Digital      drama (which feels like an eternity by now).
this is an ideological confrontation           Tax on US companies, and potentially         Besides the US and UK elections, there
between the two most important                 pursuing auto tariffs under Section 301 of   are several other elections that will matter
economies in the world, and it is not just     the 1974 Trade Act (the same mechanism       in 2020 including Taiwan (presidential
about trade. Trade is the starting point       used to impose tariffs on China). When       and legislative, 11 Jan), South Korea
but it is also about technology (and who       will Tariff Man rest?                        (legislative, 15 Apr), Iran (legislative, 20
controls it), military leadership, being                                                    Feb), Myanmar (tentatively in Nov) and
the top economy and these issues are           Perhaps he will take a break from tariffs    New Zealand (21 Nov). Singapore is also
not going to be resolved anytime soon          in 2020 as he deals with impeachment         expected to call for a general election in
(lasting for years if not decades), and it     proceedings against him while also           2020 although it is not due until 15 Apr
will become increasingly difficult for other   stepping up his campaign for the             2021.
countries “not to take sides”.                 Presidential election (03 Nov 2020). The
                                               Democrat-controlled House will certainly     2020 will be the Year of the Metal Rat
Major economies as well as Asian central       vote to pass the articles of impeachment     which is the first of the 12 Chinese zodiac
banks have responded to the weaker             against Trump. But the biggest stumbling     animals and metal is the first of the five
growth and uncertain trade environment         block is in the Republican-controlled        elements, which means the start of a new
by easing monetary policies in 2019.           Senate which may or may not take up          60-year cycle. According to Feng Shui,
And they are expected to either keep           the impeachment proceeding. Even if          the year is seen as strong, prosperous,
their easy monetary stance or ease             the Senate takes up the proceeding,          and lucky, and is a great year to begin
policy further to support growth in 2020.      the chances of Trump’s impeachment           new projects or improve ongoing ones.
After cutting rates trice consecutively in     is LOW unless Trump loses significant        Let’s hope it works for trade negotiations
Jul, Sep and Oct, the Federal Reserve          Republican support. If we use the Clinton    too.
(FED) is expected to stay on pause in          impeachment proceedings as a gauge
Dec 2019 but potentially another bout of       for the possible timeline (initiated on 8    We wish all our readers happy holidays
US-China trade uncertainty post-15 Dec         October 1998, the trial in the Senate        and a prosperous New Year ahead!
could trigger another 25 bps “insurance”       began in January 1999, and he was
rate cut from the FED in early 2020. The       acquitted on 12 February 1999), we
European Central Bank (ECB) may not            believe that the impeachment saga could
have to change policy for some time as         be over by 1Q 2020.
the latest stimulus package (a parting

                                                                                                   Quarterly Global Outlook 1Q 2020
  EXECUTIVE SUMMARY                                                                                                                   7
                                                                                            UOB Global Economics & Markets Research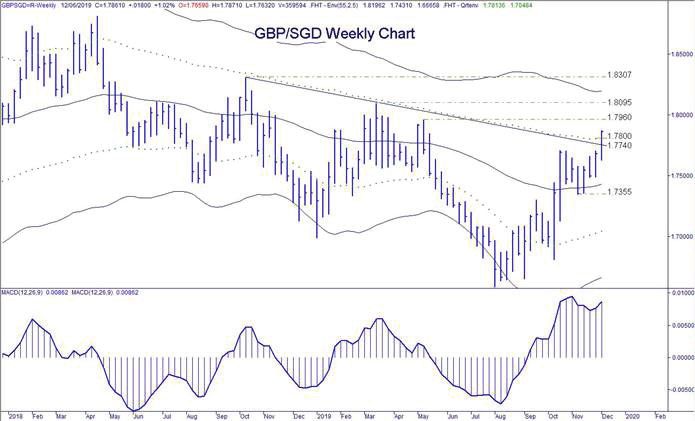
easing with deposit rate cut and bond         As unbelievable as it sounds, the
RATES STRATEGY                                  purchases.                                    demand-supply balance for copper has
Stay “Lower for Longer”                                                                       taken a decisive swing into deficit with the
Amidst lingering risks from “international      As for Asian currencies in 2020, we note      ICSG forecasting further supply deficit.
developments”, we continue to see a             that the correlation of Asian FX to CNY is    While global copper consumption growth
fourth 25 bps cut from the FED in 1Q2020,       now weaker as the financial markets are       remains weak, a significant amount of
lowering the target range of the Federal        now increasingly desensitized to the US-      mining stoppage, smelter production
Funds rate down to 1.25%-1.50%, from            China trade conflict headlines. While we      disruptions has led to an even larger loss
the current 1.50%-1.75% range. As such,         continue to expect a weaker CNY amidst        of production of refined copper. Overall,
short dated money market rates are              on-going slowdown in China, improved          we now see LME Copper continuing its
expected to drift lower across 1Q and           risk appetite globally and reducing tail      consolidation around USD 6,000 / MT,
then consolidate around the lower levels        risks may limit negative spillover to the     rather than further weakness to USD
across 2020. Overall, from their Dec 2019       rest of Asia FX. In other words, while the    5,000 / MT as previously forecasted.
levels we forecast 3M US Libor drifting         CNY’s structural weaknesses persist,
lower from 1.9% to 1.65%, 3M SGD Sibor          depreciation risks are contained at 7.20
easing from 1.80% to 1.55% and 3M               against the USD by end 2020.
SGD SOR marginally lower from 1.55%                                                           ASEAN FOCUS I
to 1.45%.                                       For the SGD, we continue to expect            Mega Trade Deal Is A Further Boost
                                                gradual SGD weakness. Amidst weak             To ASEAN’s Long-Term Potential
As for Singapore Government Securities          growth and soft inflation in Singapore, the   The Regional Comprehensive Economic
(SGS) bond market, we forecast that             S$NEER remains “relatively rich” at 1.6%      Partnership (RCEP) made a major
based on the anticipated 7% notional            above the estimated mid-point of the          stride forward in November 2019 after
growth rate, the SGS market size may            policy band. As external trade tensions       29 rounds of negotiations with its 15
finally exceed SGD 130 bn in 2020. And          remain, this S$NEER richness is likely        members (excluding India) committing to
with about 1/3 of the full year’s scheduled     to normalize across 2020, resulting in        sign the trade agreement in 2020. While
auction duration to be placed in Jan and        modest SGD weakness against the USD           India’s withdrawal is a setback, RCEP-15
Feb, this would support a slightly steeper      towards 1.39 by end 2020.                     still accounts for 29% of global GDP, 30%
SGS curve in 1Q20. Once again, rollover                                                       of world population and 28% of world
/ concentration risk in the SGS market is                                                     merchandise trade. In terms of global
low given the laddered maturity profile.                                                      GDP share, it is comparable to NAFTA
                                                COMMODITIES STRATEGY                          and EU 28 while being significantly larger
Finally, we keep track of the latest            Gold Cools Down As Brent Crude                in population size.
developments          and         regulatory    Oil And LME Copper Outlook
announcements regarding the intensifying        Improve                                       RCEP is expected to encourage further
transition from Interbank Offered Rates         Gold’s strong rally has cooled down as        development of trade on equal platform
(IBOR) to Risk Free Rates (RFR). As we          risk sentiment improved, global growth        for members and further building of supply
head into 2020, financial markets now           stabilized and yield curves resisting         chains throughout member countries.
have less than 24 months to prepare for         inversion. Nonetheless, with interest         This mega trade deal, which will vastly
the eventual transition. For various related    rates expected to stay soft for longer, we    facilitate trade in merchandise and
reports, do refer to our IBOR Transition        continue to maintain our positive outlook     services among the 15 signatories, could
landing page.                                   for gold, just that the pick-up is now seen   promote further economic integration and
                                                more modest. Overall, we now see gold         drive growth in GDP, trade and foreign
                                                modestly higher from USD 1,450 / oz           direct investment (FDI) in ASEAN over
                                                currently to USD 1,550 / oz by end 2020.      the medium to long term
FX STRATEGY
Recovery In Risk Appetite                       As for Brent crude oil, on-going OPEC+
To Weigh On The USD                             production cuts, coupled with various
Against FX Majors, we believe that the          supply outages have kept supply               ASEAN FOCUS II
USD may be in the process of peaking.           in check. Other tentative signs of            ASEAN-5: Has The Slowdown In
We see improving outlook for the EUR,           improvement include lower rig counts,         Growth And Trade Bottomed?
AUD, NZD and GBP in 2020, eventually            slower rate of shale oil production growth,   According to the IMF’s Oct WEO,
lowering the DXY from 98 as at end-Nov          firm backwardation in futures curve and       ASEAN-5 will likely see growth ease
to about 96 by end 2020. However, in            increased open interest. Amidst all these,    to 4.8% in 2019 (compared to a recent
contrast, instead of further JPY strength,      geopolitical risks continue to simmer in      peak of 6.9% in 2010) on the back of
we now expect the JPY to weaken going           the background for the Middle East. After     slowest export growth in four years.
forward beyond 110 to the USD. Japan’s          consolidating around USD 60 / bbl, we         Encouragingly, the slowdown in growth
steep retail sales slump risks triggering       believe Brent crude oil may be ready to       and trade could be bottom this year and
renewed recession. Hence, the BoJ is            trade modestly higher to USD 70 / bbl by      could see some improvement in 2020, in
seen stepping up its monetary policy            end 2020.                                     line with IMF’s outlook and estimates by
                                                                                              our in-house economists.

      Quarterly Global Outlook 1Q 2020
8                                                                                                                 EXECUTIVE SUMMARY
      UOB Global Economics & Markets Research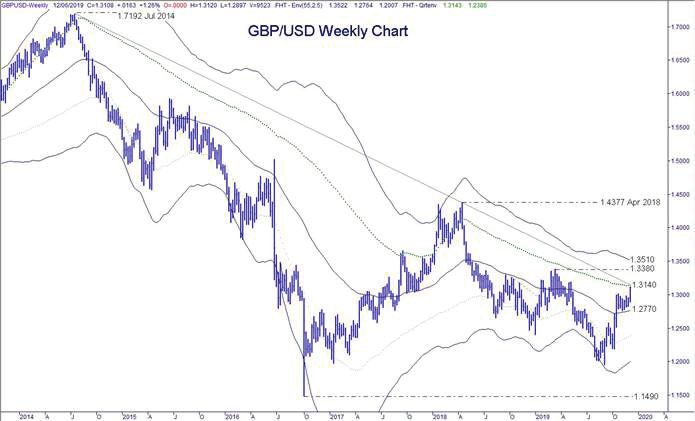
Recent     incoming     economic    data                                                     AUD/USD: After dropping for a second
from the ASEAN-5 region showed an             MALAYSIA FOCUS                                 straight year in 2019, the AUD is on firmer
improvement in economic fundamentals          Malaysia Budget 2020                           ground to stage a rebound next year if
and market confidence while the pace of       Key Takeaways                                  both domestic and external headwinds
declines in total trade that began since      With 2020 being the final year of the 11th     moderate further. Underpinned by a
mid-2018 seemed to have stabilised            Malaysia Plan, this budget is a crucial one    modest recovery in growth and inflation
in recent months. There are signs that        to ensure that gains made in previous          next year, a less aggressive RBA together
the manufacturing growth momentum             years are sustained amid significant           with an improved tone in US-China trade
has improved across most ASEAN-5              external headwinds. On that note, we           talks may keep the AUD/USD supported
economies except for Malaysia and the         are positive that the government has           at 0.69 in 1H20 before a modest recovery
Philippines as recent data weakened.          announced a fair budget that prioritises       towards 0.70 in 2H20.
                                              the economy without much slippage in
Barring further escalation in the US-China    the fiscal deficit. The budget delivers a      NZD/USD: Notwithstanding economic
trade tensions, a recovery of the global      balance of measures to revitalize growth       headwinds still persisting and the RBNZ
semiconductor cycle and improving trade       and investments, promote equality, create      staying dovish, there are clearly less
activities are key drivers to lift ASEAN-5    jobs, raise productivity, and improve          pressures on the NZD compared to our
growth in 2020, backed by improving           human capital.                                 previous quarterly update. As such, we
global economic fundamentals as well as                                                      are still of the view that NZD/USD would
the region’s rising prominence as a trade                                                    continue its modest recovery, towards
bloc.                                                                                        0.65 in 1H20 and 0.66 in 2H20.
                                              GLOBAL FX
                                              USD/JPY: Assuming that trade escalation
                                              risks stay low, together with global central
INDONESIA FOCUS                               banks leaning on their accommodative           ASIAN FX
Recap Of 2019 And Quick Take                  stance, it is likely the current bout of       USD/CNY: We have dialed back our
On 2020 Assets Market                         risk-taking and JPY weakness can still         bearish CNY expectations (previous peak
IDR FX: The Indonesian rupiah, IDR,           persist. Domestically, potential fiscal and    in USD/CNY forecast of 7.30 in 3Q20) in
proved to be less volatile in 2019 than       monetary stimuli in 2020 are also clear        recognition of the progress in trade talks
the year before despite going through an      negatives on the JPY. Taken together,          so far and the reduced risks of further
election year. Factors such as softer oil     we now expected further JPY weakness           trade escalation. Our updated forecasts
prices, a dovish Fed, inflows to the bond     going forth and our USD/JPY point              for USD/CNY are 7.08 in 1Q20, 7.10 in
market and government import tightening       forecasts are 110 in 1Q20, 112 in 2Q20         2Q20, 7.20 in 3Q20 and 7.20 in 4Q20.
measures helped offset concerns over          and 113 in 3Q and 4Q20.
the current account deficit. Higher                                                          USD/SGD: Overall, we maintain our
FX reserves and President Widodo’s            EUR/USD: Markets have looked beyond            modestly upward trajectory in USD/SGD
election win also worked positively for the   a dim Eurozone outlook and EUR/                but SGD weakness this time round would
currency.                                     USD has shown tentative signs that an          be limited to 1.39/ USD as the trough
                                              interim bottom has been in place at 1.09.      of the trade-induced slowdown may be
IDR Bonds: IDR bonds have enjoyed a           Together with a broad topping out of USD       behind us for now.
positive year in 2019 for several reasons     against most Majors, we maintain our
- S&P rating upgrade, resilient economy,      forecasts of EUR/USD stabilizing around        USD/HKD: It is likely that the Hong Kong
the Fed Reserve’s dovish pivot, investors’    1.11 in 1H20 followed by a mild rebound        Monetary Authority has what it takes to
hunt for yield amid negative bond yields      to 1.13 in 3Q20 then 1.15 in 4Q20.             defend the currency peg at 7.85. Overall,
in developed markets, benign domestic                                                        in the near term, geopolitical pressures
inflation and Bank Indonesia’s 100bps         GBP/USD: Even if the “fog of Brexit”           are likely to tether the HKD near the
rate cuts this year.                          lifts with a Brexit deal, markets still have   weaker end of its peg at 7.85 /USD in 1Q
                                              to face the economic consequences              and 2Q20 before a normalization towards
Quick Take For 2020: Bond market              from 3 years of political limbo since the      7.80/USD starting 3Q20.
inflows may taper off as we only project      referendum in 2016. UK growth was at
one more BI 25bps rate cut and a fiscal       an anemic 1.0% in 3Q19, the lowest in          USD/TWD: We maintain our mild
deficit target of 2.15% of GDP in 2020.       nine years and the Bank of England may         weakening bias for TWD going forth but
IDR’s relatively resilient performance        have to catch up with the global monetary      have recalibrated the point forecasts in
in 2019 has been predominantly                policy easing campaign. Overall we see         recognition of the pass through of positive
underpinned by massive inflows into the       limited upside in GBP/USD above 1.30 in        risk sentiment on TWD of late. Our
local bond market so the tapering of bond     2020, with our point forecasts at 1.31 in      updated point forecasts of USD/TWD in
inflows next year may see IDR trading         1H, followed by 1.32 in 2H.                    2020 are now 30.5 in 1Q, 30.8 in 2Q, and
weaker albeit in a stable fashion on the                                                     31.0 in both 3Q and 4Q.
back of an improving structural current
account deficit.

                                                                                                    Quarterly Global Outlook 1Q 2020
  EXECUTIVE SUMMARY                                                                                                                    9
                                                                                             UOB Global Economics & Markets Research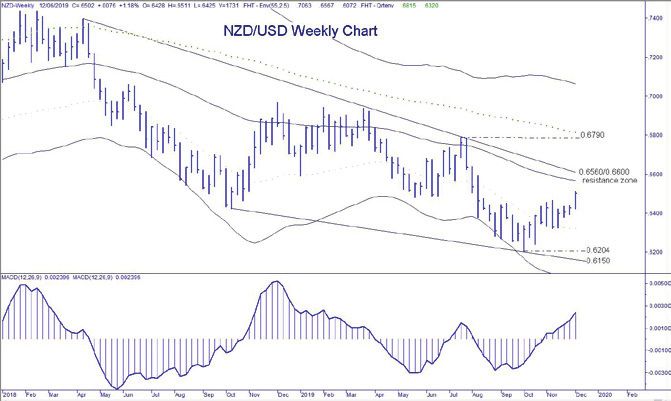
USD/KRW: Going forward, with downside           USD/VND: Compared to our previous              policy rate forecasts.
risks to external trade and domestic            forecasts, we have moderated the pace
growth receding, together with our less         of depreciation in view of the growth          RBA: It is indeed clear that the RBA
bearish recalibration of CNY, we now            momentum and inflows. Our latest USD/          appears to be in a holding pattern as it
foresee modest weakness of KRW going            VND point forecasts are 23,300 for 1Q20,       waits to gauge the effects of the rate cuts
forth. Our point forecasts for USD/KRW in       23,400 for 2Q20, and 23,500 for 3Q and         so far this year. We are thus maintaining
2020 are 1,200 in 1Q, 1,210 in 2Q, and          4Q20, versus previous estimates of a           our OCR call of 0.75%, for now. We are,
1,220 in both 3Q and 4Q.                        steeper trajectory towards 23,900 by end-      however, not ruling out further easing
                                                2020.                                          ahead. In fact, the case for a rate cut at the
USD/MYR: Even if external headwinds                                                            next RBA meeting on 4 February 2020,
were to ebb in the coming year, downside        USD/MMK: Next year, political uncertainty      will depend on housing, construction and
risks to domestic growth are likely to pin      may also cast an overhang on the MMK           economic data released over the next two
MYR weaker. Overall, we keep to the             as the election draws nearer. As such, we      months.
view of a modestly higher trajectory for        maintain a modestly higher trajectory in
USD/MYR, to 4.19 by 1Q20 then 4.22 by           USD/MMK with point forecasts at 1,510 in       RBNZ: The next RBNZ meeting is not
2Q20 before plateauing at 4.25 in 3Q20          1Q20, 1,530 in 2Q20, and 1,540 in 3Q20         until 12 February 2020. Our current
and 4Q20.                                       and 4Q20.                                      OCR forecast of 1.00% through 2020
                                                                                               remains intact. That said, we will remain
USD/IDR: Going forward, continued                                                              watchful of both developments at home
uncertainties on the US-China trade talks,                                                     and abroad. Should employment growth,
geopolitical risks, and China economic          GLOBAL INTEREST RATES                          business investment and household
slowdown may continue to tether the             FOMC: After three rate cuts, the Federal       spending weaken further, and/or the
IDR on the weaker end of 14,000 /USD.           Reserve (FED) signaled current policy          global economy deteriorates, we will not
Overall, we maintain a higher trajectory        stance (1.50-1.75% FED funds) is               be surprise to see the RBNZ venturing
in USD/IDR, towards 14,200 in 1Q20,             appropriate and its intention to put policy    into further interest rate cuts and the
14,300 in 2Q20, 14,400 in 3Q20 and              on pause. We subscribe to the view of          uncharted territory of unconventional
14,500 in 4Q20.                                 a Fed pause in Dec but another bout of         monetary policy.
                                                US-China trade tensions post-Dec FOMC
USD/INR: The intense headwinds INR              could trigger another 25bps “insurance”        BOJ: Continued forward guidance
faces look set to extend into 2020. Next        rate cut from Powell in 1Q 2020, and           without action will not be sufficient, and
year, risks to growth are still skewed          thereafter to stay on pause again for          with economic data turning south, the
to the downside and further rate cuts           2020. Conversely, if the trade negotiation     Bank of Japan (BOJ) will eventually
will continue to erode the interest-rate        progresses smoothly, then the “insurance”      need to act. The likelihood of substantial
advantage that the INR has over the             cut will be unnecessary.                       government fiscal stimulus package
USD, denting its attractiveness as a high                                                      reinforces expectations that BOJ will
yielder. In all, we maintain our negative       ECB: The service sector slowdown is in         be on hold in Dec (2019) but it will
bias for the INR, expecting weakness            turn impacting price growth, implying little   likely renew easing monetary policy via
towards 73.6 /USD by end-2020.                  upside in the coming months as far as          deepening its negative policy call rate to
                                                the inflation outlook is concerned. Thus,      -0.2% possibly in 1Q 2020 (from -0.1%).
USD/THB: The standout strength of the           we continue to anticipate rates to remain      Potentially, other measures will follow if
THB persisted even as the Thai economy          unchanged until end-2021. Lagarde may          the domestic economic situation worsens
slowed and authorities attempting to            not have to change policy for some time        in 2020.
throw sand into the wheel which included        as the latest stimulus package remains in
an unexpected rate cut in Aug and               play; but providing more stimulus further
measures to encourage capital outflows.         out could be complicated because so
Now with the pick-up in risk appetite, safe     much of the ECB’s balance sheet has            ASIAN INTEREST RATES
haven demand for the THB could plateau.         already been deployed.                         PBoC: Although we still expect PBoC to
As such, we see USD/THB in a stable                                                            guide rates lower, the elevated headline
range between 30.0 and 30.8 next year.          BOE: Despite the dovish tilt at the 7          inflation and slowing momentum in global
                                                November meeting, we see the BoE on a          central banks’ easing will keep it on a
USD/PHP: While investors’ longer term           wait-and-see stance. We believe that the       measured and cautious stance as focus
worries of Philippines’ twin deficits linger,   two dissenters against a large majority is     remains on improving monetary policy
expectations of sustained inflows of            still somewhat premature in tipping the        transmission through reforms and push
overseas remittances and foreign direct         balance for a rate cut, especially with a      for greater adoption of the Loan Prime
investments amid less aggressive BSP            no-deal Brexit scenario off the immediate      Rate (LPR). We expect future LPR fixings
rate cuts pared part of our negative            agenda. With offsetting factors currently,     to be moved by 5bps each month on
outlook on the PHP. Overall, though we          we would prefer to wait for the outcome        average into mid-2020, with no further
maintain a higher trajectory in USD/PHP,        of the impending election and the              cuts to MLF. This will see 1Y LPR at
the slope is reduced to 52.0 by 3Q20.           subsequent impact on how Brexit may            3.80% by mid-2020.
                                                proceed, before making changes to our

      Quarterly Global Outlook 1Q 2020
10                                                                                                                  EXECUTIVE SUMMARY
      UOB Global Economics & Markets Research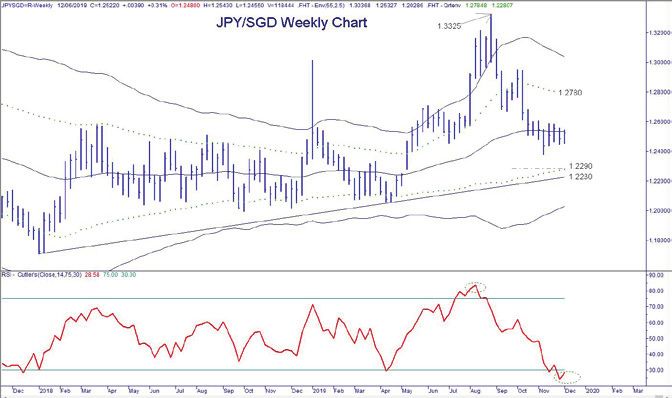
MAS: Given the potential recovery               BOK: Having cut interest rate twice since    BOT: For the next monetary policy
in Singapore’s growth into 2020, we             July 2019, BOK continued to signal room      meeting on 18 Dec 2019, the BOT will
continue to expect MAS to keep its              for further cuts but also said it remained   likely maintain the policy rate at 1.25%
monetary policy parameters unchanged            mindful of financial imbalances and is       to gauge the transmission mechanism of
at its April 2020 MPS meeting. This means       reviewing the short-term impact from         monetary policy and the easing of rules
keeping the slope, band and policy mid-         earlier rate cuts. We now expect the BOK     on capital outflows first before considering
point unchanged. Note that in October           to be on hold in 1Q20 with further easing    their next move. Barring any unexpected
2019, MAS reduced the appreciation of           being contingent on the deterioration in     negative shocks, we expect BOT to keep
the Singapore Dollar Nominal Effective          the economic outlook. Meanwhile, the         its benchmark rate unchanged at 1.25%
Exchange        Rate   (S$NEER)        slope    BOK has indicated that it is not prepared    in 2020.
“slightly”, which we estimate to be at 0.5%     to use monetary policy tools other than
currently.                                      interest rate yet.                           BSP: The moderate inflation provides
                                                                                             room for Bangko Sentral ng Pilipinas
RBI: RBI kept its benchmark rate                CBC: Despite low inflation, there has        (BSP) to ease its monetary policy further
unchanged at its 5 Dec meeting, leaving         been no change to CBC’s neutral stance       in early 2020 to sustain the growth
both repurchase rate and reverse                so far. We maintain our call for CBC to      momentum. We expect BSP to reduce the
repurchase rate at 5.15% and 4.90%,             keep its benchmark discount rate at          overnight reverse repurchase rate by a
respectively. The central bank cited that       1.375% through 2020. The benchmark           cumulative 50bps (25bps in each quarter)
there is still “monetary policy space for       rate is currently near the record low        to 3.50% by mid-2020. We also expect
future action”, and kept its accommodative      of 1.25% that was registered during          BSP to reduce the reserve requirement
stance “as long as it is necessary to revive    the Global Financial Crisis and current      ratio by an additional 100bps-200bps in
growth”. We opine that growth headwinds         economic conditions may not justify a        2020, depending on domestic liquidity
could still persist, and we expect the          benchmark rate at record low level yet.      conditions and credit growth.
central bank to cut its benchmark rate by
25bps at its 6 Feb 2020 meeting.                BNM: Given the slower trend growth           SBV: The State Bank of Vietnam (SBV)
                                                below Malaysia’s potential output of         made a surprise rate cut on 13 Sep (2019),
BI: Bank Indonesia (BI) has been                4.8%-5.0%, we have pencilled in a 25bps      lowering the policy refinancing rate to
promoting its pre-emptive, front-loaded,        cut in the Overnight Policy Rate to 2.75%    6.0%. However, with the unexpectedly
and ahead of the curve policy strategy          in 1Q20. This is to safeguard domestic       strong 3Q GDP report and expectations
since 2018. For 2019, BI shifted more           growth amid lingering trade uncertainties    that full year growth is likely to exceed
focus in supporting growth while                and muted investments. The central           official target while the policy rate at the
maintaining economic and financial              bank earlier cut the Statutory Reserve       lowest since end-2005, there are few
stability. With policy measures already in      Requirement ratio by 50bps to 3.00%          incentives for the central bank to take on
place to support growth, BI is likely to hold   on 16 Nov (2019) amid a moderation in        more aggressive posture. We expect the
its benchmark rate unchanged at 5.00%           domestic liquidity as broad money supply     SBV to stay on hold at least for the next
in Dec. Nevertheless, as we expect the          slowed and outflows in foreign portfolio     2-3 quarters.
FED to cut once more in 1Q 2020, we             funds persist.
keep our forecast of one more cut by BI
to 4.75% in 1Q 2020.

                                                                                                    Quarterly Global Outlook 1Q 2020
  EXECUTIVE SUMMARY                                                                                                                    11
                                                                                             UOB Global Economics & Markets Research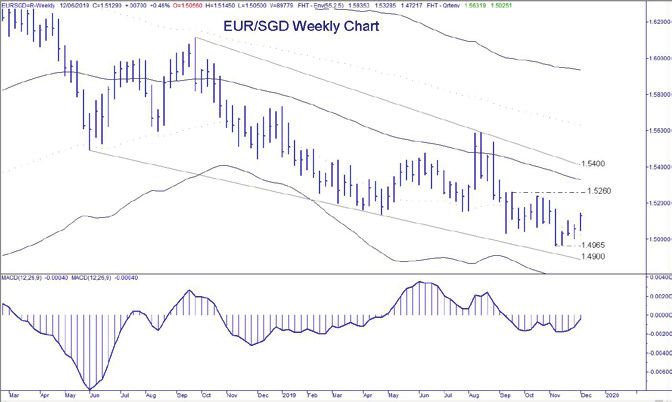
Real GDP Growth Trajectory

y/y% change                             2018          2019F       2020F        1Q19     2Q19     3Q19     4Q19F     1Q20F    2Q20F          3Q20F        4Q20F
China                                    6.6             6.1       5.9         6.4       6.2       6.0     6.0       5.9          5.9            5.9       6.0
Hong Kong                                3.0            -1.2       1.2         0.6       0.4      -2.9     -2.9      -1.7         -0.6           2.8       4.3
India                                    6.8             6.0       6.5         5.0       4.5       7.5     6.8       8.7          9.1            6.6       3.6
Indonesia                                5.2             5.1       5.2         5.1       5.1       5.0     5.1       5.1          5.2            5.2       5.2
Japan                                    0.8             0.7      -0.8         0.9       0.9       1.3     -0.2      -1.0         -1.2       -1.4          0.2
Malaysia                                 4.7             4.6       4.4         4.5       4.9       4.4     4.5       4.3          4.3            4.4       4.4
Philippines                              6.2             6.0       6.5         5.6       5.5       6.2     6.5       6.5          6.9            6.4       6.2
Singapore                                3.1             0.5       1.5         1.1       0.2       0.5     1.0       1.1          1.5            1.6       1.7
South Korea                              2.7             2.0       2.1         1.7       2.0       2.0     2.0       2.3          2.1            2.1       2.1
Taiwan                                   2.7             2.6       2.6         1.8       2.6       3.0     3.0       3.0          2.5            2.4       2.5
Thailand                                 4.1             2.6       3.1         2.8       2.3       2.4     2.8       2.0          2.9            4.3       3.2
Vietnam                                  7.1             7.0       6.8         6.9       6.8       7.3     7.1       7.0          6.9            6.7       6.6
Australia                                2.8             1.8       2.4         1.7       1.4       1.8     2.3       2.5          2.4            2.4       2.3
Eurozone                                 1.9             1.1       1.0         1.3       1.2       1.2     1.0       0.8          0.8            1.0       1.2
New Zealand                              2.8             2.3       2.4         2.9       2.6       2.1     1.9       2.0          2.2            2.5       2.6
United Kingdom                           1.4             1.2       1.1         2.1       1.3       1.0     0.7       0.6          1.1            1.1       1.4
United States (q/q SAAR)                 2.9             2.5       1.5         3.1       2.0       2.1     1.8       -0.4         2.3            2.4       2.0
Note that India’s annual growth refers to its fiscal year print
Source: CEIC, UOB Global Economics & Markets Research

Heat Map Of Key Macro Indicators In The Region

Macroeconomic Indicator
(Latest Data)
                                                      Indonesia     Malaysia     Philippines   Thailand   Vietnam     Singapore          China          India

Real GDP Growth (%)

Manufacturing PMI (Index)

Foreign Direct Investment (Annual, USD bn)

Merchandise Trade Balance (USD bn)

Current Account (Annual, % of GDP)

Fiscal Balance (Annual, % of GDP)

Unemployment Rate (%)

Inflation (%)

Color Code (Definition)                                Weakest                                                                                         Strongest

Source: Bloomberg, UOB Global Economics & Markets Research

        Quarterly Global Outlook 1Q 2020
12                                                                                                                                       EXECUTIVE SUMMARY
        UOB Global Economics & Markets Research
FORECASTS
FX, Interest Rate & Commodities
FX 05 Dec 19 1Q20F 2Q20F 3Q20F 4Q20F RATES 05 Dec 19 1Q20F 2Q20F 3Q20F 4Q20F
USD/JPY 109 110 112 113 113 US Fed Funds Rate 1.75 1.50 1.50 1.50 1.50
EUR/USD 1.11 1.11 1.11 1.13 1.15 USD 3M LIBOR 1.89 1.65 1.65 1.65 1.65
GBP/USD 1.31 1.31 1.31 1.32 1.32 US 10Y Treasuries Yield 1.77 1.80 1.80 1.90 1.90
JPY Policy Rate -0.10 -0.20 -0.20 -0.20 -0.20
AUD/USD 0.68 0.69 0.69 0.70 0.70
EUR Refinancing Rate 0.00 0.00 0.00 0.00 0.00
NZD/USD 0.65 0.65 0.65 0.66 0.66
GBP Repo Rate 0.75 0.75 0.75 0.75 0.75
DXY 97.6 97.7 97.8 96.7 95.6
AUD Official Cash Rate 0.75 0.75 0.75 0.75 0.75
USD/CNY 7.05 7.08 7.10 7.20 7.20 NZD Official Cash Rate 1.00 1.00 1.00 1.00 1.00
USD/HKD 7.83 7.85 7.85 7.80 7.80
CNY 1Y Loan Prime Rate 4.15 3.95 3.80 3.80 3.80
USD/TWD 30.49 30.50 30.80 31.00 31.00 HKD Base Rate 2.00 1.75 1.75 1.75 1.75
USD/KRW 1,189 1,200 1,210 1,220 1,220 TWD Official Discount Rate 1.38 1.38 1.38 1.38 1.38
USD/PHP 50.89 51.50 51.80 52.00 52.00 KRW Base Rate 1.25 1.25 1.25 1.25 1.25
PHP O/N Reverse Repo 4.00 3.75 3.50 3.50 3.50
USD/MYR 4.17 4.19 4.22 4.25 4.25
SGD 3M SIBOR 1.77 1.55 1.55 1.55 1.55
USD/IDR 14,094 14,200 14,300 14,400 14,500
SGD 3M SOR 1.52 1.45 1.45 1.45 1.45
USD/THB 30.29 30.00 30.50 30.80 30.80
SGD 10Y SGS 1.75 1.80 1.80 1.80 1.80
USD/MMK 1,503 1,510 1,530 1,540 1,540
MYR O/N Policy Rate 3.00 2.75 2.75 2.75 2.75
USD/VND 23,170 23,300 23,400 23,500 23,500
IDR 7D Reverse Repo 5.00 4.75 4.75 4.75 4.75
USD/INR 71.53 72.50 73.00 73.60 73.60
THB 1D Repo 1.25 1.25 1.25 1.25 1.25
USD/SGD 1.36 1.37 1.38 1.39 1.39 VND Refinancing Rate 6.00 6.00 6.00 6.00 6.00
EUR/SGD 1.51 1.52 1.53 1.57 1.60 INR Repo Rate 5.15 4.90 4.90 4.90 4.90
GBP/SGD 1.79 1.79 1.81 1.83 1.83
COMMODITIES 05 Dec 19 1Q20F 2Q20F 3Q20F 4Q20F
AUD/SGD 0.93 0.95 0.95 0.97 0.97
Gold (USD/oz) 1,476 1,480 1,500 1,550 1,550
SGD/MYR 3.06 3.06 3.06 3.06 3.06
Brent Crude Oil (USD/bbl) 63 63 65 68 70
SGD/CNY 5.17 5.17 5.15 5.18 5.18
JPY/SGDx100 1.25 1.25 1.23 1.23 1.23 LME Copper (USD/mt) 5,885 6,000 6,000 6,000 6,000
Quarterly Global Outlook 1Q 2020
FORECASTS 13
UOB Global Economics & Markets ResearchASEAN FOCUS I
Mega Trade Deal Is Further Boost To
ASEAN’s Long-Term Potential
The Regional Comprehensive RCEP was mooted in November RCEP is expected to encourage
Economic Partnership (RCEP) 2012 with the aim of broadening further development of trade on
made a major stride forward in and deepening ASEAN’s economic equal platform for members and
November 2019 after 29 rounds of engagements among its member further building of supply chains
negotiations with its 15 members states and the Asia-Pacific throughout member countries. This
(excluding India) committing member countries. mega trade deal, which will vastly
to sign the trade agreement in facilitate trade in merchandise and
2020. While India’s withdrawal is ASEAN as a bloc already has services among the 15 signatories,
a setback, RCEP-15 still accounts existing FTA arrangements with could promote further economic
for 29% of global GDP, 30% of each of the other RCEP member integration and drive growth in
world population and 28% of world countries including with India GDP, trade and foreign direct
merchandise trade. In terms of (Australia and New Zealand are investment (FDI) in ASEAN over
global GDP share, it is comparable covered under AANZFTA) though the medium to long term.
to NAFTA and EU 28 while being not all member countries have
significantly larger in population bilateral FTA with each other.
size. And as the largest member in the
bloc, China is already the largest
trading partner with most countries
in RCEP and also has existing
FTAs with ASEAN, Australia, New
Zealand and South Korea.
Quarterly Global Outlook 1Q 2020
14 ASEAN FOCUS I
UOB Global Economics & Markets ResearchOriginal RCEP Members Account For Nearly 60% Of ASEAN’s Total Trade (2018)
40.3% 23.0%
Others Intra-ASEAN
2.9%
India
17.2%
China
0.4% 8.2%
New Zealand
Japan
2.3% 5.7%
Australia
South Korea
Source: CEIC, UOB Global Economics and Markets Research
Comparison Of Economic Groupings And Trade Blocs
Trade Blocs Economic Groups
Indicators (2018)
RCEP-16 RCEP-15 NAFTA CPTPP APEC EU-28 ASEAN
No. of Economies
Population (bn)
Nominal GDP (USD tn)
% Share of Global Population
% of Global GDP
% Share of Global Trade
Ranking Strongest Weakest Strongest Weakest
Source: Macrobond, WTO, UOB Global Economics & Markets Research
APEC’s 21 Member Economies are the US, Australia, Brunei Darussalam, Canada, Chile, China, Hong Kong SAR, Indonesia, Japan, Malaysia,
Mexico, New Zealand, Papua New Guinea, Peru, The Philippines, Russia, Singapore, South Korea, Taiwan, Thailand, and Vietnam.
RCEP-16 includes ASEAN countries, China, Japan, South Korea, Australia, New Zealand and India while RCEP-15 excludes India.
The US – Mexico – Canada Agreement (USMCA) was signed on Nov 30, 2018 and aims to replace the North-American FTA (NAFTA).
The Comprehensive and Progressive Agreement for Trans-Pacific Partnership (“CPTPP”) is an FTA between 11 countries: Australia,
Brunei Darussalam, Canada, Chile, Japan, Malaysia, Mexico, New Zealand, Peru, Singapore and Vietnam. These are also APEC members.
Existing Trade Deals Amongst RCEP-16 Countries
- ASEAN Australia China India Japan New Zealand South Korea
ASEAN YES (1)
YES YES YES YES (1)
YES
Australia YES(1) YES NO YES YES YES
China YES YES NO NO YES YES
India YES NO NO YES NO YES
Japan YES YES NO YES NO (2)
NO
New Zealand YES (1)
YES YES NO NO (2)
YES
South Korea YES YES YES YES NO YES
Source: CNBC, UOB Global Economics & Markets Research
1. ASEAN-Australia-New Zealand FTA (AANZFTA)
2. While New Zealand and Japan do not have an FTA, they are both CPTPP members.
Quarterly Global Outlook 1Q 2020
ASEAN FOCUS I 15
UOB Global Economics & Markets ResearchASEAN’s Immense Long-Term Potential
Population Gross Domestic Product (GDP)
Million Persons USD Trillion
Third largest Fifth largest
globally, after China economic bloc globally
and India in 2018 after US, Euro
726 Area, China and Japan
654 6.6
Young 581
demographics, GDP doubled, over 3.0
with 381 million below
1.5
the last decade
2008 2018 2030 2008 2018 2030
35 years old (58% of
ASEAN’s population)
Total Merchandise Trade Foreign Direct Investment (FDI)
USD Trillion USD Billion
Fourth largest Largest recipient
trader globally, after US, of inward FDI globally
China and Germany after US, EU and China
+ Hong Kong SAR
Has extensive
4.5 328
FTAs with its trading Grown 3 times,
partners 1.9 2.8 over the last decade 156
51
Accounts for 7.4% of 2008 2018 2030 2008 2018 2030
global trade
Note: 2030 forecasts for trade and FDI assume annual growth at half the growth pace in the last 20 years
Source: Macrobond, UOB Global Economics and Markets Research
Quarterly Global Outlook 1Q 2020
16 ASEAN FOCUS I
UOB Global Economics & Markets ResearchASEAN FOCUS II
ASEAN-5: Has The Slowdown
In Growth And Trade Bottomed?
According to the IMF’s Oct WEO, Recent incoming economic data Barring further escalation in the US-
ASEAN-5 will likely see growth from the ASEAN-5 region showed China trade tensions, a recovery of
ease to 4.8% in 2019 (compared to an improvement in economic the global semiconductor cycle and
a recent peak of 6.9% in 2010) on fundamentals and market improving trade activities are key
the back of slowest export growth confidence while the pace of drivers to lift ASEAN-5 growth in
in four years. Encouragingly, the declines in total trade that began 2020, backed by improving global
slowdown in growth and trade since mid-2018 seemed to have economic fundamentals as well as
could be bottom this year and stabilised in recent months. There the region’s rising prominence as
could see some improvement in are signs that the manufacturing a trade bloc.
2020, in line with IMF’s outlook growth momentum has improved
and estimates by our in-house across most ASEAN-5 economies
economists. except for Malaysia and the
Philippines as recent data
weakened.
Quarterly Global Outlook 1Q 2020
ASEAN FOCUS II 17
UOB Global Economics & Markets ResearchThe economic slowdown in ASEAN-51 has stemmed chiefly That said, there are caveats to the positive outlook for the region,
from the lacklustre external environment, given the region’s in particular for the manufacturing sector. Growth of manufacturing
dependence on trade. From its recent peak of 6.9% in 2010, the activities in Malaysia slowed below 4.0% in 3Q19, mainly due to
International Monetary Fund (IMF) has pencilled ASEAN-5 GDP weaker export-oriented clusters. Malaysia’s capacity utilisation
growth to slow to 4.8% in 2019 (Oct 2019 WEO). This is seen rates have also been falling from 81% in 1Q19 to 72% in 3Q19,
in tandem with declining export growth which is estimated to fall suggesting headwinds against the manufacturing cluster in the
to 2.7% in 2019, the slowest in four years. Encouragingly, the foreseeable future. In the Philippines, manufacturing growth
slowdown in growth and trade could be bottoming in 2019 and also slowed to an 8-year low of 2.4% y/y in 3Q19, down from a
could see some improvement next year, as estimated by our typical 7.0% growth handle. For the ASEAN-5 region as a whole,
in-house economists. This is also in line with the outlook from a turnaround from the lacklustre trade environment and a revival
the IMF which expects GDP and exports growth to strengthen in the global semiconductor cycle will be prerequisites for a
to 4.9% and 5.9% respectively in 2020 for the ASEAN-5 region. sustainable growth recovery in 2020.
Please see Table 1 for our in-house outlook for economic growth,
inflation and trade for 2019-2021. In a nutshell, there are signs that the manufacturing growth
momentum has improved across most ASEAN-5 economies,
Recent incoming economic data from the ASEAN-5 region except for Malaysia and the Philippines due to their relatively
underlines an improvement in economic fundamentals and market weaker incoming economic data seen of late. Meanwhile,
confidence. The pace of declines in total trade that began since labour conditions in the region remain resilient. Barring further
mid-2018 has stabilised in recent months. Manufacturing growth escalation in the US-China trade tensions, a recovery of the
momentum especially in Indonesia and Malaysia remained positive global semiconductor cycle and improving trade activities are key
albeit some moderation, while Singapore’s industrial production drivers to lift ASEAN-5 growth in 2020, backed by improving global
surprised the market with positive growth prints in September economic fundamentals as well as the region’s rising prominence
and October 2019. Consumer confidence levels in ASEAN-5 are as a trade bloc.
also slowly turning more positive. Optimistic consumers continue
to outweigh the pessimists in Indonesia (122) and Malaysia
(110) in the latest quarterly survey, while Philippines’ consumer
Table 1:
confidence rose to +4.6% in the three months to September 2019,
UOB Projections For GDP Growth, Inflation & Merchandise Trade
the largest quarter-on-quarter increase since 4Q17.
Indicator 2018 2019F 2020F 2021F
The nascent improvements in economic indicators have also led
to stronger risk-taking appetite. Market indicators have painted a Singapore
more positive backdrop as equity benchmarks in the ASEAN-5 GDP Growth (%) 3.1 0.5 1.5 2.0
economies edged higher on a year-to-date basis. In particular, Inflation (%) 0.4 0.6 1.2 1.5
the Singapore Strait Times Index led the pack with a 4.1% gain in
Exports (%) 7.9 -4.0 -2.0 2.0
the first eleven months of 2019 (11M19), followed by Philippines
Stock Exchange Index (+3.7%) and Stock Exchange of Thailand Imports (%) 10.7 -2.2 -2.0 1.0
(+1.7%). The Jakarta Composite Index saw a 2.6% gain in the Indonesia
first half of 2019, before declining by an accumulative 2.9% in GDP Growth (%) 5.2 5.1 5.2 5.4
11M19. Inflation (%) 3.2 3.1 3.6 3.6
Exports (%) 6.7 -7.5 3.5 6.0
Overall, we remain cautiously optimistic on the Indonesian
Imports (%) 20.2 -10.0 4.2 7.0
economy after manufacturing growth rebounded to 4.2% y/y in
3Q19 and is expected to accelerate further in 2020. The potential Malaysia
pickup in domestic demand into the next year would also augur GDP Growth (%) 4.7 4.6 4.4 4.6
well for the general economic outlook. In Thailand, we recognise Inflation (%) 1.0 0.8 2.5 2.8
several factors that could accelerate domestic growth momentum Exports (%) 7.3 -1.0 2.0 2.5
into 2020, which includes its current accommodative monetary
Imports (%) 5.2 -2.5 2.5 3.0
policy, ongoing public sector projects, and government-driven
policies especially in the transport and logistics infrastructure Philippines
projects in the Eastern Economic Corridor (EEC). Last-but-not- GDP Growth (%) 6.2 6.0 6.5 6.7
least, the recent improvement in Singapore’s manufacturing Inflation (%) 5.2 2.5 3.0 3.0
PMI and industrial production environment has benefited trade Exports (%) 0.9 0.2 1.5 2.0
and employment indicators, which will likely lead to an improved
Imports (%) 17.4 -4.0 2.5 3.0
growth outlook in 2020. Barring further escalation in US-China
trade tensions, ASEAN-5’s external environment will also benefit Thailand
from deepening trade partnerships and initiatives such as the GDP Growth (%) 4.1 2.6 3.1 3.6
Regional Comprehensive Economic Partnership (RCEP) that Inflation (%) 1.1 0.7 1.0 1.5
was concluded on 4 November 2019. These initiatives will drive
Exports (%) 6.9 -2.0 1.5 2.5
ASEAN’s increasing prominence and role in global growth and
Imports (%) 12.0 -4.6 1.3 2.0
trade, as well as its ability to stay relatively cushioned from global
Source: Macrobond, UOB Global Economics & Markets Research
economic shocks.
1 ASEAN-5 consists of Indonesia, Malaysia, Singapore, Philippines and Thailand
Quarterly Global Outlook 1Q 2020
18 ASEAN FOCUS II
UOB Global Economics & Markets ResearchTrade Momentum Is Expected To Improve
ASEAN-5 Growth Versus Other Regions
And Grow Faster Than G7 And DM/EM Economies
Source: Macrobond, UOB Global Economic Economics & Markets Research Source: Macrobond, UOB Global Economic Economics & Markets Research
ASEAN-5’s GDP As % Of World ASEAN Intra-regional Trade (% of Total Trade)
Has Risen Over the Last Three Decades Has Increased Progressively
Source: Macrobond, UOB Global Economic Economics & Markets Research Source: Macrobond, UOB Global Economic Economics & Markets Research
Gross Govt Debt % GDP: ASEAN-5
ASEAN Total FDI Inflows (BOP Basis), quarterly
Remains Fiscally Prudent Vs Other Regions
Source: Macrobond, UOB Global Economic Economics & Markets Research Source: Macrobond, UOB Global Economic Economics & Markets Research
Quarterly Global Outlook 1Q 2020
ASEAN FOCUS II 19
UOB Global Economics & Markets ResearchConsumer Confidence In ASEAN-5 Equity Indices Have Improved For STI, PSE And SET
Source: Macrobond, UOB Global Economic Economics & Markets Research Source: Macrobond, UOB Global Economic Economics & Markets Research
Contraction In Total Trade Has Stabilised 2019 YTD Manufacturing Momentum In ASEAN-5 Has Improved
Source: Macrobond, UOB Global Economic Economics & Markets Research Source: Macrobond, UOB Global Economic Economics & Markets Research
Unemployment Levels Are Stable Despite The Slowdown
Source: Macrobond, UOB Global Economic Economics & Markets Research
Quarterly Global Outlook 1Q 2020
20 ASEAN FOCUS II
UOB Global Economics & Markets ResearchINDONESIA FOCUS
Recap Of 2019 And
Quick Take On 2020 Assets Market
IDR FX IDR Bonds Quick Take For 2020
The Indonesian rupiah, IDR, IDR bonds have enjoyed a positive Bond market inflows may taper off
proved to be less volatile in 2019 year in 2019 for several reasons as we only project one more BI
than the year before despite going - S&P rating upgrade, resilient 25bps rate cut and a fiscal deficit
through an election year. Factors economy, the Fed Reserve’s dovish target of 2.15% of GDP in 2020
such as softer oil prices, a dovish pivot, investors’ hunt for yield amid (Government target at 1.76% of
Fed, inflows to the bond market negative bond yields in developed GDP). IDR’s relatively resilient
and government import tightening markets, benign domestic inflation performance in 2019 has been
measures helped offset concerns and Bank Indonesia’s 100bps rate predominantly underpinned by
over the current account deficit. cuts this year. massive inflows into the local bond
Higher FX reserves and President market so the tapering of bond
Widodo’s election win also worked inflows next year may see IDR
positively for the currency. trading weaker albeit in a stable
fashion on the back of an improving
structural current account deficit.
Quarterly Global Outlook 1Q 2020
INDONESIA FOCUS 21
UOB Global Economics & Markets ResearchThe Rupiah
Year-to-date (YTD) IDR performance (as at mid-November) government import tightening measures offset concerns about
proved to be less volatile than last year despite going through an Indonesia’s persistent current account deficit (CAD). Foreign
election year in 2019. IDR averaged IDR14,156 YTD as compared exchange reserves also climbed to USD126.7bn in October
to FY2018 average at IDR14,235. IDR even strengthened passed 2019, a 20-month high. The incumbent President Joko Widodo
the IDR14,000 mark at 13,919 on July 2019, post-election and winning a second term in office also played its role in maintaining
dividend payment cycle on 2Q 2019. Softer oil prices (as Indonesia the portfolio and direct investment inflow, leading to a balance of
is net oil importer), a dovish Fed, inflows to the bond market and payment (BoP) surplus.
USD-IDR Spot Price USD-IDR & FX Reserve
Source: Bloomberg, UOB Global Economic Economics & Markets Research Source: Bloomberg, UOB Global Economic Economics & Markets Research
15,500 16,500 150.00
USD bn
15,000 15,500
130.00
14,500 14,500
14,000 13,500 110.00
Average:
13,500 2014 Average (YTD) 12,500
2019 90.00
13,000 USD/IDR Average:
11,500
11,865 2018 USD/IDR
12,500 Average: 14,156
Average: Average: 2017 USD/IDR
10,500 70.00
12,000 2015 2016 14,235
USD/IDR 9,500
USD/IDR USD/IDR 13,383 50.00
11,500
13,389 13,305 8,500
11,000
7,500 30.00
10,500 Oct-06 Sep-08 Jul-10 May-12 Mar-14 Feb-16 Dec-17 Oct-19
2014 2015 2016 2017 2018 2019 USD-IDR (LHS) FX Reserves
The Sovereign Bonds
2019 has been a positive year for IDR bonds for several reasons. was well below the mid-point of the central bank’s official target
First, Standard and Poor’s (S&P) raised Indonesia’s long-term range of 2.5% to 4.5%. And fifth, the benign inflation and healthy
sovereign credit rating to BBB from BBB-, as announced on 31 BoP conditions has also allowed Bank Indonesia (BI) to reduce
May 2019. The key factors supporting their decision were strong the benchmark rate 4 times in row through July – October 2019
growth prospects over the coming years, stable policy, as well as by 100 bps; reversing some of the series of rate hikes totalling
prudent fiscal settings. S&P also emphasised that President Joko 175bps that they put in place in 2018.
Widodo’s strong performance in the elections will lead to policy
continuity over the next five years. At the same time, Indonesia’s These factors have bought foreign inflows into the domestic IDR
economy is growing faster than that of its peers at the same bond market which cumulated to USD12.2bn YTD in November;
income level; reflected from real GDP per capita growth at an this was significantly higher than FY2018’s figure of USD3.5bn
impressive 4.1%, on a 10-year weighted-average basis compared and also exceeded the record of USD12.1bn set in 2017.
to 2.2% across global sovereigns. Second, the Federal Reserves’ Throughout 2019, foreign holdings in government bonds steadily
dovish pivot in mid-2019 created a tailwind which was supportive increased from 37.2% to 39.4% (compared to 39.0% in November
of the bond market since this meant that the US rate hike cycle 2018). 10Y IDR bond yield has dropped by 100bps from 8.03%
had effectively ended. Third, lower or even negative bond yields in in early January to 7.03% in mid-November, touching a low of
Developed Market (DM) pushed Emerging Market (EM) bond rally 6.95% early in November along the way. From January – October
due to more attractive interest rate differentials and largely benign the government has successfully issued IDR401.7tn (approx.
credit conditions in EM Asia. Fourth, inflation in Indonesia was USD28bn) bonds or 103.3% of its issuance target.
mostly benign, averaging only 3.1% from January – October. This
Quarterly Global Outlook 1Q 2020
22 INDONESIA FOCUS
UOB Global Economics & Markets ResearchUS-ID Yield Spread vs. BI 7D-RR Bond Flow
Source: Bloomberg, UOB Global Economic Economics & Markets Research Source: Bloomberg, UOB Global Economic Economics & Markets Research
bps % 13.0
USDbn
2,000 9.0
11.0
8.0
1,600 7.0 9.0
6.0 7.0
1,200
5.0
5.0
4.0
800
3.0 3.0
400 2.0 1.0
1.0
-1.0
0 0.0 Jan Feb Mar Apr May Jun Jul Aug Sep Oct Nov Dec
Nov-07 Nov-09 Nov-11 Nov-13 Nov-15 Nov-17 Nov-19
2012 2013 2014 2015
US-ID Yield Spread Benchmark Rate (RHS) 2016 2017 2018 2019
Foreign Holding 10Y Gov Yield
Source: Bloomberg, UOB Global Economic Economics & Markets Research Source: Bloomberg, UOB Global Economic Economics & Markets Research
42.0 9.5
%
Trump won US
Brexit
Fitch upgrade
S&P upgrade
BI +175bps
BI -100bps
Moody's upgrade
41.0 9.0 Election
8.5
40.0
8.0
39.0
7.5
38.0 7.0
6.5
37.0
6.0
36.0 Jan-16 Aug-16 Apr-17 Nov-17 Jul-18 Feb-19 Oct-19
2015 2016 2017 2018 2019 IDR Gov 10Y
Quick Take For 2020
Continued uncertainty on the US-China trade tension, geopolitical pickup vis a vis negative yielding assets. Going forward, IDR may
risks, and Chinese economic slowdown may continue to weigh continue to trade weaker in 2020 albeit in a stable fashion on the
down on Indonesia’s external sector. We forecast for only one final back of an improving structural current account deficit, which we
25bps rate cut by BI in Q1 2020, coupled with our fiscal deficit forecast to narrow further to around 2.6 percent of GDP in 2020
target (2.15% of GDP in 2020 from 2.25 percent in 2019), we versus 2.8 percent this year. In general, for 2020 we expect to
project bond market inflows may taper off next year although if the see government fiscal expenditure focusing on the infrastructure,
market capitalization of negative yielding bonds globally continues healthcare, and education as key sectors. Given expansionary
to grow, this may still render some support for Indonesian fiscal policies and also some injection into social assistance, the
bonds. IDR’s relatively resilient performance in 2019 has been consumer sector may also benefit next year. We forecast for a
predominantly underpinned by; massive inflows into the local slightly stronger GDP growth of 5.2 percent in 2020 vs. 2019’s
bond market, BI cutting policy rate by 100bps to 5.0 percent, a 5.1 percent.
S&P rating upgrade, low and stable inflation, as well as good yield
Quarterly Global Outlook 1Q 2020
INDONESIA FOCUS 23
UOB Global Economics & Markets ResearchYou can also read