Quarterly Global Outlook 2Q 2021 - From Reflation Bliss To Inflation Woes - UOB Group
←
→
Page content transcription
If your browser does not render page correctly, please read the page content below

Quarterly Global Outlook 2Q 2021
From Reflation Bliss To Inflation Woes

Content

     03      Executive Summary                 43      China
             From Reflation Bliss
             To Inflation Woes                 44      Hong Kong

                                               45      India
     09      Central Bank Outlook
                                               46      Indonesia
     12      Key Events In 2Q
                                               47      Japan
     13      FX, Interest Rate &               48      Malaysia
             Commodities Forecasts
                                               49      Philippines

                                               50      Singapore
     14      Inflation Focus
             Are We In For An                  51      South Korea
             Inflation Surprise?
                                               52      Taiwan
     23      Indonesia Focus                   53      Thailand
             Subdued Inflation Is Likely To
             Stay On Amidst Sluggish Demand    54      Vietnam

     27      Singapore MAS Preview             55      Australia
             Policy-Making In The              56      Eurozone
             Face Of Inflation
                                               57      New Zealand

                                               58      United Kingdom
     31      FX Strategy
             USD Finds Temporary Support       59      United States of America
             From Higher Yields But
             Downtrend Likely Intact
                                               60      FX Technicals
     37      Rates Strategy
             Yield In Motion Stays In Motion   66      Commodities Technicals

     39      Commodities Strategy
             Gold Gets Left Out Of
             The Synchronized
             Global Commodities Rally

                                               Information as of 19 March 2021

                                               Scan the QR Code for
                                               a list of all our reports

                                               Email: GlobalEcoMktResearch@UOBgroup.com
                                               URL: www.uob.com.sg/research
                                               Bloomberg: UOBR

    Quarterly Global Outlook 2Q 2021
2
    UOB Global Economics & Markets Research
Executive   From Reflation Bliss To Inflation Woes
         Summary
                     “Inflation is always and everywhere a monetary phenomenon”

                     Milton Friedman

                     More than one year has passed since the onset of the Coronavirus (COVID-19) pandemic that
                     plunged the world economy into the deepest recession post World War II. From global despair,
                     sentiment turned into cautious optimism in second half of 2020 on hopes of discovering a workable
                     vaccine against COVID-19. That initial guarded optimism quickly blossomed as more vaccines
                     became approved for use in more jurisdictions, and within months, the total number of administered
                     vaccine doses has now exceeded the total number infection cases globally (as of early Feb 2021).
                     And although the number of fully vaccinated persons is still lower than the total number of infected
                     persons, the gap is narrowing quickly and should turn in favour of number of inoculated persons
                     fairly soon, especially with the approval of more vaccines for emergency use.

                      COVID-19: Total Infected Cases And Cumulative Number of Vaccines Administered

                      Source: Macrobond, UOB Global Economics & Markets Research

                      COVID-19: Total Infected Cases And Number of People Fully Vaccinated

                      Source: Macrobond, UOB Global Economics & Markets Research

                                                                                          Quarterly Global Outlook 2Q 2021
EXECUTIVE SUMMARY                                                                                                            3
                                                                                   UOB Global Economics & Markets Research
The longer term               The war on COVID-19 is not over yet, with resurgence of the pandemic and the repeat of some
         prognosis is still            social restrictions to contain the spread (such as in parts of Europe) as well as the concerns that new
      positive to achieve              variants of the virus may be more transmissible, deadly and immune against the available vaccines,
     an acceptable level
       of protection/herd              while news of supply bottlenecks and safety concerns about certain vaccines have also temporarily
        immunity against               hampered the pace of rollout in some countries. Notwithstanding these issues, the longer term
              COVID-19.                prognosis is still positive as long as we keep the discipline and stay the course on the vaccine rollout
                                       to achieve an acceptable level of protection/herd immunity against COVID-19.

                                       While the COVID-19 vaccine development is the most important and enduring factor to bring the
                                       economy back to some level of normalcy, the other important factors that have helped sustain the
                                       global economy during the wait for a workable vaccine was the combination of expansive fiscal
                                       stimulus (to the tune of at least US$10 trillion globally) and ultra-accommodative monetary policies.

                                       As a result of the “life-sustaining” stimulus and the life-saving vaccine, the global economic recovery
                                       is now expected to go from strength to strength as reflected by the forecasts upgrades by the
                                       International Monetary Fund (IMF: 5.5% in Jan 2021 WEO, from previous projection of 5.2%) and
                                       more recently, by the Organisation for Economic Co-operation and Development (OECD: 5.6% in
                                       Mar 2021, from previous projection of 4.6%).

                                       Leading and supporting the growth charge are the world’s two biggest economies, the US and
                                       China. The Federal Reserve is now projecting US real GDP growth to top 6.5% in 2021, its strongest
                                       annual expansion in 40 years since the 1980’s and will support global activity over time. Meanwhile,
                                       China’s surging monthly data suggest that its 1Q 2021 GDP expansion may well be in the strong
                                       teens, and we have conservatively penciled full year growth at 8.5% in 2021.

                                       That said, growth recovery is likely to be uneven elsewhere, like Eurozone and Japan, which are
                                       hampered by COVID-19 resurgence and vaccine availability. And among the industries, the K-shaped
                                       recovery dilemma remains relevant as manufacturing activity continues its revival, e-commerce
                                       activity is thriving but in-person, travel and tourism related sectors will stay under pressure for most
                                       of this year.

              Enter The                A consequence of the stimulus/vaccine super-charged outlook is that there are increasing concerns
               Inflation               about higher inflation, especially for the US, brought about by the expansive fiscal stimulus and
               Dragon?                 ultra-accommodative monetary policies.

                                       Even though US inflation prints remained benign, they are lagging indicators and the crux is
                                       expectations of higher inflation have been building up. The combination of vaccine-driven reflation
                                       expectations, US “going big” on fiscal stimulus, and inflation fears that could lead to earlier than
                                       expected monetary policy tightening, has led US Treasury yields spiking higher in 1Q (2021). The
                                       10-year UST yield breached 1.7% (on 18 Mar), less than 24 hours after FOMC Chair Powell had
                                       reassured markets that the Fed is willing to look past transient inflation impact and the Fed will not
                                       react pre-emptively to hike rates and it will supply clear communication well in advance of any bond-
                                       buying taper.

     We believe that US                We believe that US inflation worries and the rise in US bond yields will continue to be the hot potato
   inflation worries and               topics for the financial market for the rest of this year, with spillover consequences to other asset
     the rise in US bond               classes and markets. Financial markets will continue to push ahead with their concerns of rising
  yields will continue to
   be the hot topics for               inflation and challenge the FED’s on-going dovish outlook of strong growth with transient inflation.
the financial market for
    the rest of this year.             Specifically, in light of the stronger growth expectations and much quicker pace of US vaccination,
                                       we now upgrade our 2021 US growth and inflation forecast to 6.3% and 2.4% respectively.
                                       Consequently, we also raise our year-end 10-year US Treasury yield forecast to 2%.

       Another issue that              Another issue that markets will grapple with in the upcoming quarter will be the familiar topic of
    markets will grapple               US-China relations. We do not expect any significant progress or a reset of relations between the
    with in the upcoming               two major powerhouses, but an extended period of status quo will be helpful to prevent further
       quarter will be the
     familiar topic of US-             deterioration to market conditions as the world economy attempts to emerge from COVID-19’s
          China relations.             shadows with an inoculation approach.

       Quarterly Global Outlook 2Q 2021
4                                                                                                                         EXECUTIVE SUMMARY
       UOB Global Economics & Markets Research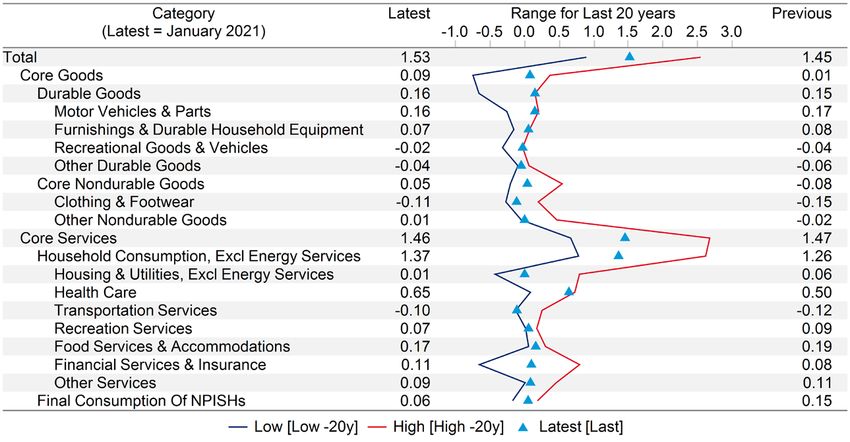
FX Strategy             While higher yields have spurred a rebound in the USD, it is premature to extrapolate further
        USD Finds             sustained USD gains beyond 2Q21. The recent strong rise in US bond yields will eventually taper
 Temporary Support            at around 2% (for 10-year yield), hence the positive feedback of higher yields to higher USD may
 From Higher Yields           start to falter. Beyond the near term volatility, a positive global growth outlook means cyclical and
    But Downtrend             risk currencies within the Majors and Asian FX space would regain their footing and strengthen
       Likely Intact          anew against the USD. The EUR would draw support from a brightening global economic outlook
                              that would eventually revive the reflation trades again which the EUR is one of the beneficiaries. As
                              such, we maintain an upward trajectory for our EUR/USD forecasts, updated at 1.18 in 2Q21, 1.19
                              in 3Q21, and 1.20 in both 4Q21 and 1Q22.

                              We remain positive on the GBP on valuation basis just as the tail risks of Brexit, negative UK policy
                              rates and COVID-19 have more or less fully dissipated. Our updated GBP/USD forecasts are 1.38 in
                              2Q21, 1.40 in 3Q21, 1.41 in 4Q21 and 1.42 in 1Q22. While near term risk may still be biased towards
                              a weaker AUD, our positive outlook of higher commodities prices and a strong recovery in the
                              domestic economy are likely to buoy the AUD higher over the medium term. Our updated forecasts
                              for the AUD/USD are 0.77 in 2Q21, 0.78 in 3Q21, and 0.79 in both 4Q21 and 1Q22.

   For Asian currencies,      As for Asian currencies, most are expected to firm up after the earlier volatility from higher US
   most are expected to       yields. The CNY is likely insulated from the expected volatility within the broader EM FX space due
firm up after the earlier     to its solid fundamentals and low reliance on USD-denominated debt. Seemingly more cordial ties
    volatility from higher
                  US yield.   between US and China also reduce tail risks of a CNY devaluation last seen during the 2018-2019
                              trade war. In all, our updated USD/CNY forecasts are 6.55 in 2Q21, 6.50 in 3Q21, and 6.40 in both
                              4Q21 and 1Q22. The SGD still tracks the CNY closely and a subsequent rebound in the latter would
                              help support the SGD. Overall, we update USD/SGD forecasts at 1.35 in 2Q21, 1.33 in 3Q21, and
                              1.32 in both 4Q21 and 1Q22. Higher oil prices are also favourable for MYR, as is a subsequent
                              recovery in the CNY. Overall, we update USD/MYR forecasts at 4.15 in 2Q21, 4.10 in 3Q21, and
                              4.05 in both 4Q21 and 1Q22. However, the exception would be high yielders such as IDR and INR
                              which are most vulnerable to rising US bond yields and bond market volatility as a result of the
                              underlying twin current account and fiscal deficits in their respective economies.

      Rates Strategy          Our US Macro team has upgraded their 2021 forecast for GDP growth (previously 4.5% revised
       Yield In Motion        to 6.3%) and inflation (previously 1.7% revised to 2.4%) in this publication. As such, we are now
      Stays In Motion         expecting 10Y UST yield to trend quickly towards 2.0% and consolidate around there for the rest of
                              this year. In particular, there has also been little pushback by policy makers with regards to higher
                              yields thus far which means that the market could continue to push the envelope in order to probe
                              for policy makers’ yield tolerance. And the next obvious frontier for 10Y UST to test is the headline
                              2.0% level.

   We expect that the         On the assumption that 10Y UST at the 2.0% yield level is well absorbed, will it be a straight shot to
    factor which would        3.0%? We do not think that the case for this scenario is in place yet. Policy rates are mostly locked
  most likely drive the       down for 2021 and major central banks will still be conducting bond purchases to smooth out the
next sustainable wave
higher in yields has to       yield path. Further down the line, we expect that the factor which would most likely drive the next
 be a shift in monetary       sustainable wave higher in yields has to be a shift in monetary policy towards a tightening stance.
       policy towards a       Overall, we now forecast 10Y UST yield at 1.90% for 2Q21, 1.95% for 3Q21, 2.00% for 4Q21 and
     tightening stance.       2.10% for 1Q22. Given that Fed has made it abundantly clear that there are no rate hikes planned
                              over the near term, yield curve is expected to steepen further with 3M US Libor locked in at 0.25%
                              for 4Q21.

                                                                                                Quarterly Global Outlook 2Q 2021
EXECUTIVE SUMMARY                                                                                                                  5
                                                                                         UOB Global Economics & Markets Research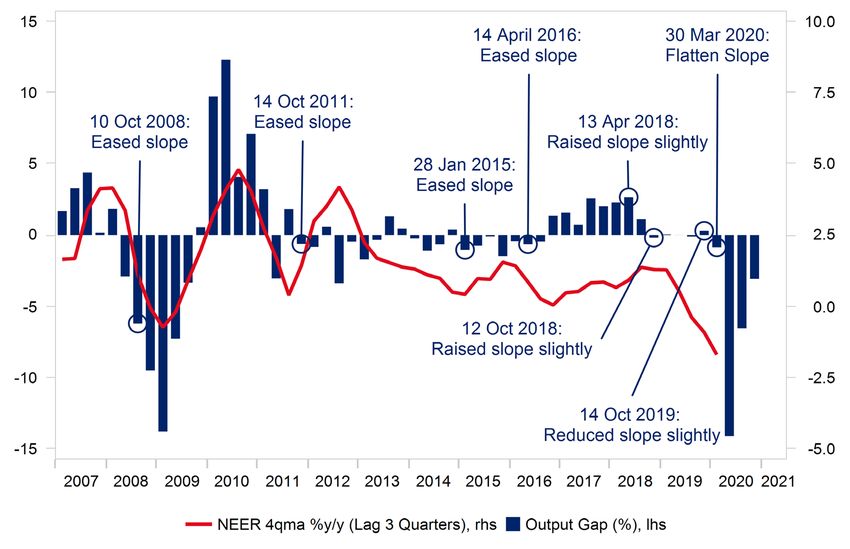
Commodities                        In the commodities space, gold was left out of the synchronized reflation rally as both LME Copper
           Strategy                     and Brent crude oil went from strength to strength. Across 1Q21, gold pulled back further from USD
     Gold Gets Left                     1,900 / oz to USD 1,700 / oz, weighed down by the normalization in US Treasuries yield back to the
        Out Of The                      1.70% pre-COVID-19 level of early 2020. While gold may continue to remain defensive, we believe
Synchronized Global                     that the bulk of the near term sell-off may be over. Overall, we maintain our constructive forecast for
 Commodities Rally                      gold, but lower our point forecasts in line with the higher US Treasuries yield over the past quarter.
                                        As such, our updated gold forecast is USD 1,700 / oz in 2Q21, USD 1,750 / oz in 3Q21 and USD
                                        1,800 / oz in 4Q21 and 1Q22.

    In the commodities                  LME Copper and the rest of the industrial metals complex were the key beneficiaries of the global
   space, gold was left                 economic recovery. From the depths of about USD 4,500 / MT last March, LME Copper price has
out of the synchronized
                                        now doubled in just a short span of one year to USD 9,000 / MT. Overall, our previous forecast
  reflation rally as both
LME Copper and Brent                    of USD 7,500 / MT across 2H21 now proved too conservative. In light of increased confidence
    crude oil went from                 and significantly larger magnitude of global growth recovery in the months ahead, coupled with
   strength to strength.                increasing demand for Copper from EV industry, we raise our LME Copper forecast to USD 9,000 /
                                        MT in 2Q21, USD 9,500 / MT in 3Q21 and USD 10,000 / MT in 4Q21 and 1Q22.

                                        As for Brent crude oil, OPEC’s decision to keep its production quota in place may well be a
                                        masterstroke that is timed perfectly with the anticipated recovery in global demand in the months
                                        ahead. That surprise decision reinforced the strong rebound in Brent crude oil across 1Q21 from
                                        the low USD 50 / bbl to above USD 60 / bbl. Going forward, notwithstanding the latest round of
                                        weakness due to higher US Treasuries yield, the global growth dynamics appear to be supportive of
                                        further gradual strength in Brent crude oil price. The return of backwardation in the futures curve is
                                        a clear sign of the immediacy of growing energy demand and this is accompanied by the sharp rise
                                        in futures open interest. We therefore raise our Brent crude oil forecast to USD 60 / bbl in 2Q, USD
                                        65 / bbl in 3Q21, and USD 70 / bbl in 4Q21 and 1Q22.

       Inflation Focus                  The recent US Treasury yields surge was attributed to the vaccine-driven reflation expectations, US
      Are We In For An                  to “go big” on fiscal stimulus, and inflation fears that could lead to earlier than expected monetary
     Inflation Surprise?                policy tightening.

                                        Even though latest US inflation outcomes remained benign, they are lagging indicators and the crux
                                        is expectations of higher inflation have been building up.

                                        We see US inflation rate trending higher, not yet at the “overheating” stage but the balance of risks is
                                        increasingly tilted to the upside due to the successful vaccine rollouts and more fiscal stimulus. We
                                        expect US inflation to average 2.4% in 2021 (from 1.4% in 2020) with risk that it may exceed 2.5%
                                        in some months of 2021.

     Indonesia Focus                    Inflation rates in Indonesia have been known to be typically high and somewhat volatile, owing to
     Subdued Inflation                  some administered prices adjustment and seasonality effects. Indonesia has experienced a more
       Is Likely To Stay                stable and lower inflation regime in more recent periods in light of applauded efforts in easing the
    On Amidst Sluggish                  supply bottlenecks through better infrastructure and logistical planning, broadening of the sources
                Demand                  of imports, and the forming of the region’s inflation directives authorities.

                                        Inflation is getting even more subdued during the pandemic year on the back of very sluggish
                                        demand. And with rising spending power resulting in more non-food items explaining bulk of inflation
                                        in recent years, a hold-up in non-essential consumption would render inflation to remain on a very
                                        low side for a while more.

     Singapore Focus                    Inflation expectations will likely be an important factor when deciding policy-making in April 2021.
          MAS Preview                   We keep to our base case for MAS to keep policy parameters unchanged in April. This means that
       - Policy-Making                  will likely be no change to the gradient and width of the policy band, as well as the level at which it
        In The Face Of                  is centred.
               Inflation
                                        Notwithstanding inflation risks (or the lack thereof), we expect MAS to adjust its rhetoric to
                                        acknowledge the higher import prices and stronger inflationary pressures, especially in 2H21.
                                        Should that come to pass, it suggests a heightened possibility for policy-makers to inject a symbolic
                                        appreciation to its SGD NEER gradient in October 2021.

        Quarterly Global Outlook 2Q 2021
6                                                                                                                          EXECUTIVE SUMMARY
        UOB Global Economics & Markets Research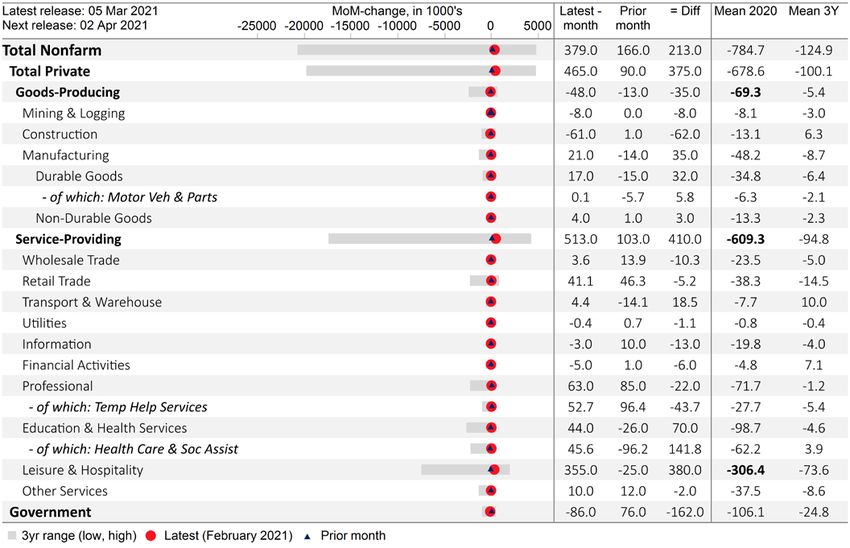
Global FX   USD/JPY: In line with our expectations of a          AUD/USD: While near term risk may still be
                       modestly weaker USD this year, as the near           biased towards a weaker AUD, our positive
                       term volatility in the bond markets ebbed,           outlook of higher commodity prices and a
                       the overbought USD/JPY should start to               strong recovery in the domestic economy are
                       normalize lower. Our updated forecasts are           likely to buoy the AUD higher over the medium
                       109 in 2Q21, 108 in 3Q21, and 107 in both            term. Our updated forecasts for the AUD/USD
                       4Q21 and 1Q22.                                       are 0.77 in 2Q21, 0.78 in 3Q21, and 0.79 in
                                                                            both 4Q21 and 1Q22, little changed from our
                       EUR/USD: As the near term volatility fades           previous levels in the last quarterly review in
                       with the backstop from the ECB, EUR would            December.
                       draw support from a brightening global
                       economic outlook that would eventually revive        NZD/USD: Going forward, as long as the
                       the reflation trades of which the EUR is one         global reflation theme stays intact, a buoyant
                       of the beneficiaries. As such, we maintain an        risk appetite and broad USD weakness are
                       upward trajectory for our EUR/USD forecasts,         likely to continue to support the NZD. Our
                       updated at 1.18 in 2Q21, 1.19 in 3Q21, and           updated forecasts for NZD/USD are 0.72 for
                       1.20 in both 4Q21 and 1Q22.                          2Q21, 0.73 for 3Q21, and 0.74 for both 4Q21
                                                                            and 1Q22.
                       GBP/USD: GBP is seen as undervalued,
                       having been battered by Brexit in the last
                       couple of years, but is now underpinned by
                       flows into the currency as the downside risks
                       posed by the pandemic to UK’s economic
                       recovery later this year have reduced. As
                       such, we remain positive on the GBP on
                       valuation basis just as the tail risks of Brexit,
                       negative UK policy rates and COVID-19 have
                       more or less fully dissipated. Our updated
                       GBP/USD forecasts are 1.38 in 2Q21, 1.40 in
                       3Q, 1.41 in 4Q21 and 1.42 in 1Q22.

            Asian FX   USD/CNY: It is likely the CNY is insulated           USD/HKD: At the same time, it is unlikely the
                       from the expected volatility within the broader      USD will gain a sustained advantage over the
                       EM FX space due to its solid fundamentals            HKD anytime soon. Short term US rates are
                       and low reliance of USD-denominated debt.            held near zero till at least end-2023 as the Fed
                       Seemingly more cordial ties between US               is willing to look past any near term overshoot
                       and China also reduce tail risks of a CNY            in inflation. Also, southbound demand for
                       devaluation last seen during the 2018-2019           Hong Kong stocks (hence HKD) remains
                       trade war. As such, our updated USD/CNY              healthy despite an increase in stamp duty on
                       forecasts are 6.55 in 2Q21, 6.50 in 3Q21, and        HK stock trades announced late February.
                       6.40 in both 4Q21 and 1Q22.
                                                                            Overall, it is likely that HKD will stay tethered
                       USD/SGD: The SGD also had its fair share of          to the stronger end of its CU. As such, we
                       volatility from the widening fallout of the global   maintain our view of USD/HKD at 7.75 for the
                       bond rout. USD/SGD rallied from 1.32 to 1.35         next four quarters beginning 2Q21.
                       in the first two weeks of March, its steepest
                       rise since its downtrend that started last April.
                       However, further sustained declines in the
                       SGD are not expected at this juncture given
                       Singapore’s effective control of the pandemic
                       and expectations of a strong 5% rebound in
                       GDP this year. Furthermore, the SGD still
                       tracks the CNY closely and a subsequent
                       rebound in the latter would help support the
                       SGD. Overall, we update USD/SGD at 1.35
                       in 2Q21, 1.33 in 3Q21, and 1.32 in both 4Q21
                       and 1Q22.

                                                                                         Quarterly Global Outlook 2Q 2021
EXECUTIVE SUMMARY                                                                                                               7
                                                                                  UOB Global Economics & Markets Research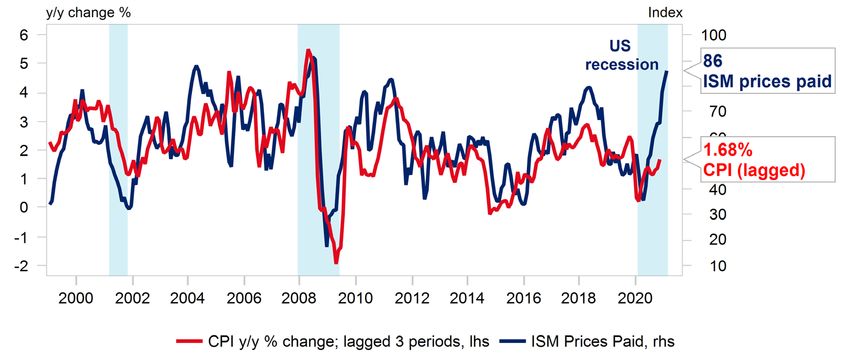
Asian FX                USD/TWD: While we expect these emerging           USD/THB: To recall, we have been cautious
                                    headwinds to pin the TWD lower at least in        on THB as a strong domestic currency is at
                                    the immediate quarter, TWD will benefit from      odds with an uncertain economic outlook and
                                    a broad recovery in Asian FX in 2H21 as the       could derail a nascent recovery in Thai exports
                                    global reflation trade intensifies and Taiwan’s   and GDP. The BOT has also consistently
                                    recovery gains traction this year.                signaled their intentions to rein in a strong
                                                                                      THB. As such, we expect the THB to remain
                                    The distinction from last year is that USD        on the weaker side of 30.0 /USD for the
                                    weakness is now expected to taper off and         immediate four quarters ahead. Our updated
                                    as such USD/TWD is likely to be supported         USD/THB forecasts are 31.1 in 2Q21, 31.2 in
                                    above the key 28.00 level going forward. Our      3Q21, and 31.5 in both 4Q21 and 1Q22.
                                    updated USD/TWD forecasts are 28.50 in
                                    2Q21, 28.30 in 3Q21, and 28.20 in both 4Q21       USD/PHP: PHP is supported by the
                                    and 1Q22.                                         country’s solid fundamentals (i.e. sound
                                                                                      banking system, ample foreign reserves, and
                                    USD/KRW: Being a proxy to the brightening         low holdings of local currency debt) amid an
                                    global trade outlook, we see further losses in    expected steady monetary policy stance.
                                    the KRW as limited. As the near term volatility
                                    in the global bond markets ebbed, KRW would       Overall, we maintain a slight appreciation bias
                                    stabilise and eventually rebound into the         for the PHP. Our updated forecasts for USD/
                                    end of the year, underpinned by a v-shaped        PHP are 48.5 in 2Q21, 48.2 in 3Q21, and 48.0
                                    rebound in the South Korean economy this          in both 4Q21 and 1Q22.
                                    year. Our updated USD/KRW forecasts are
                                    1,150 in 2Q21, 1,130 in 3Q21, and 1,100 in        USD/VND: With our expectations of a
                                    both 4Q21 and 1Q22.                               subsequent rebound in most Asian FX led by
                                                                                      the CNY, we expect the current bout of VND
                                    USD/MYR: While there was an abrupt drop           weakness to be short-lived. From a peak of
                                    in MYR to 4.14 in early March, we expect this     23,100 in the immediate quarter, USD/VND is
                                    to be temporary before resuming a gradual         expected to grind lower till the end of 2021.
                                    reversal. Malaysia’s external position remains    Our updated USD/VND forecasts are 23,100
                                    healthy with a current account surplus that       in 2Q21, 23,050 in 3Q21, and 23,000 in both
                                    would help cushion MYR.                           4Q21 and 1Q22.

                                    More importantly, MYR should be supported         USD/INR: While India’s growth prospects
                                    by further recovery in Asia, anchored by China.   have improved since our last quarterly review,
                                    Risks to watch include the pace of vaccine        one cannot ignore the downside risks given
                                    roll-out, domestic pandemic containment, and      that India has seen a resurgence of new
                                    recovery of Malaysia’s domestic economy.          COVID-19 cases since mid-Feb.
                                    Higher oil prices are also favourable for MYR.
                                    Given recent movements, we update USD/            Put together, we maintain our cautious outlook
                                    MYR forecasts to 4.15 in 2Q21, 4.10 in 3Q21,      on the INR, with USD/INR forecasts at 74.0 in
                                    and 4.05 in both 4Q21 and 1Q22.                   2Q21, 74.5 in 3Q21, and 75.0 in both 4Q21
                                                                                      and 1Q22.
                                    USD/IDR:       It should be emphasized
                                    that rising bond yields this time reflect a
                                    brightening global economic outlook rather
                                    than an abrupt negative risk event. As such,
                                    global risk appetite would stay supported
                                    and offset some of the effects on the IDR. In
                                    addition, BI could also intervene to smooth the
                                    FX moves given that it has built up a strong
                                    war chest. Indonesia’s FX reserves stood at a
                                    record high of USD 138.80 billion in February.
                                    Overall, our updated USD/IDR forecasts are
                                    14,600 in 2Q21, 14,700 in 3Q21, and 14,800
                                    in both 4Q21 and 1Q22.

    Quarterly Global Outlook 2Q 2021
8                                                                                                                 EXECUTIVE SUMMARY
    UOB Global Economics & Markets Research
“
Central Bank
                    Current   Quantum of rate     Next        Our Forecast                          Our
Outlook              Rate     cuts since 2020    Meeting      End-2Q 2021                       View/Outlook

                                                                             The Fed is willing to look past transient inflation
                                                                             impact and not react pre-emptively (AIT) and will
                                                                             supply clear communication well in advance of
  FED               0.25%        -150bps        27-28 April      0.25%       any bond-buying taper. We expect the Fed’s taper
  United States                                                              discussion will only start in late 2021/early 2022.
                                                                             Policy rate will stay at 0-0.25% till 2023.

                                                                             Despite the March framework review, the
                                                                             adjustments were small and did not portend any
                                                                             imminent danger of BOJ lowering rates further. We
  BOJ               -0.10%           -          26-27 April     -0.10%       still expect BOJ to ease monetary policy further in
  Japan                                                                      the next MPM, most likely through re-accelerating
                                                                             its JGB purchases and expanding its lending
                                                                             facilities.

                                                                             The ECB’s latest announcement – that purchases
                                                                             under the Pandemic Emergency Purchase
                                                                             Programme (PEPP) over the next quarter will
  ECB               0.00%            -           22 April        0.00%       be conducted at a significantly higher pace than
  Eurozone                                                                   during the first months of this year – reinforces our
                                                                             view that it will remain highly accommodative for
                                                                             longer.

                                                                             We are likely to see the BOE’s policy rate kept
                                                                             at current level with further quantitative easing
                                                                             (QE) announced later this year. We do not expect
  BOE               0.10%         -65bps          6 May          0.10%       interest rates to begin normalising before the end
  United Kingdom                                                             of 2022, whilst any downside could see the policy
                                                                             rate cut to zero alongside further increases to the
                                                                             scale of the ongoing QE programme.

                                                                             We continue to expect the cash rate to remain
                                                                             unchanged, but now expect a full AUD100bn
                                                                             extension of QE beyond the second round. That
  RBA               0.10%         -65bps          6 April        0.10%       said, we think that Yield Curve Control (YCC) will
  Australia                                                                  not be extended past the April 2024 bond.

                                                                             For now, we that negative interest rates are a risk
                                                                             but an increasingly low one. Our call remains for
                                                                             the OCR to be unchanged at 0.25%. More likely,
  RBNZ              0.25%         -75bps         14 April        0.25%       further quantitative easing will be implemented.
  New Zealand                                                                We see the RBNZ boosting the Funding for
                                                                             Lending program and its asset purchases.

                                                                             The PBoC said there should be “no sudden
                                                                             U-turn” of policy operations. While loans growth is
                                                                             set to moderate this year, we continue to expect
  PBOC              3.85%         -30bps        22 March         3.85%       the benchmark 1Y loan prime rate (LPR) to stay
  China                                                                      flat at 3.85% for the rest of 2021.

                                                                             Higher inflation and a robust economy may
                                                                             look like the perfect trigger for monetary policy
                                                                             normalisation. However, with the external
  CBC               1.125%        -25bps         17 June        1.125%       environment still uncertain while capital flows
  Taiwan                                                                     have turned more volatile due to shifts in global
                                                                             risk sentiment, CBC will probably wait for more
                                                                             certainty before doing so.

                                                                                        Quarterly Global Outlook 2Q 2021
EXECUTIVE SUMMARY                                                                                                               9
                                                                                 UOB Global Economics & Markets Research
“
Central Bank                   Current      Quantum of rate     Next        Our Forecast                         Our
Outlook                         Rate        cuts since 2020    Meeting      End-1Q 2021                      View/Outlook

                                                                                           We expect the BOK to be on hold through 2021. The
                                                                                           key risks to our view will be a sharp acceleration
                                                                                           in inflation. The rapid rise in household credit
     BOK                       0.50%              -75bps       15 April        0.50%       and property prices will also continue to warrant
     South Korea                                                                           attention but are unlikely to push the BOK to start
                                                                                           normalising this year.

                                                                                           Despite supply-driven inflationary pressures, the
                                                                                           nation’s economic recovery remains fragile and
                                                                                           needs persistent policy support as there are still
     BSP                       2.00%              -200bps     25 March         2.00%       potential downside risks brought by the pandemic
     Philippines                                                                           and probable delays in securing adequate vaccine
                                                                                           doses. Unless second round inflationary effects
                                                                                           occur, BSP would remain on hold.

                                                                                           MAS’ tone in its October’s MAS Monetary Policy
                                                                                           Statement remains cautious at best. Despite a GDP
                                                                                           contraction in 2020, Singapore’s macroeconomic
     MAS                      0% slope               -        April 2021    No change      indicators so far have shown signs of recovery.
     Singapore                                                                             Our base case is for the MAS to keep policy
                                                                                           parameters unchanged in its upcoming April 2021
                                                                                           meeting.

                                                                                           Despite weakness in GDP and ongoing
                                                                                           containment measures, we think BNM is less
                                                                                           inclined to use broad and blunt monetary policy
     BNM                       1.75%              -125bps      5-6 May         1.75%       tools, but targeted measures to support an uneven
     Malaysia                                                                              recovery. Muted underlying demand pressures
                                                                                           also suggest a continuation of neutral monetary
                                                                                           policy stance ahead.

                                                                                           Going forward, BI has less room to trim its
                                                                                           benchmark further without undermining the yield
                                                                                           differential to the domestic financial assets. We
     BI                        3.50%              -150bps     19-20 April      3.50%       keep our BI rate forecast to remain steady at
     Indonesia                                                                             3.50% for the rest of the year.

                                                                                           Given the gradual recovery seen in Thailand’s
                                                                                           macroeconomic environment, we keep our call
                                                                                           for BOT to leave its benchmark rate unchanged
     BOT                       0.50%              -75bps      24 March         0.50%       at 0.50% for the whole of 2021. Still, Thailand’s
     Thailand                                                                              economic growth is likely to be uneven, amid
                                                                                           pronounced downside risks should COVID-19
                                                                                           worsens.

                                                                                           With activities on track for normalization, we
                                                                                           believe that the SBV is done with its rate cuts and
                                                                                           will keep its key policy rates unchanged for the
     SBV                       4.00%              -200bps          -           4.00%       refinancing rate at 4.0% and rediscounting rate at
     Vietnam                                                                               2.5%.

                                                                                           Given the strong fiscal response seen in the recent
                                                                                           Union Budget FY2021/22, we believe that India’s
                                                                                           policy-makers will rely on the fiscal approach to
     RBI                       4.00%              -115bps       7 April        4.00%       lift their economy out from the unprecedented
     India                                                                                 slowdown. Coupled with a better macroeconomic
                                                                                           backdrop, we expect RBI to keep its policy rate
                                                                                           unchanged for the whole of 2021.

        Quarterly Global Outlook 2Q 2021
10                                                                                                                     EXECUTIVE SUMMARY
        UOB Global Economics & Markets Research
Real GDP Growth Trajectory
y/y% change 2020 2021F 2022F 1Q20 2Q20 3Q20 4Q20 1Q21F 2Q21F 3Q21F 4Q21F
China 2.3 8.5 5.7 -6.8 3.2 4.9 6.5 13.5 9.0 7.0 6.1
Hong Kong -6.1 5.0 3.0 -9.1 -9.0 -3.6 -3.0 3.6 5.2 5.0 6.1
India -9.0 10.5 6.0 3.1 -24.4 -7.3 0.4 -5.0 19.3 5.9 0.8
Indonesia -2.1 4.0 5.0 3.0 -5.3 -3.5 -2.2 -0.3 6.4 5.0 4.9
Japan -4.8 3.2 2.1 -2.0 -10.3 -5.8 -1.4 -1.0 8.5 3.9 1.9
Malaysia -5.6 5.0 4.5 0.7 -17.1 -2.6 -3.4 -3.2 12.2 5.1 6.0
Philippines -9.5 7.0 6.5 -0.7 -16.9 -11.4 -8.3 -2.5 13.2 9.8 7.5
Singapore -5.4 5.0 3.5 0.0 -13.3 -5.8 -2.4 -1.2 10.4 5.9 5.2
South Korea -1.0 3.3 2.6 1.4 -2.7 -1.1 -1.2 1.2 5.2 3.6 3.3
Taiwan 3.1 4.3 2.8 2.5 0.3 4.3 5.1 5.7 6.7 2.8 2.0
Thailand -6.1 3.5 4.5 -2.1 -12.1 -6.4 -4.2 -2.4 8.8 5.1 3.4
Vietnam 2.8 7.1 6.8 3.7 0.4 2.7 4.5 6.0 7.0 7.5 8.0
Australia -2.4 3.2 3.5 1.4 -6.3 -3.7 -1.1 -0.8 5.4 4.2 4.1
Eurozone -6.6 4.1 4.3 -3.3 -14.6 -4.2 -4.9 -2.2 12.5 2.4 3.7
New Zealand -1.2 4.0 3.3 0.3 -9.2 3.1 1.2 2.0 9.4 2.0 2.3
United Kingdom -10.0 4.7 5.5 -2.2 -21.0 -8.7 -7.8 -8.4 15.6 4.9 6.5
United States (q/q SAAR) -3.5 6.3 2.8 -5.0 -31.4 33.4 4.1 2.0 17.0 3.6 4.1
Note that India’s annual growth refers to its fiscal year print
Source: CEIC, UOB Global Economics & Markets Research
Heat Map Of Key Macro Indicators In The Region
Macroeconomic Indicator
(Latest Data)
Indonesia Malaysia Philippines Thailand Vietnam Singapore China India
Real GDP Growth (%): 4Q20
Inflation (%): Feb 21 (*Jan 21) * *
Merchandise Trade Balance (USD bn): Feb 21 (*Jan 21) * * * *
Manufacturing PMI (Index): Feb 21
08/20 01/21 01/21 12/20 12/20 01/21 02/21 02/21
Unemployment Rate1 (%)
Foreign Direct Investment (Annual, USD bn): 2020
Current Account (Annual, % Of GDP): 2020 (*2019) * * *
Fiscal Balance (Annual, % Of GDP): 2020 (*2019) * *
Color Code (Definition) Weakest Strongest
1 Unemployment data are as of date at top right (mm/yy)
Source: Bloomberg, UOB Global Economics & Markets Research
Quarterly Global Outlook 2Q 2021
EXECUTIVE SUMMARY 11
UOB Global Economics & Markets ResearchKey Events In 2Q 2021
April May June
1 April
15th OPEC and non-OPEC
Ministerial Meeting via
videoconference. In March,
OPEC+ surprised markets
by holding output steady,
signaling a tighter crude
market in the months ahead.
April - May
ASEAN Summit. The first of the bi-annual meeting in 2021 with Brunei
taking over the ASEAN chairmanship this year. Held via video conference,
the meeting is likely to focus on the region’s post-COVID recovery.
5-11 April
The 2021 Spring Meetings 6 May 6 June
of the World Bank and Scottish Parliament Election. Sarawak State Assembly.
the IMF. In January 2021, 129 members will be elected The current Sarawak State
IMF upgraded the world’s in the upcoming election. Assembly will expire on 6
2021 GDP to 5.5%, a 0.3 Debate about a second Scottish June if not dissolved earlier,
percentage point increase independence referendum after which an election must
from last October’s looks to be a dominant issue in be held within 60 days.
forecasts. There is potential the campaigning. However, Malaysia’s state of
of a further growth upgrade emergency will be in force
at this meeting given the until 1 August during which
pick-up in global vaccination no elections can be held.
programme efforts.
Likely 8-14 April
Singapore’s MAS Monetary
Policy announcement. 11-13 June
While economic outlook has 45th G7 Leaders’ Summit.
brightened, the MAS is likely Leaders are slated to meet
to err on the side of caution face-to-face for this meeting
and keep its FX policy to be held in Cornwall where
unchanged. UK assumes the presidency
of the G7. Expected topics
of discussion include
developing a response to
the COVID-19 pandemic and
April
climate change.
Japan PM Suga will visit US
in the first half of April at the
earliest for a meeting with
US President Biden. Japan
will raise three agenda
items for the meeting: 1) the
situation in the Indo-Pacific
region, 2) measures against
COVID-19 and, 3) climate
change.
Quarterly Global Outlook 2Q 2021
12
UOB Global Economics & Markets ResearchFX, Interest Rates & Commodities
FX 18 Mar 21 2Q21F 3Q21F 4Q21F 1Q22F RATES 18 Mar 21 2Q21F 3Q21F 4Q21F 1Q22F
USD/JPY 109 109 108 107 107 US Fed Funds Rate 0.25 0.25 0.25 0.25 0.25
EUR/USD 1.19 1.18 1.19 1.20 1.20 USD SOFR 0.01 0.09 0.10 0.10 0.11
USD 3M LIBOR 0.19 0.18 0.22 0.25 0.25
GBP/USD 1.39 1.38 1.40 1.41 1.42
US 10Y Treasuries Yield 1.70 1.90 1.95 2.00 2.10
AUD/USD 0.77 0.77 0.78 0.79 0.79
JPY Policy Rate -0.10 -0.10 -0.10 -0.10 -0.10
NZD/USD 0.72 0.72 0.73 0.74 0.74
EUR Refinancing Rate 0.00 0.00 0.00 0.00 0.00
DXY 91.8 92.4 91.5 90.8 90.9 GBP Repo Rate 0.10 0.10 0.10 0.10 0.10
AUD Official Cash Rate 0.10 0.10 0.10 0.10 0.10
USD/CNY 6.51 6.55 6.50 6.40 6.40 NZD Official Cash Rate 0.25 0.25 0.25 0.25 0.25
USD/HKD 7.77 7.75 7.75 7.75 7.75 CNY 1Y Loan Prime Rate 3.85 3.85 3.85 3.85 3.85
USD/TWD 28.47 28.50 28.30 28.20 28.20 HKD Base Rate 0.50 0.50 0.50 0.50 0.50
USD/KRW 1,131 1,150 1,130 1,100 1,100 TWD Official Discount Rate 1.13 1.13 1.13 1.13 1.13
KRW Base Rate 0.50 0.50 0.50 0.50 0.50
USD/PHP 48.66 48.50 48.20 48.00 48.00
PHP O/N Reverse Repo 2.00 2.00 2.00 2.00 2.00
USD/MYR 4.12 4.15 4.10 4.05 4.05 SGD SORA 0.26 0.11 0.12 0.12 0.13
SGD 3M SIBOR 0.44 0.40 0.40 0.40 0.40
USD/IDR 14,455 14,600 14,700 14,800 14,800
SGD 3M SOR 0.36 0.25 0.25 0.25 0.25
USD/THB 30.86 31.10 31.20 31.50 31.50
SGD 10Y SGS 1.59 1.85 1.90 1.95 2.05
USD/VND 23,074 23,100 23,050 23,000 23,000
MYR O/N Policy Rate 1.75 1.75 1.75 1.75 1.75
USD/INR 72.55 74.00 74.50 75.00 75.50 IDR 7D Reverse Repo 3.50 3.50 3.50 3.50 3.75
THB 1D Repo 0.50 0.50 0.50 0.50 0.75
USD/SGD 1.34 1.35 1.33 1.32 1.32 VND Refinancing Rate 4.00 4.00 4.00 4.00 4.00
EUR/SGD 1.60 1.59 1.58 1.58 1.58 INR Repo Rate 4.00 4.00 4.00 4.00 4.00
GBP/SGD 1.87 1.86 1.86 1.86 1.87
COMMODITIES 18 Mar 21 2Q21F 3Q21F 4Q21F 1Q22F
AUD/SGD 1.04 1.04 1.04 1.04 1.04
Gold (USD/oz) 1,734 1,700 1,750 1,800 1,800
SGD/MYR 3.07 3.07 3.08 3.07 3.07
Brent Crude Oil (USD/bbl) 63 60 65 70 70
SGD/CNY 4.85 4.85 4.89 4.85 4.85
JPY/SGDx100 1.23 1.24 1.23 1.23 1.23 LME Copper (USD/mt) 9,056 9,000 9,500 10,000 10,000
Quarterly Global Outlook 2Q 2021
FORECASTS 13
UOB Global Economics & Markets ResearchINFLATION Are We In For An Inflation Surprise?
FOCUS
The recent US Treasury yields surge was attributed to the vaccine-driven reflation
expectations, US to “go big” on fiscal stimulus, and inflation fears that could lead to earlier
than expected monetary policy tightening.
The key supporting factors to US inflation in 2021 include the acceleration in growth of
personal consumption. capital spending, housing, and inventory builds of which these sectors
had been the main contributors to the US’ recovery process last year. The US savings rate
is expected to normalise as US consumers resume their social and travel activities and
increase spending. If the consumer spending surge is formidable, then so will be the inflation
risk. The key downside for US prices is the significant slack in the labour market which will
continue to improve as unemployment decline through the year.
We see US inflation rate to be trending higher, not yet at the “overheating” stage but the
balance of risks is increasingly tilted to the upside due to the successful vaccine rollouts and
more fiscal stimulus. We expect US inflation forecast to average 2.4% in 2021 (from 1.4% in
2020) with risk that it may exceed 2% in some months of 2021. That said, some of the price
increases are likely transitory and we expect inflation to ease back to average 2% in 2022.
Factors to watch will be the slack in the labour market, the ISM prices paid index, housing
prices and commodity prices.
Inflation in Asia is expected to trend higher due to base effects, higher food & commodity
prices, expiration of government subsidies & other policy measures, and demand recovery.
That said, the price increases for the region is likely to be manageable as demand recovery will
stay muted in a year where economies in this region continue to emerge from the COVID-19
pandemic. Slack in the labour markets will be the chief downside risk while commodity prices
will pose as the key upside risk to inflation.
US Inflation Trends The main manifestation of inflation concerns was the recent surge in US Treasury bond yields
Rising Expectations which has caused reassessments in various market segments and led sovereign bond yields higher
elsewhere, from developed markets to emerging markets. After jumping more than 16 basis points
to 1.614% on 25 Feb, the US 10-year yield jumped again to close at 1.625% on 12 Mar and briefly to
above 1.75% on 18 Mar, its highest level since Jan 2020. The spikes in the 10-year yield has been
driven by reflation expectations due to 1) improving economic conditions as coronavirus vaccines
are rolled out globally, 2) US continuing to “go big” on fiscal stimulus and 3) fears of higher inflation
which could force the hands of the US Federal Reserve.
It is also notable That said, if you look at the latest core PCE data – the Fed Reserve’s preferred price index tied
that prices of to personal spending – US inflation is edging higher (1.53% y/y in Jan from 1.45% in Dec) but it
recreation goods & remains some way from the Fed Reserve’s 2% inflation goal. Inflation drivers were mainly due to
recreation services
services (in particular household consumption and health care) while the inflation contribution from
(entertainment), food
services (restaurants), goods have remained moderate.
and clothing remained
soft due to weak Of course, the inflation outcomes are lagging indicators and the crux of the issue is what is the
demand reflecting markets’ expectation for future price trends. Unsurprisingly, expectations of higher inflation have been
the nature of the
building up since mid-2020, as the US economic rebound got underway after the unprecedented
recession and social
restrictions to contain annualized decline of 31.4%q/q in 2Q20. These expectations are reflected in the jump in TIPS
the pandemic. (Treasury Inflation-Protected Securities) yields as well as consumer expectations which tend to be
correlated with future changes in the inflation, although it may not always turn out to be the case.
Quarterly Global Outlook 2Q 2021
14 INFLATION FOCUS
UOB Global Economics & Markets ResearchUS PCE inflation US Core PCE
is higher, but only Percentage point contributions to the rate of inflation (% y/y)
modestly. PCE edged
Source: Macrobond, UOB Global Economics & Markets Research
higher to 1.53% y/y
in Jan, on household
consumption and
health care services
components while
goods items remained
stable. That said, PCE
is a lagging indicator
and does not account
for the expectations
factor.
Turning the
corner in inflation US: TIPS Spread (3M ahead) And Core PCE (3M moving average)
expectations. The
Source: Macrobond, UOB Global Economics & Markets Research
US TIPS spread has
“turned the corner”
around Jun 2020 on
the perception of US
inflation. However, the
past record shows that
TIPS spread is a poor
indicator of the actual
inflation figures.
University of
Michigan inflation US Inflation Expectations: University of Michigan Consumer Sentiment Survey vs. Headline CPI
expectations. While
Source: Macrobond, UOB Global Economics & Markets Research
there is high degree
of correlation (about
60%) between
consumer expectations
of inflation ahead
and the CPI trend,
there is a tendency
to overestimate the
inflation upside,
especially since the
2008 global financial
crisis.
Quarterly Global Outlook 2Q 2021
INFLATION FOCUS 15
UOB Global Economics & Markets ResearchKey Supporting
Factors For
US Inflation
Pressures Ahead
1. Increase Personal and capital spending, housing, and inventory builds will be key in 2021: These sectors
in domestic had been the main contributors to the US’ recovery process in 2020. On the CPI (consumer price
demand index) basket, transport and food & beverages provided most of the lift to CPI increases. This is
likely to be the main trend as “normalcy” returns with more Americans receiving vaccination as well
as additional fiscal support.
2. Rising home US home prices rose strongly by more than 10% in 2020, fueled by rising homeownership amidst low
prices interest rates while the pandemic and rise in work-from-home arrangement also attracted families to
shift to bigger suburban homes from smaller city dwellings. The sustained rise in real estate prices
will eventually be passed through to higher rental increases within the CPI inflation basket.
Personal and capital
spending, housing, Composition of US GDP Growth: Percentage Points Contributions
and inventory
Source: Macrobond, UOB Global Economics & Markets Research
builds will be key
in 2021. The above
sectors had been key
to the US’ recovery
process in 2020.
These demand drivers
will be boosted by
further fiscal stimulus
ahead and ongoing
accommodative
monetary policy.
3. Fiscal stimulus A perhaps counter-intuitive factor that points to upside risk to US inflation is the higher than usual
and another spike in US saving rates. 2020 saw US savings rate (as a percent of disposable personal income) surging to
savings rate an all-time record of 26% in 2Q as real disposable personal income (adjusted for taxes and inflation)
increased strongly as a result of the marked increase in personal current transfer receipts (i.e.
government social benefits) while consumption fell markedly during the pandemic-ravaged quarter.
Since then, the personal saving rate has eased markedly to 16% in 3Q and to 13% in 4Q, as
government social benefit payments slowed while consumer spending recovered. That said, US
saving at 13% in 4Q is still at an elevated rate compared to that of the last few decades (the previous
high was 15.3% in 2Q 1975), and is probably indicative that there may be some way to go before
consumption recover to pre-pandemic levels.
And with the passage of the December 2020 stimulus package (of around US$900 billion) and
President Biden’s US$1.9 trillion COVID-19 relief plan, we may yet see a rebound in savings rate
as social restrictions remain in place to contain the pandemic in the near term, which will inevitably
hurt consumption spending while the COVID-19 support measures will help shore up the income
component in 1Q 2021.
Subsequently, as US consumers incrementally resume social and travel activities with the rising
percentage of population being vaccinated increases, saving rates will normalise (by at least several
percentage points) as spending growth picks up in tandem with personal mobility. If the consumer
spending surge is formidable, then so will be the inflation risk, especially to recreation goods and
services, food services and clothing.
Quarterly Global Outlook 2Q 2021
16 INFLATION FOCUS
UOB Global Economics & Markets ResearchLabour Market The US labour market slack remains significant despite the strong economic recovery seen since
Slacks The Main the second half of 2020. Notwithstanding many months of jobs recovery, US employment level as at
Dampener To Feb 2021 is still 8.5 million below of that pre-COVID19 (Feb 20), while participation rate is also nearly
Inflation 2ppts lower. Among the sectors, services industries were the recipients of the disproportionately
deep scarring due to the pandemic, resulting in a K-shaped recovery for the US economy. This
K-shaped recovery will in turn curb much of wage demand pressures.
This point may seem counter-intuitive to the wage data as US wages have been consistently growing
5% y/y or more in recent months. However, this is again the reflection of this K-shaped recovery
amidst this pandemic as lower paying services jobs were lost again as the pandemic surged during
the winter months, while other better-paying sectors continued to thrive in this environment, and
the net effect is an artificial spike in wages, masking the dire circumstances of the lower-income
households in the US.
Inflation Outlook The bottom line is that, for now, US inflation rate will be trending higher, not yet at the “overheating”
Higher With Risks Of stage but the balance of risks is increasingly tilted to the upside. As the economic recovery expands
Further Upside further, potentially due to the upside on successful vaccine rollouts and more fiscal stimulus, we
may see headline inflation rising above 2% and even exceeding 2.5% for some months in 2H 2021.
However, it remains uncertain how high, and for how long, the headline inflation figures will persist
above the 2% target set by the US Fed. Going by history, US inflation (both headline and core
measures) has largely stayed within one standard deviation (SD) of their rolling 10-year averages.
We expect US inflation forecast to average 2.4% in 2021 (from 1.4% in 2020), with the risks biased
to the upside. That said, some of the price increases are likely transitory and we expect inflation to
ease back to average 2% in 2022. Of interest to watch in relation to inflation developments will be
to see how the slack in the labour market is being resolved, and the ISM prices paid index (which
jumped nearly 4 points to 86 in Feb 2021, the highest since July 2008 due to supply shortages) as
it is strongly correlated to the US CPI. The CPI components of transport and food & beverages will
be of interest too and of course US housing prices and commodity prices.
Higher inflation
ahead. ISM prices US: ISM Prices Paid And CPI Inflation
paid index has a
strong correlation Source: Macrobond, UOB Global Economics & Markets Research
with US CPI (61%
with 3-month lag),
although past
experience suggests
the tendency for the
index to overshoot on
the upside vs actual
inflation rates.
Quarterly Global Outlook 2Q 2021
INFLATION FOCUS 17
UOB Global Economics & Markets ResearchTransport and food
prices to add to CPI US: Contributions To Headline CPI Inflation (latest: Feb 2021)
upside. As economic
Source: Macrobond, UOB Global Economics & Markets Research
activities in the US
picked up, transport
and food & beverages
provided most of the
lift to CPI increases.
This is likely to be
the main trend as
“normalcy” returns
with more Americans
receiving vaccination.
Higher US savings
rate now may portend US Personal Saving Rate (Quarterly, SA annualised)
higher inflation in
Source: Macrobond, UOB Global Economics & Markets Research
the future as the
rate normalises.
US savings rate
surged in 2020 as
a result of surge in
personal current
transfer receipts while
consumption fell
markedly. As saving
rate normalises, the
correlated jump in
consumer spending
will add further inflation
pressures.
US inflation trend
stronger vs peers. DM vs US Core Inflation: Distribution by Decile
Due to its underlying
Source: Macrobond, UOB Global Economics & Markets Research
dynamism, US
inflation tends to
move at a faster
pace compared to its
developed markets
peers. There is a risk
that the US inflation
could overshoot the
2% target like it did
in 2018-19 to early
2020, just before the
COVID-19 pandemic
struck.
Quarterly Global Outlook 2Q 2021
18 INFLATION FOCUS
UOB Global Economics & Markets ResearchUS inflation trend
appears to be well US: Inflation Measures And Deviations From Trend
contained. Since the
Source: Macrobond, UOB Global Economics & Markets Research
2008 global financial
crisis, both the
headline and core US
CPI measures appear
to be well behaved,
largely staying within
one standard deviation
(SD) of their rolling 10-
year averages, which
itself has been on a
downtrend.
Labour market slack
remains significant. US Nonfarm Payrolls: Cumulative Change Since March 2020
With nearly 10 million
Source: Macrobond, UOB Global Economics & Markets Research
jobs lost since the
start of the COVID-19
pandemic in Mar 2020,
the US is still far away
from “full employment”.
The slack labour
market reduces risks
of “overheating”,
despite loose
monetary policy and
more fiscal stimulus is
on the cards.
Deep scarring in
services sectors. US Nonfarm Payrolls, By Industry
Like in other countries,
Source: Macrobond, UOB Global Economics & Markets Research
the COVID-19
pandemic has resulted
in various forms of
containment measures
such as lockdowns
and social distancing,
damaging businesses
and sectors that rely
on close personal
contact, such as
leisure and hospitality
sectors.
Quarterly Global Outlook 2Q 2021
INFLATION FOCUS 19
UOB Global Economics & Markets ResearchSlack US labour
market drives US Labor Force And Participation Rate By Gender
participation rates
Source: Macrobond, UOB Global Economics & Markets Research
lower. Overall
participation rate is at
the lowest since 1976
as some employees
stopped seeking work
and some companies
closed permanently in
the midst of COVID-19
pandemic.
Asia Like the developed markets, most of Asia is not currently experiencing any serious inflation challenges
Muted Headline, and the key concern is still centred on growth recovery from the COVID-19 pandemic. That said,
Rising Price prices have picked up in recent months due to higher commodity prices (specifically crude oil prices)
Momentum and food. Excluding energy, inflation remains largely benign in Asia as the ongoing pandemic has
sapped demand for recreation, entertainment, restaurants (broadly services inflation).
Even as some economies are still experiencing temporary price declines (y/y), it is noted that the
broad price trends are pointing to upward momentum (m/m basis), of which Philippines is seeing the
fastest pace of inflation in the region.
Going forward, there are several factors that will support inflation but the upside push from the
demand side factors may be limited in 2021 as many Asian economies continue to grapple with
containing the COVID-19 pandemic and the logistics and availability of the vaccine to their respective
populations.
Asia Ex-Japan CPI
Inflation (blue) and Asian Inflation vs Crude Oil Price
crude oil price (red).
Source: Macrobond, UOB Global Economics & Markets Research
There has been a
significant positive
correlation between
Asian inflation
and crude oil price
changes. Thus, the
rise in crude oil prices
will be closely watched
for its impact on price
developments in the
region.
Quarterly Global Outlook 2Q 2021
20 INFLATION FOCUS
UOB Global Economics & Markets ResearchLatest CPI % y/y % m/m
Inflation For Inflation
Selected 2020 Dec 20 Jan 21 Feb 21 Dec 20 Jan 21 Feb 21
Countries
China 2.5 0.2 -0.3 -0.2 0.7 1.0 0.6
Hong Kong 0.3 -0.7 1.9 - -0.5 1.1 -
S. Korea 0.5 0.5 0.6 1.1 0.2 0.8 0.5
Taiwan -0.2 0.0 0.2 1.4 0.2 0.5 -0.1
ASEAN
Indonesia 2.0 1.7 1.6 1.4 0.5 0.3 0.1
Malaysia -1.1 -1.4 -0.2 - 0.5 1.2 -
Philippines 2.6 3.5 4.2 4.7 0.9 1.3 0.2
Singapore -0.2 0.0 0.2 - 0.4 0.0 -
Thailand -0.8 -0.3 -0.3 -1.2 0.2 0.1 -0.9
Source: Macrobond, UOB Global Economics & Markets Research
Factors Lifting 1. The low base effect, coming from the pandemic hit year of 2020, especially in the months of
Inflation April and May.
2. The continued and broad rise in commodity and food prices, of which higher oil prices will be
the key concern for many Asian economies.
3. The expiration of government subsidies which implemented to ease consumer burden
during onset of the pandemic in 2020 (for China, Hong Kong, Indonesia and Thailand), other
government measures such as higher excise duty for petrol (for Singapore), and near term
spike in logistics costs.
4. Recovery of domestic demand and discretionary spending.
And similar to the US, Asian economies are also facing slack within their labour markets, especially
for the pandemic hit services sectors, and that will curb wage-price pressure on overall CPI inflation
which is likely the main downside factor.
The overall conclusion for Asian inflation outlook is that it will trend higher in 2021 on account of the
above factors, but the increase is likely to be manageable as demand recovery will stay muted in a
year where economies in this region continue to emerge from the COVID-19 pandemic. Slack in the
labour markets will be the chief downside risk while commodity prices will pose as the key upside
risk to inflation.
China: Headline CPI was
negative in Jan-Feb due China Headline & Core CPI Versus PPI
to a high comparison base
but is expected to reverse Source: Macrobond, UOB Global Economics & Markets Research
quickly to bring average
2021 inflation to 2.6%.
Food and commodity prices
will likely remain the key
drivers given that demand
has stayed muted. As we
expect the PPI to rebound
sharply to 4.0% this year
due to higher production
material prices and a low
base effect, that may pose
further upside risks to our
CPI forecast should there
be translation to higher
consumer goods prices.
Quarterly Global Outlook 2Q 2021
INFLATION FOCUS 21
UOB Global Economics & Markets ResearchMalaysia: Latest headline
CPI registered narrower Malaysia Headline & Core CPI Versus PPI
declines due to higher
fuel prices, an uptick in Source: Macrobond, UOB Global Economics & Markets Research
selected food items, and
effects of lower electricity
bill discounts. We expect
headline inflation to return
to positive territory by
1Q21 and to average at
3.0% in 2021 mainly due
to transitory factors.Upside
risks to inflation will be
tempered by the extension
of sales tax exemption
for passenger vehicles,
reintroduction of electricity
bill discounts and a cap on
domestic fuel and diesel
prices.
Philippines: Costlier
food and fuel are the two Philippine Headline CPI and Selected Prices
key components pushing
up headline inflation since Source: Macrobond, UOB Global Economics & Markets Research
Oct 2020.This supply-
driven inflationary pressure
is deemed transitory and
is expected to subside
in 2H21, resulting in an
average 4.0% inflation for
2021. Nonetheless, there
are no signs of second
round inflationary effects
presenting at this juncture
amid linger uncertainties
surrounding the pandemic
and vaccines as well as
labour market slacks.
Thailand: Lower oil prices
and lacklustre consumer Thailand: CPI Contribution Across Clusters
demand dragged consumer
prices to average -0.8% in Source: Macrobond, UOB Global Economics & Markets Research
2020. In 2021, Thailand’s
consumer prices are
expected to pick up to
average 1.5%. Across
clusters, we expect energy-
related prices to surge 6.0%
on assumption that Brent
crude averages US$60-70/
bbl for the year ahead.
Other components such as
food (2021F: +3.2%) and
non-food (2021F: +1.1%)
are also expected to support
the inflationary environment.
Quarterly Global Outlook 2Q 2021
22 INFLATION FOCUS
UOB Global Economics & Markets ResearchINDONESIA Subdued Inflation Is Likely To Stay On
FOCUS Amidst Sluggish Demand
Inflation rates in Indonesia have been known to be typically high and somewhat volatile,
owing to some administered prices adjustment and seasonality effects.
Nevertheless, Indonesia has experienced a more stable and lower inflation regime in more
recent periods in light of applauded efforts in easing the supply bottlenecks through better
infrastructure and logistical planning, broadening of the sources of imports, and the forming
of the region’s inflation directives authorities.
Inflation is getting even more subdued during the pandemic year on the back of very sluggish
demand. This is especially so given that rising spending power has resulted in more non-
food items explaining bulk of inflation in recent years, of which a hold-up in non-essential
consumption would render inflation to remain on a very low side for a while more.
Inflation rates in Indonesia have been known to be typically high and somewhat volatile. This is
especially so since the series of fuel subsidy reforms in Indonesia and during commodity super
cycle (when oil price is high).
The country Chart 1 denoted that headline inflation, the broadest measure of inflationary pressures in the
experienced a consumer price index (CPI) basket of Indonesia, were significantly higher during those periods that
significant collapse in
were mainly reflected by the higher administered price components where the fuel prices category
the commodity revenue
amidst the end of the is housed under. The volatile price component has sometimes spiked due to seasonal effects and
commodity super-cycle supply side shocks. In particular, the country experienced a significant collapse in the commodity
since 2012, putting revenue amidst the end of the commodity super-cycle since 2012, putting Indonesia under the spell
Indonesia under of a more persistent current account deficit, mainly due to the fact that Indonesia remains an import-
the spell of a more
dependent economy for certain capital goods and services.
persistent current
account deficit, mainly
due to the fact that This has weighed on Indonesia’s external balances that resulted in a gradual depreciation of the
Indonesia remains local currency and higher imported inflation, particularly when growth and growth expectations were
an import-dependent strong.
economy for certain
capital goods and
services. Given Bank Indonesia (BI)’s higher credibility in its inflation targeting mandate over time, Indonesia
has experienced a more stable and lower inflation regime. Easing of the supply bottlenecks through
better infrastructure and logistical planning, broadening of the sources of imports, and the forming
of the region’s inflation directives authorities (“Tim Pengendali Inflasi Daerah” – TPID) have resulted
in BI’s consistent lowering of the inflation target range from 5-7% in 2005 to 2-4% currently. Inflation
has also been significantly more muted over the past year-to-date.
Quarterly Global Outlook 2Q 2021
INDONESIA FOCUS 23
UOB Global Economics & Markets ResearchYou can also read


