Quarterly Global Outlook 2Q 2020 - The Cost Of Containment Is Synchronized Recession - UOB bank
←
→
Page content transcription
If your browser does not render page correctly, please read the page content below

Quarterly Global Outlook 2Q 2020
The Cost Of Containment Is
Synchronized Recession

Quarterly Global Outlook 2Q2020
The Cost Of Containment Is Synchronized Recession

The coronavirus disease (COVID-19) is          From our perspective, the US, large parts of
not only a public health crisis, but is also   Europe and many other major economies
a global economic crisis as activities         are expected to be in contraction for 2020
worldwide shut down. It disrupts global        while China will record recessionary growth
supply chains, destroys demand and it is       rate close to 4%. This will be a synchronized
also a financial shock that the markets are    global recession and we conservatively
currently still grappling with even as the     project a “U” shaped recovery where the
pandemic worsens in various jurisdictions.     COVID-19 may be contained by 4Q 2020.

To get over this latest challenge, the virus   Central banks and governments have
needs to be contained and the transmission     responded aggressively to tackle the
chain needs to be broken. Tough health         negative impact brought about by the
security measures in the form quarantines,     COVID-19 but monetary and fiscal
social distancing, travel restrictions,        policies are ill equipped to solve a public
lockdowns and border closures need to          health crisis. The one critical element that
be enforced to contain COVID-19, but           determines the speed of recovery from this
these measures will lead us inevitably to a    global economic crisis will largely depend
synchronized recession, on a global scale.     on how successful the health security
                                               measures will be to contain the pandemic
                                               so as to allow normal economic activities
                                               to resume.

“I am prepared for the worst, but hope for the best.”

Benjamin Disraeli

                                                                        Quarterly Global Outlook 2Q 2020
                                                                                                           3
                                                                 UOB Global Economics & Markets Research
CONTENT

06      EXECUTIVE SUMMARY                     39   China
        The Cost Of Containment Is
                                              40   Hong Kong
        Synchronized Recession
                                              41   India
13      FX, INTEREST RATE &                   42   Indonesia
        COMMODITIES FORECASTS
                                              43   Japan
14      GLOBAL POLICY FOCUS                   44   Malaysia
        Fiscal And Monetary Stimulus
        To Combat COVID-19                    45   Myanmar
                                              46   Philippines
17      SINGAPORE FOCUS
                                              47   Singapore
        Singapore MAS Preview:
        More Easing Needed To Aid Growth      48   South Korea
                                              49   Taiwan
21      INDONESIA FOCUS
        Review & Outlook                      50   Thailand
        For Domestic Banking Sector           51   Vietnam
                                              52   Australia
24      FX STRATEGY                           53   Eurozone
        USD Unbeatable As Global Recession
        Fears Spark Scramble For Cash         54   New Zealand
25                                            55   United Kingdom
        RATES STRATEGY
                                              56   United States of America
        Hello ZIRP And QE Our Old Friends

25      COMMODITIES STRATEGY
        No Escape From The Global Recession

Information as of 26 March 2020

Scan the QR Code for
a list of all our reports

Email: GlobalEcoMktResearch@UOBgroup.com
URL: www.uob.com.sg/research
Bloomberg: UOBR

                                                          Quarterly Global Outlook 2Q 2020
                                                                                             5
                                                   UOB Global Economics & Markets Research
EXECUTIVE SUMMARY
    The Cost Of Containment Is
    Synchronized Recession

    The global economic outlook cannot           institutions face the additional dilemma     Is It A “V”, “U” Or
    be more starkly different compared to        of tight USD funding crunch which is         Something Far Worse?
    what we had penned down at the start         now holding financial markets hostage        Below are the probabilities we assigned
    of the year. It started with a coronavirus   while the plunge in economic activity        to the three generalized recovery
    disease (COVID-19) outbreak in China         will result in a new cycle of defaults and   trajectory scenarios and in all the three
    late December 2019, and within months        credit failures in the months ahead as       scenarios, we assume the only variable
    spread to all major economies turning        the pandemic drags on.                       is the length of time needed to contain
    into a global pandemic (as announced                                                      the COVID-19.
    by the World Health Organization, WHO,       At the time of writing (as of 26 Mar),
    on 11 March 2020). So far, the outbreak      the COVID-19 pandemic epicenter              Given the fast evolving situation, we
    in Europe and the United States show         has shifted from Asia to Europe as           have gotten more cautious about the
    no signs of abating and could very well      the number of fatalities rise rapidly        outlook compared to our last quarterly
    get worse in 2Q.                             there. Meanwhile the number of               report and even one week ago. There
                                                 infections and fatalities in the US is       is just too much uncertainty in our
    COVID-19 is not only a public health         accelerating and may well be the next        economic projections due to the threat
    crisis, but is also a global economic        COVID-19 epicenter. To get over this         that we are dealing with and it is difficult/
    crisis as economic activities worldwide      latest challenge, the virus needs to         impossible to predict how fast the
    shut down. The International Monetary        be contained in each locality and the        COVID-19 can be contained.
    Fund (IMF) expects a global recession        transmission chain needs to be broken
    this year that will be at least as severe    while we race to search for a vaccine.       China, where COVID-19 first struck in a
    as the one during the 2008/2009 Global                                                    massive wave, managed to contain the
    Financial Crisis while the Institute of      Health security measures in the form         epidemic in around two months, using
    International Finance (IIF) projects a       quarantines, social distancing, travel       very tough, draconian and effective
    1.5% contraction in the global economy       restrictions, lockdowns and border           measures. But it remains on very high
    this year, with advanced economies           closures are enforced in various             alert as imported infections are on the
    shrinking a larger 3.3%.                     jurisdictions, in an attempt to slow the     rise. The risk is after a brief period
                                                 infection rate and transmission, i.e.        of respite as summer approaches,
    COVID-19 is like the “Black Swan”            “to flatten the infection curve”, so as      COVID-19 resurges with a vengeance in
    stress test scenario that came true but      to protect lives and not overwhelm the       2H, which means returning to personal
    is much worse. It is a triple-shock: It is   health care system. However, these           restrictions, lockdown, border closures
    a supply shock as factories shut down        measures will lead us inevitably to a        and other measures to contain the virus,
    which disrupts global supply chains.         synchronized recession, on a global          and inevitably decimating economic
    It is also a demand shock as the             scale.                                       activity again.
    lockdowns, border closures, stay-home
    orders and travel restrictions disrupt       From our perspective, the US, large          We have in our base case scenario
    our daily lives and decimate regular         parts of Europe and many other major         as a U-shaped recovery (55%), and
    economic and consumption activities,         economies are expected to be in              because we see more downside risks
    essentially shrinking the economy. And       contraction for 2020 while China may         to successful widespread containment
    it is also a financial shock which has       record sub-5% growth. So this will be        at this juncture so the probability of the
    now manifested into a USD funding            a synchronized global recession. The         L-shaped scenario is higher at 25%
    crunch, as companies and consumers           big question is after such a significant     versus the V-shaped at 20%.
    draw on their credit lines in the face       drawdown in economic output in 1H,
    of cash flow disruptions. In addition,       what will we be looking at in the second
    non-US based borrowers and financial         half of 2020?

     Quarterly Global Outlook 2Q 2020
6                                                                                                                EXECUTIVE SUMMARY
     UOB Global Economics & Markets Research
Possible Economic Recovery Shapes In 2020

Shape of Trajectory                                 V-Shaped                              U-Shaped                                L-Shaped

Probability                                         20% (Best)                        55% (Base Case)                            25% (Worst)

                                                                                                                      Through 2020, containment by 2H
COVID-19 containment                              By end-2Q 2020                         By 4Q 2020
                                                                                                                                   2021

                                                                                                                       Deep recession for the full year,
                                                                               Sharp technical recession in 1H,
                                       Recession in 1H, a rebound in 2H                                               extensive supply chain disruption
                                                                              recovery in 2H not strong enough,
Global Economy                          (similar to SARS). Growth is still                                               and demand destruction, a
                                                                              with global economy recording full-
                                      positive but lower than 2.9% in 2019.                                               prolonged financial stress
                                                                                    year contraction in 2020
                                                                                                                                environment

                                                                                                                      Developed market rates will stay
                                       Near term low and possible strong      Remain low heading into 2021 but
Rates                                                                                                                 pinned down at zero and in some
                                          rebound if inflation returns.       unlikely to head significantly lower
                                                                                                                            cases stay negative

                                        Commodities and energy related            Once USD funding crunch
                                                                                                                      USD will stay strong against most
Currencies                              currencies like AUD may rebound          dissipates, can expect some
                                                                                                                         EM and Asian currencies
                                                      strongly                 recovery in Asia FX, led by RMB

Source: UOB Global Economics & Markets Research

Fiscal And Monetary Policies                            Despite all the interventions, the global           Indeed, monetary and fiscal policies
Joining Forces, But                                     financial markets continued to face                 are ill equipped to solve a public health
It Is Not Enough                                        dislocations given the unprecedented                crisis. The one critical element that
Since the pickup in severity of the                     economic uncertainties created by the               determines the speed of recovery from
COVID-19 pandemic, central banks have                   COVID-19 pandemic. And on the area                  this global economic crisis will largely
responded with aggressive policy rate                   of financial market dislocation, the US             depend on how successful the health
cuts and conventional & unconventional                  Federal Reserve has led by example and              security measures will be in containing
measures to restore financial market                    demonstrated it will do whatever it takes,          the COVID-19 pandemic so as to allow
stability, smooth out US dollar funding                 to restore financial market confidence              normal economic activities to resume.
conditions and safe-guard their respective              and stability by keeping credit flowing.            On the optimistic view of things, with the
economies.                                              The Fed’s decisive actions are seen as              level of science, human ingenuity and
                                                        effective to prevent the financial market           sense of urgency, we believe a solution
Various governments have also deployed                  from becoming a compounding factor                  such as vaccine will be discovered in the
the extraordinary fiscal actions to tackle              to worsen the COVID-19 impact to the                foreseeable future. China already have
the negative impact brought about by the                real economy and US households.                     one in clinical trials. We will get over this
COVID-19 and more fiscal measures can                   That said, we do not think the Fed (and             eventually.
be expected. International organizations                many other central banks) will want to
like the International Monetary Fund                    push rates beyond zero, into negative               Given the immense challenge to the
(IMF) pledged it will massively step up                 territory. Interest rate policy is not suited       global economy, here are some significant
emergency finance and is ready to deploy                to combat the ill effects of COVID-19 on            points of note for our FX, Rates and
all of its US$1 trillion lending capacity to            the economy but the Fed looks poised to             Commodities forecasts.
the countries in need. After two earlier                do all it can to ward off a financial system
rounds of smaller measures, the US                      crisis before normalcy is restored.
congress is working through a massive
US$2 trillion relief package to support
workers and companies affected by the
COVID-19 pandemic.

                                                                                                                    Quarterly Global Outlook 2Q 2020
  EXECUTIVE SUMMARY                                                                                                                                        7
                                                                                                             UOB Global Economics & Markets Research
RATES STRATEGY                                  COMMODITIES STRATEGY                            SINGAPORE FOCUS
Hello ZIRP And QE Our Old Friends               No Escape From The Global                       More Easing Needed
All major central banks have now                Recession                                       To Aid Growth
floored their benchmark rates at zero.          Both Brent Crude Oil and LME Copper will        We reiterate our base case call for MAS
Money Market will thus stay low for the         likely stay weak in the coming quarter as       to ease policy to neutral, down from a
foreseeable future. In addition, it is worth    global demand and activity grind to a halt.     currently perceived +0.5% appreciation
noting that there is reluctance amongst         In 2Q, we see Brent crude oil challenging       slope. This is predicated on the recent
major central banks, particularly the US        the USD 20 / bbl lower bound, while LME         deterioration in economic fundamentals.
Federal Reserve and the Bank of England         Copper is likely to drop further towards        While not our base case, there is also a
to venture into negative rates.                 USD 4,000 / MT. Thereafter, the slow and        growing risk that MAS could re-centre the
                                                very long road to recovery starts towards       S$NEER band lower.
Rates are also unlikely to drop towards         the end of the year. But Brent is unlikely
zero because of rising credit and default       to make much headway above USD 35
risks. The on-going credit crunch has           / bbl unless Saudi Arabia and Russia
led to a repricing of credit risk across        reconciles. As for Copper, it will likely       INDONESIA FOCUS
the entire spectrum of fixed income             be capped below USD 5,000 / MT as               Review & Outlook For
instruments with a clear differentiation of     industrial activity stays weak.                 Domestic Banking Sector
the better credits and those with weaker                                                        Stagnant      growth      coupled      with
or troubled balance sheets.                     As for gold, the massive amount of              relatively low inflationary pressure had
                                                monetary policy easing and QE is a              prompted Bank Indonesia to continue
Sharply lower energy prices are also            godsend. Once the USD funding crunch            its accommodative monetary policy.
highly deflationary, and will likely trigger    dissipates, we can expect gold to race          Nonetheless, the positive impact of the
a new round of defaults and credit failure      higher. In fact, gold just got a recent boost   2019 rate cuts remained limited, given
in the months ahead. As such, we see            because the latest lockdown of key bullion      the previous 175 bps rate hikes in 2018
3M US Libor falling to 0.35% by end of          trading centers in London and NYC has           have not been fully transmitted to the real
the year. In the back end, sovereign            triggered a short covering of physical gold     economy and loan demand remained
bond yields will stay volatile because of       as transport links are cut. Overall, we see     weak. As the economic growth slowed to
massive fiscal spending to alleviate the        gold climbing steadily towards USD 1,800        5.02% (vs. 2018’s 5.17%), loan growth at
COVID-19 crisis with 10Y US Treasuries          by 1Q21.                                        the same time slowed significantly from
yield stabilizing at 1.3% by year end.                                                          11.8% in 2018 to just 6.1% in 2019.
                                                Hereafter is a brief synopsis of key Focus
                                                pieces as well as key FX and Rates views.       2020 will be more challenging for
                                                                                                Indonesia with the possibility of slower
FX STRATEGY                                                                                     economic growth due to the global
USD Unbeatable As Global                                                                        outbreak of COVID-19, especially if it will
Recession Fears                                 GLOBAL POLICY FOCUS                             be prolonged in a longer time frame. BI
Spark Scramble For Cash                         Fiscal And Monetary Stimulus                    expects credit growth now to be in the
Over the near term, the US Dollar will          To Combat COVID-19                              range of 6.0-8.0% for 2020, significantly
stay strong and dominant because of the         Since the pickup in severity of the             down from 9.0-11.0% previously while
funding crunch. Asian and EM currencies         COVID-19 pandemic, major central banks          third-party deposit growth is likely to be
will likely weaken further in the coming        and regional central banks in Asia have         around 6.0-8.0%..
two quarters as local economies plunge          responded with aggressive policy rate
headlong into recession.                        cuts, conventional and unconventional
                                                measures to restore financial market
The RMB risks yet another round of              stability, smooth out US dollar funding         GLOBAL FX
depreciation, given that its recent stability   conditions and safe-guard their respective      USD/JPY: Given near term USD
has pushed up its trade weighted value by       economies.                                      demand, USD/JPY could probe higher
quite a fair bit. Overall, we see USD/CNY                                                       to 112 in 2Q20 and 114 in 3Q20. After
climbing past 2019’s “Trade War” peak to        Various governments have also deployed          which, assuming a normalization of USD
a new high of 7.25 by 3Q. Similarly, USD/       the extraordinary fiscal actions to tackle      happens in 4Q20, we expect USD/JPY to
SGD will likely target 1.50 by 3Q.              the negative impact brought about by the        drift lower towards pre-COVID-19 levels,
                                                COVID-19 and more fiscal measures can           at 112 in 4Q20 and 109 in 1Q21.
Thereafter, once the recessionary               be expected.
contraction shock dissipates, the US
Dollar may pull back. The extent of RMB
and Asia FX recovery towards the end of
the year will depend on how fast region
wide growth can recover.

      Quarterly Global Outlook 2Q 2020
8                                                                                                                  EXECUTIVE SUMMARY
      UOB Global Economics & Markets Research
EUR/USD: The euro is likely to be pinned                                                    USD/KRW: While the COVID-19 outbreak
lower in the coming quarter, amidst the        ASIAN FX                                     is showing early signs of coming under
ongoing scramble for USD funding and           USD/CNY: Amid increasing signs that          control in South Korea, it will probably take
an inevitable recession in the euro area       the Chinese economy is slowly climbing       two quarters or so before the economy
(alongside US). Starting 2H20 when the         out of the COVID-19 inflicted malaise        embarks towards a path of normalcy. In
funding stress is more or less alleviated,     and assuming there is no second major        the interim, as the USD stays strong amid
we expect the USD to weaken anew. As           outbreak in China, we cautiously expect      the funding stress, further weakness in
such, our updated EUR/USD forecasts            a consumption-led rebound in 2H20, with      the KRW to 1,280 in 2Q20 and 1,300 in
are 1.05 in 2Q20, 1.08 in 3Q20, 1.10 in        GDP growth averaging 6.5% in both 3Q         3Q20 may be on the cards. After which,
4Q20 and 1.12 in 1Q21.                         and 4Q20. What this means is that after      assuming a Asia wide recovery takes
                                               the current bout of USD strength fizzles     root in 4Q20, USD/KRW may start to
GBP/USD: With strong USD demand                off, USD/CNY could well start ease lower     normalize lower, towards 1,250 in 4Q20
likely to persist in the coming months,        starting 4Q20. Our updated USD/CNY           and 1,220 in 1Q21.
GBP/USD will be pinned at multi-decade         forecasts are at 7.20 in 2Q20, 7.25 in
lows. Similar to EUR/USD, while we             3Q20, 7.10 in 4Q20 and 7.00 in 1Q21.         USD/MYR: While the Malaysian economy
expect a 2H20 recovery for GBP/USD, the                                                     may find some support from the fiscal and
trajectory is likely to more modest, further   USD/SGD:         In    a     challenging     monetary stimulus already announced,
weighed by uncertainties over the Brexit       macroeconomic backdrop, it is likely         the MYR continues to be weighed by the
transition. Overall, our updated GBP/USD       the S$NEER will stay pinned below the        relentless deleveraging from EM and the
forecasts are 1.15 in 2Q20, 1.17 in 3Q20,      midpoint in the coming few months. That      sharp and sudden collapse in crude oil
and 1.20 in both 4Q20 and 1Q21.                said, in keeping pace with expected          price. As such, we see further weakness
                                               weakness of most of its trading peers        of MYR to 4.50 in 2Q20 and 4.55 in 3Q20.
AUD/USD: A “phased reboot” of the              against the USD, we can expect a further     After which, a modest growth recovery in
Chinese economy means that demand              slide in SGD to 1.48 and 1.50, in 2Q and     2H20 as the COVID-19 outbreak shows
for Australia’s commodity exports stays        3Q20 respectively. Assuming a late-2020      signs of getting under control, USD/MYR
tepid. This leaves AUD/USD vulnerable          global recovery, USD/SGD could well          should eventually ease lower to 4.45 in
to further downside in the coming quarter      normalize lower towards 1.48 in 4Q20         4Q20 and 4.40 in 1Q21.
before a modest recovery in China in           and 1.45 in 1Q21. A risk to our updated
2H20 anchors a sentiment revival in the        set of forecasts is a more aggressive        USD/IDR: In the coming months, IDR
AUD/USD. Our updated FX forecasts are          easing by MAS via a one-off re-centring      remains under pressure on investors
0.56 in 2Q20, 0.58 in 3Q20, 0.60 in 4Q20       of the S$NEER lower. Such a move             adopt a flight-to-quality approach amid an
and 0.62 in 1Q21.                              would put upside risks to our USD/SGD        evolving COVID-19 outbreak, with USD/
                                               forecasts, especially in the immediate       IDR expected at 16,900 at 2Q20 and
NZD/USD: With global risk sentiment            quarter (2Q20).                              17,300 at 3Q20. At the same time, BI is
still weak, commodity-linked currencies                                                     likely to continue with its triple intervention
such as the NZD are expected to be on          USD/HKD: Given our forecasts of a lower      of spot IDR, domestic non-deliverable
the defensive. Add New Zealand’s tough         LIBOR relative to the HIBOR going forth,     IDR forward and bond markets in an effort
approach to stemming COVID-19, the             HKD may persist in the stronger halve of     to quell market volatility. Starting 4Q20,
resulting sharp economic slowdown puts         its trading band against USD, in a range     assuming that COVID-19 is brought
to rest any significant rebound in the NZD     of 7.75 – 7.80. Overall, we forecast USD/    under control globally, high real yields in
in the interim. Only when the current          HKD at 7.76 in 2Q20 and 7.78 in 3Q20         Indonesian sovereign bonds may appeal
scramble for USD alleviate (which we           before normalizing towards 7.80 starting     to investors again when markets stabilize,
estimate to be in 2H20) and a recovery         4Q20 as the HIBOR-LIBOR spread starts        spurring a recovery in the IDR. Our point
in risk sentiment, then there can some         to narrow.                                   forecasts are 16,500 at 4Q20 and 16,000
stabilization in the NZD/USD starting                                                       at 1Q21.
2H20. Our updated FX forecasts are 0.56        USD/TWD: While the TWD may still be
in 2Q20, 0.58 in 3Q20, 0.61 in 4Q20 and        biased lower in the next two quarters        USD/INR: With India’s growth and inflation
0.63 in 1Q21.                                  alongside other Asian FX, its weakness       still biased to the downside together with
                                               is likely to be limited to 30.60 and 31.00   a fragile global risk appetite still, further
                                               in 2Q and 3Q20 respectively. Towards         weakness in the INR is expected. As
                                               end-2020, as the region heals from the       such, we maintain a higher trajectory in
                                               pandemic, TWD is likely to outperform        USD/INR, steadily towards 77 in 2Q20,
                                               again, towards 30.50 in 4Q20 and 30.00       78 in 3Q20, 79 in 4Q20 and 80 in 1Q21.
                                               in 1Q21.

                                                                                                   Quarterly Global Outlook 2Q 2020
  EXECUTIVE SUMMARY                                                                                                                      9
                                                                                            UOB Global Economics & Markets Research
USD/THB: With travel confidence still          USD/VND: While USD strength may               USD/MMK: Of late, there has been
weak, together with continued outflows         persist in the near term, volatility in the   increasing calls from local business for
from Thai stock and bond markets, THB          USD/VND may be checked by SBV                 the Central Bank of Myanmar (CBM) to
may weaken further to 33.30 by 2Q20 and        willingness to draw on its reserves to        intervene in the FX markets to curb the
a further 34.00 by 3Q20 before a China-        calm the FX markets. Nonetheless,             MMK strength. As such, we see scope
led recovery in 2H20 spur a recovery to        the scramble for USD means the USD/           for the MMK to par some of its gains,
33.50 in 4Q20 and 33.00 in 1Q21.               VND are poised for new record highs at        weakening to 1,400 in 2Q20 and 1,420 in
                                               least for the next two quarters, towards      3Q20. Further out, as the rest of Asian FX
USD/PHP: Overall, we expect near term          23,900 and 24,200 in the 2Q and 3Q20          recovers, the MMK may gain alongside,
USD strength to lift USD/PHP higher in         respectively. After which, VND may            towards 1,400 in 4Q20 and 1,380 in
the next two quarters, to 52.0 in 2Q20         recover modestly alongside other Asian        1Q21.
and 52.5 in 3Q20. After which, the PHP         FX as the COVID-19 pandemic peaks,
should stabilize starting 4Q20 alongside       towards 24,000 in 4Q20 and 23,500 in
a recovery in risk appetite and we expect      1Q21.
USD/PHP to normalize lower towards
51.5 in 4Q20 and 50.0 in 1Q21.

     Quarterly Global Outlook 2Q 2020
10                                                                                                              EXECUTIVE SUMMARY
     UOB Global Economics & Markets Research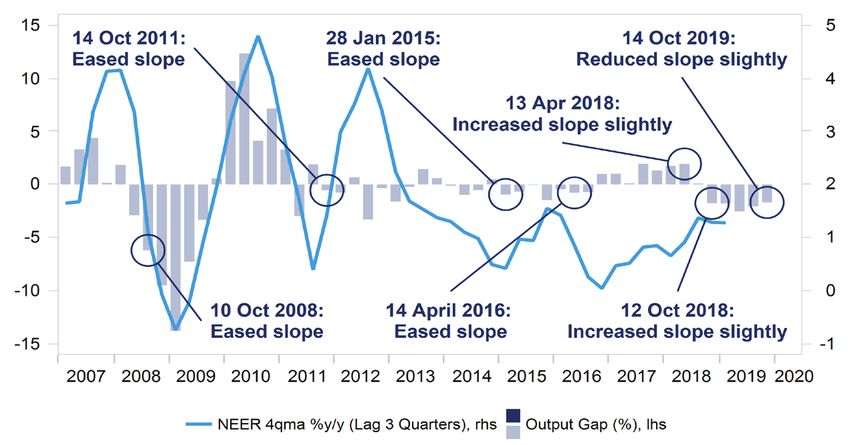
CENTRAL BANK OUTLOOK

              FED                            BOJ                           ECB                                BOE
          United States                        Japan                      Eurozone                       United Kingdom
    Next Meeting: 29 April           Next Meeting: 28 April       Next Meeting: 30 April             Next Meeting: 26 March
    Current:      0.25%              Current:      -0.10%         Current:      0.00%                Current:      0.10%
    YTD Change: -150bps              YTD Change: -                YTD Change: -                      YTD Change: -65bps

       0.25%         0.25%             -0.20%      -0.20%            0.00%       0.00%                  0.10%        0.10%
     End-2Q20F End-2020F              End-2Q20F End-2020F          End-2Q20F End-2020F               End-2Q20F End-2020F

   The Fed has demonstrated         We expect the BOJ will       We think the ECB has              While the BOE wants to
   it will do whatever it           ease via deepening its       stepped up meaningfully.          avoid having to cut interest
   takes to restore financial       negative policy call rate    The onus is now on various        rates below zero to avoid
   market stability, smooth         to -0.2%. We re-visit the    European governments to           hurting the banking system,
   out US dollar funding            notion that BOJ reassert     step up fiscal efforts. That      BOE Governor Andrew
   conditions     and       safe-   its easy monetary policy     said, the ECB could also          Bailey has indicated that
   guard the economy. So            position without changing    get even more creative            the BOE would continue
   more measures (including         the policy targets.          and expand the range of           to review that stance as
   unscheduled ones) can be                                      assets it purchases, by           events unfold. We think the
   expected. That said, we do                                    including, for example,           Bank Rate will remain at
   not think the Fed will want                                   equities, wholesale loans         0.10%.
   to push rates beyond zero,                                    and banks’ bonds, if the
   into negative territory.                                      need arises.

             RBA                            RBNZ                         PBOC                                 CBC
            Australia                     New Zealand                        China                            Taiwan

    Next Meeting: 07 April           Next Meeting: 13 May         Next Meeting: 20 April             Next Meeting: 18 June
    Current:      0.25%              Current:      0.25%          Current:      4.05%                Current:      1.125%
    YTD Change: -50bps               YTD Change: -75bps           YTD Change: -10bps                 YTD Change: -25bps

       0.25%        0.25%              0.25%       0.25%             3.80%       3.80%                 1.125%       1.125%
     End-2Q20F End-2020F             End-2Q20F End-2020F           End-2Q20F End-2020F               End-2Q20F End-2020F

   We think the RBA will not        The RBNZ has given           While the relatively modest       While further rate cuts are
   be increasing the OCR            forward          guidance,   cut to the Loan Prime             not ruled out as CBC said
   for at least three years. In     committing to keep the       Rate (LPR) in 1Q20 may            extra meetings before its
   terms of QE, RBA Governor        OCR at 0.25% for at least    hint at confidence that the       next scheduled meeting
   Phillip Lowe emphasized          12 months. Our view is       economy has stabilized,           in June could be held if
   that the Board did not take      that it will remain there    we still see room for             needed, we do not see
   the latest decisions lightly.    even longer. Depending on    monetary easing. Our              an urgency to load on
   However, we believe this is      how the current financial    forecast for further decline      more cuts especially given
   probably the start, and not      market situation develops,   in the 1Y LPR to 3.80%            CBC’s current view of
   the end, of measures the         more QE may be required      by end-2Q20 remains               a V-shaped recovery in
   RBA will eventually have to      down the road.               unchanged for now.                2H20. That could change if
   undertake to cushion the                                                                        there is a more protracted
   impact from COVID-19.                                                                           downturn.

                                                                                            Quarterly Global Outlook 2Q 2020
EXECUTIVE SUMMARY                                                                                                              11
                                                                                     UOB Global Economics & Markets Research
BOK                                    BSP                          MAS                          BNM
             South Korea                            Philippines                    Singapore                    Malaysia
      Next Meeting: 09 April                   Next Meeting: 21 May       Next Meeting: 30 March        Next Meeting: 05 May
      Current:      0.75%                      Current:      3.25%        Current:      0.5% slope      Current:      2.50%
      YTD Change: -50bps                       YTD Change: -75bps         YTD Change: 0% slope          YTD Change: -50bps

         0.50%        0.50%                     2.75%      2.75%               -               -          2.00%       2.00%
       End-2Q20F End-2020F                     End-2Q20F End-2020F         End-2Q20F End-2020F          End-2Q20F End-2020F

     With     the     benchmark           BSP will continue to take      We reiterate our base case    We      expect    further
     interest rate at new record          bold easing action to          call for MAS to ease policy   monetary support given
     low of 0.75%, we expect              safeguard domestic growth      to neutral, down from a       looming concerns over
     at most another 25bps cut            momentum          especially   currently perceived +0.5%     the impact of COVID-19
     in 2Q20 as BOK weighs                when a global recession        appreciation slope. This is   on the economy. Tumbling
     other options to support             already looks inevitable       predicated on the recent      global oil prices and
     the economy.                         following the widespread of    deterioration in economic     weaker demand are also
                                          the COVID-19 pandemic.         fundamentals. While not       expected to exert more
                                                                         our base case, there is       downward pressures on
                                                                         also a growing risk that      consumer price inflation,
                                                                         MAS could re-centre the       leaving room for BNM to
                                                                         S$NEER band lower.            ease monetary policy at
                                                                                                       the upcoming meeting.

                 BI                                  BOT                            SBV                           RBI
              Indonesia                              Thailand                      Vietnam                        India
      Next Meeting: 14 April               Next Meeting: 08 April         Next Meeting: -               Next Meeting: April
      Current:      4.50%                  Current:      0.75%            Current:      5.00%           Current:      5.15%
      YTD Change: -50bps                   YTD Change: -50bps             YTD Change: -100bps           YTD Change: -

        4.25%         4.25%                     0.50%      0.25%            5.00%        5.00%            4.65%       4.65%
       End-2Q20F End-2020F                     End-2Q20F End-2020F        End-2Q20F End-2020F           End-2Q20F End-2020F

     With COVID-19 risks rising           Although monetary policy       We expect SBV to pause        Policy-makers         would
     marked against muted                 space remains extremely        for now and assess how        have to re-evaluate on
     inflation risk and within the        limited at this juncture,      the lowered interest rates    their decision to cut
     target range of 2%-4%,               we pencil another 25bps        and loans restructuring       rates further, especially
     BI may cut policy rate by            rate cut in both 2Q20 and      could support business        when policy space is
     another 25bps to 4.25% at            3Q20, thus bringing BOT’s      activities.                   increasingly limited. RBI
     its April’s monetary policy          one-day repurchase rate to                                   cited that “there is policy
     meeting. It is likely to be          an unprecedented low of                                      space available for future
     the last rate cut for 2020,          0.25%.                                                       action” in 6 Feb monetary
     bringing the BI 7-Day                                                                             policy statement, in which
     Reverse Repo rate back to                                                                         we think another 50bps cut
     its lowest point before the                                                                       could occur in its upcoming
     175bps hike in 2018.                                                                              April meeting.

     Quarterly Global Outlook 2Q 2020
12                                                                                                           EXECUTIVE SUMMARY
     UOB Global Economics & Markets Research
Real GDP Growth Trajectory
y/y% change 2019 2020F 2021F 1Q19 2Q19 3Q19 4Q19 1Q20F 2Q20F 3Q20F 4Q20F
China 6.1 4.1 6.1 6.4 6.2 6.0 6.0 -3.4 5.7 6.5 6.5
Hong Kong -1.2 -3.0 3.0 0.7 0.4 -2.8 -2.9 -4.8 -5.0 -2.2 0.3
India 4.8 4.0 6.0 5.7 5.6 5.1 4.7 3.9 3.2 2.6 5.4
Indonesia 5.0 4.5 5.3 5.1 5.1 5.0 5.0 3.9 4.0 5.1 5.0
Japan 0.7 -2.5 0.5 0.8 0.9 1.7 -0.7 -1.3 -3.8 -3.5 -1.2
Malaysia 4.3 -3.5 4.3 4.5 4.9 4.4 3.6 -2.0 -11.5 -3.0 2.6
Philippines 5.9 1.0 5.5 5.6 5.5 6.0 6.4 2.5 -1.5 -0.5 3.4
Singapore 0.7 -2.5 1.5 1.0 0.2 0.7 1.0 -2.2 -3.9 -2.8 -1.2
South Korea 2.0 -1.0 3.5 1.7 2.0 2.0 2.3 -2.0 -3.2 -0.2 1.5
Taiwan 2.7 0.2 3.5 1.8 2.6 3.0 3.3 0.9 -2.0 -0.8 2.5
Thailand 2.4 -5.4 3.0 2.9 2.4 2.6 1.6 -11.4 -12.5 -0.8 3.0
Vietnam 7.0 5.8 6.6 6.9 6.7 7.5 7.0 6.0 4.5 5.5 7.0
Australia 1.8 -1.8 2.0 1.7 1.6 1.8 2.2 1.2 -4.6 -2.8 -0.9
Eurozone 1.2 -5.0 2.5 1.3 1.2 1.3 1.0 0.8 -9.6 -6.8 -4.5
New Zealand 2.2 -1.0 2.5 2.9 2.2 2.3 1.6 1.4 -3.2 -1.7 -0.3
United Kingdom 1.4 -4.8 2.3 2.1 1.3 1.2 1.1 0.8 -9.5 -6.1 -4.2
United States (q/q SAAR) 2.3 -4.1 1.4 3.1 2.0 2.1 2.1 -2.0 -26.8 6.1 10.4
Note that India’s annual growth refers to its fiscal year print
Source: CEIC, UOB Global Economics & Markets Research
Heat Map Of Key Macro Indicators In The Region
Macroeconomic Indicator
(Latest Data)
Indonesia Malaysia Philippines Thailand Vietnam Singapore China India
Real GDP Growth (%)
Manufacturing PMI (Index)
Foreign Direct Investment (Annual, USD bn)
Merchandise Trade Balance (USD bn)
Current Account (Annual, % of GDP)
Fiscal Balance (Annual, % of GDP)
Unemployment Rate (%)
Inflation (%)
Color Code (Definition) Weakest Strongest
Source: Bloomberg, UOB Global Economics & Markets Research
Quarterly Global Outlook 2Q 2020
13
UOB Global Economics & Markets ResearchFORECASTS
FX, Interest Rate & Commodities
FX 26 Mar 20 2Q20F 3Q20F 4Q20F 1Q21F RATES 26 Mar 20 2Q20F 3Q20F 4Q20F 1Q21F
USD/JPY 111 112 114 112 109 US Fed Funds Rate 0.25 0.25 0.25 0.25 0.25
EUR/USD 1.09 1.05 1.08 1.10 1.12 USD 3M LIBOR 1.23 0.95 0.65 0.35 0.35
GBP/USD 1.18 1.15 1.17 1.20 1.20 US 10Y Treasuries Yield 0.79 1.00 1.15 1.30 1.50
JPY Policy Rate -0.10 -0.20 -0.20 -0.20 -0.20
AUD/USD 0.59 0.56 0.58 0.60 0.62
EUR Refinancing Rate 0.00 0.00 0.00 0.00 0.00
NZD/USD 0.58 0.56 0.58 0.61 0.63
GBP Repo Rate 0.10 0.10 0.10 0.10 0.10
DXY 100.8 103.9 102.1 100.3 98.7
AUD Official Cash Rate 0.25 0.25 0.25 0.25 0.25
USD/CNY 7.11 7.20 7.25 7.10 7.00 NZD Official Cash Rate 0.25 0.25 0.25 0.25 0.25
USD/HKD 7.75 7.76 7.78 7.80 7.80
CNY 1Y Loan Prime Rate 4.05 3.80 3.80 3.80 3.80
USD/TWD 30.26 30.60 31.00 30.50 30.00 HKD Base Rate 1.39 0.86 0.86 0.86 0.86
USD/KRW 1,231 1,280 1,300 1,250 1,220 TWD Official Discount Rate 1.13 1.13 1.13 1.13 1.13
USD/PHP 51.12 52.00 52.50 51.50 50.00 KRW Base Rate 0.75 0.50 0.50 0.50 0.50
PHP O/N Reverse Repo 3.25 2.75 2.75 2.75 2.75
USD/MYR 4.36 4.50 4.55 4.45 4.40
SGD 3M SIBOR 1.02 1.00 0.85 0.80 0.75
USD/IDR 16,268 16,900 17,300 16,500 16,000
SGD 3M SOR 0.89 0.85 0.70 0.50 0.50
USD/THB 32.82 33.30 34.00 33.50 33.00
SGD 10Y SGS 1.42 1.30 1.35 1.50 1.60
USD/MMK 1,396 1,400 1,420 1,400 1,380
MYR O/N Policy Rate 2.50 2.00 2.00 2.00 2.00
USD/VND 23,636 23,900 24,200 24,000 23,500
IDR 7D Reverse Repo 4.50 4.25 4.25 4.25 4.25
USD/INR 75.28 77.00 78.00 79.00 80.00
THB 1D Repo 0.75 0.50 0.25 0.25 0.25
USD/SGD 1.45 1.48 1.50 1.48 1.45 VND Refinancing Rate 5.00 5.00 5.00 5.00 5.00
EUR/SGD 1.58 1.55 1.62 1.63 1.62 INR Repo Rate 5.15 4.65 4.65 4.65 4.65
GBP/SGD 1.71 1.70 1.76 1.78 1.74
COMMODITIES 26 Mar 20 2Q20F 3Q20F 4Q20F 1Q21F
AUD/SGD 0.86 0.83 0.87 0.89 0.90
Gold (USD/oz) 1,601 1,650 1,700 1,750 1,800
SGD/MYR 3.01 3.04 3.03 3.01 3.03
Brent Crude Oil (USD/bbl) 27 20 25 30 35
SGD/CNY 4.91 4.86 4.83 4.80 4.83
JPY/SGDx100 1.31 1.32 1.32 1.32 1.33 LME Copper (USD/mt) 4,855 4,000 4,300 4,600 5,000
Quarterly Global Outlook 2Q 2020
14
UOB Global Economics & Markets ResearchGLOBAL POLICY FOCUS
Fiscal And Monetary Stimulus
To Combat COVID-19
Since the pickup in severity of the COVID-19 pandemic, major central banks and regional central banks in Asia have responded
with aggressive policy rate cuts, conventional and unconventional measures to restore financial market stability, smooth out US
dollar funding conditions and safe-guard their respective economies.
Various governments have also deployed the extraordinary fiscal actions to tackle the negative impact brought about by the
COVID-19 and more fiscal measures can be expected.
Fiscal & Central Bank Measures Announced To Mitigate The Impact From COVID-19
Economies
(As of 26 Mar 2020)
Plans for more targeted tax and fee cuts to help the micro, small and medium-sized businesses; increase
in local government special bond quota
PBoC cut the 1Y Medium-term Lending Facility rate by 10bps to 3.15%; the 1Y Loan Prime Rate (LPR)
CHINA lowered by 10bps to 4.05% in Feb, unchanged in Mar.
RMB300 bn targeted relending fund to provide low interest loans.
As of 13 Mar, finance ministries at all levels of government have issued CNY116.9 bn (US$17 bn or 0.1%
of GDP) in subsidies for prevention and control of the virus.
HKD120bn (US$15.4bn or 4.2% of GDP) stimulus package.
HONG KONG
Another HK$30bn Anti-Epidemic Fund and a HK$10bn relief package were announced prior to the budget.
Government’s total fiscal stimulus (1 and 2) amounted to IDR 33.4tn (0.21% of GDP).
INDONESIA Bank Indonesia (BI) cut benchmark rate by 25bps to 4.75% in Feb.
BI and the Financial Services Authority (OJK) have announced measures to stabilize IDR.
Government’s economic stimulus measures worth MYR62.0bn or 4.0% of GDP
BNM has allocated MYR3.3bn of financing facilities to help sustain SMEs’ business operations, safeguard
jobs and encourage domestic investments
MALAYSIA BNM cut OPR to 2.50% (-50bps YTD), a 10-year low.
BNM cuts Statutory Reserve Requirement (SRR) ratio by 100bps to 2.00%, every 100bps cut in the SRR is
estimated to release about MYR14.8bn into the system
Automatic loan repayment deferment of six months for non-arrear household and SME loans.
PHP27.1bn (USD525m or 0.1% of GDP) economic stimulus package
BSP cut overnight reverse repurchase rate by a total 75bps YTD to 3.25%
PHILIPPINES BSP cut reserve requirement ratio by 200bps YTD to 12.0% for universal and commercial banks
BSP will buy PHP300bn (USD5.9bn) worth of government securities under a repurchase agreement with a
maximum repayment period of six months
Government COVID-19 stimulus of SGD5.6bn on 18 Feb and a supplementary budget of SGD48bn on 26
Mar to support business and households (total of SGD55bn or 11% of GDP).
S$77mn Point-to-Point Support Package to help taxi and Private Hire Car operators.
SINGAPORE
S$800mn has been earmarked to support the frontline agencies to fight COVID-19
Supplementary budget to tackle COVID-19 to be announced on 26 Mar
MAS brings forward Monetary policy decision to 30 Mar 2020
Government stimulus of KRW11.7 tn (US$9.8 bn or 0.6% of GDP)
KRW50tn (US$39bn) of financial support package to help small businesses with emergency funding, loans
guarantee and deferment of loans repayments.
SOUTH KOREA
Bond and equity markets stabilization funds.
BOK announced QE on 26 Mar where the central bank will supply “unlimited” liquidity to markets for 3
months, from Apr to Jun 2020.
Quarterly Global Outlook 2Q 2020
GLOBAL POLICY FOCUS 15
UOB Global Economics & Markets ResearchFiscal & Central Bank Measures Announced To Mitigate The Impact From COVID-19
Economies
(As of 26 Mar 2020)
First stimulus package of NT$60 bn (US$2bn or 0.3% of GDP). Second stimulus package of NT40bn
(US$1.33 bn) is being planned.
TAIWAN
CBC cut interest rate by 25bps to new record low at 1.125%, provides liquidity fund of NT$200bn to banks.
National Stabilisation Fund available to support stock market.
Bank of Thailand cut its 1-D repurchase rate by 25bp to a record low of 0.75% in Mar 2020.
Up to 80% of Fiscal 2020 budget will be ready for disbursement over next 6 months starting Feb 2020.
THAILAND
Cabinet had approved a stimulus package of THB 400 billion (US$12.7 billion, 2.4% of GDP) to combat the
COVID-19 pandemic.
Fiscal stimulus package totaling AUD17.6bn (about 1% of GDP) on 12 March
Second package of AUD66bn (around 2.5% of GDP) on 22 Mar and focuses more on 2020-2021.
RBA cut the official cash rate (OCR) by 25bps to then a new all-time low of 0.50% on 3 Mar.
RBA made an emergency rate cut, dropping the OCR by 25bps to 0.25%, record low in an unscheduled
AUSTRALIA meeting on 19 Mar.
RBA said starting 20 Mar, it will buy as many government bonds it needed to ensure the yield on 3-year
government bonds stays low and around 0.25% (QE).
RBA will set up a AUD90bn term funding facility for commercial banks to help small and medium-sized
businesses.
Government unveiled a NZD12.1bn support package, worth 4% of GDP on 17 Mar.
RBNZ delivered an emergency cut to its official cash rate (OCR) by 75bps to 0.25% in an unscheduled
NEW ZEALAND meeting on 16 Mar.
RBNZ announced it’s first QE on 23 Mar, as it will purchase NZD30bn worth of NZGBs across the yield
curve in the next 12 months.
PM Abe launched a panel to propose a stimulus package likely in April to support the economy from
COVID-19 hit. Reports suggest JPY30tn emergency economic package is in the works, well above the
JPY15tn package during the 2008 GFC.
BOJ increased its risky asset purchases by doubling its purchases of exchange-traded funds (ETFs) and
J-REITS to annualized paces of JPY12 tn and JPY180bn in an unscheduled meeting on 16 Mar.
BOJ will also increase the upper limit to buy commercial paper (CP) and corporate bonds by JPY2 trillion
JAPAN
to the amounts outstanding of about JPY3.2 trillion and JPY4.2 trillion, with the additional buying continuing
till End-Sep 2020
BOJ together with the central banks of Canada (BOC), UK (BOE), Eurozone (ECB), Switzerland (SNB) and
the US (Fed) will provide ample US dollar funding.
BOJ also introduced the Special Funds-Supplying Operations to Facilitate Corporate Financing regarding
the Novel Coronavirus (COVID-19).
US Congress approved a US$8.3bn emergency funding package (0.04% of GDP) to combat the spread of
the COVID-19 on 6 Mar.
US Congress passed second stimulus package, the Families First Coronavirus Response Act) on 18 Mar
said to be US$300-500bn (1.4%-2.3% of GDP).
US Senate passed a third stimulus package on 25 Mar, worth US$2tn (9.3% of GDP) including tax rebates,
4 months expanded unemployment benefits, various business tax-relief provisions, a US$500bn major
corporate liquidity program through the Fed, US$367bn small business rescue package. This is the biggest
stimulus ever passed by Congress. (The House most likely to pass it on 27 Mar)
House Speaker Pelosi said House Democrats would unveil yet another latest (3rd) House package which
would reportedly cost more than US$2.5 trillion
Fed Reserve delivered emergency 50bps rate cut on 3 Mar, and another emergency rate cut of 100bps to
0.0-0.25% on 16 Mar, back to the GFC low.
US Fed encouraged banks to tap on its existing discount window by lowering the primary credit rate by 150bps
to 0.25% and lengthened the term of loans to 90 days (with effect from 16 Mar 2020),
Fed encouraged banks to use their capital and liquidity buffers, and also reduced reserve requirement
ratios to 0% with effect from 26 Mar 2020.
Fed also announced coordinated action with the major central banks to enhance the provision of US dollar
liquidity on 16 Mar and this was extended to other central banks on 20 Mar
New York Fed will increase size of repo operations offered through mid-April by US$1.5tn and added
another US$500bn, totaling US$2tn.
Fed unveiled set of unprecedented measures on 23 Mar including unlimited QE, US$300bn new credit
programs for employers, consumers and businesses.
Fed widened money market mutual fund facility to include variable-rate demand notes and bank certificates
of deposit.
Daily and term repo rates to be reset to offering rate of 0.0%.
Quarterly Global Outlook 2Q 2020
16 GLOBAL POLICY FOCUS
UOB Global Economics & Markets ResearchFiscal & Central Bank Measures Announced To Mitigate The Impact From COVID-19
Economies
(As of 26 Mar 2020)
Government announced GBP30bn of fiscal stimulus on 11 Mar. Pledged to spend GBP600bn by 2025 on a
huge infrastructure program.
Government unveiled another huge GBP330bn package of loan guarantees (15% of GDP) and up to
GBP20bn of financial support for firms in 2020, on 17 Mar.
Bank of England (BOE) lowered its Bank Rate by 50bps to a record-low of 0.25% in an unscheduled
meeting on 11 Mar.
BOE introduced a new Term Funding scheme with additional incentives for Small and Medium-sized
Enterprises (TFSME), financed by the issuance of central bank reserves. The TFSME is expected to
UK provide GBP100bn or more of term funding.
BOE’s Financial Policy Committee (FPC) also reduced the countercyclical capital buffer (CCyB) rate on
banks’ exposure to UK borrowers from 1% to 0%, for at least a year. This will release up to GBP190bn of
bank lending to businesses, equivalent to 13 times banks’ net lending to businesses in 2019.
BOE voted unanimously to cut its Bank Rate by 15bps from 0.25% to 0.10%, a record-low, in an
unscheduled meeting on 19 Mar.
BOE voted unanimously to increase the BOE’s bond-buying program to GBP645bn (30% of GDP), up by
GBP200bn.
BOE announced it was increasing the size of its Term Funding Scheme, targeted at smaller businesses.
Euro area governments mobilised around 1% of their GDP (EUR120bn) to fight against the economic
fallout from COVID-19 on 16 Mar.
Euro area governments offered liquidity facilities of at least 10% of GDP, including public guarantee
schemes and deferred tax payments.
European Commission promised to reallocate unspent structural funds amounting to EUR37bn to support
health systems, SMEs, affected sectors and workers.
European Investment Bank, backed by the Commission, will mobilise EUR8bn in lending for SMEs, with
plans to increase to EUR20bn.
EU raised the amount of money in the corona investment fund to EUR37bn (0.3% of Eurozone’s GDP) on
13 Mar.
EUROZONE
European Central Bank (ECB) introduced additional longer-term refinancing operations (LTROs) and the
maximum amounts bank can draw on the TLTRO III also raised to 50% of their stock of outstanding eligible
loans as of end-February in scheduled meeting on 12 Mar.
ECB allowed looser collateral conditions so more bank capital can be deployed, potentially between
EUR600bn and EUR800bn available in capital relief.
ECB announced an additional “envelope” of EUR120bn of net asset purchases until end-2020, equivalent
to EUR13.3bn in additional QE a month, on top of its existing commitment to buy EUR20bn a month.
ECB announced in an unscheduled meeting on 18 Mar a temporary EUR750bn (7% of GDP) asset
purchase programme - Pandemic Emergency Purchase Programme (PEPP) which will last until the end of
2020, and will target both public- and private-sector assets.
Government sets up a C$10 billion credit facility to lend money to businesses under stress as a result of
the spreading COVID-19 pandemic.
Government announced a C$27 billion aid package for the people and businesses most affected by
CANADA
COVID-19 and C$55 billion in tax deferrals.
Bank of Canada announces emergency rate cut on 13 Mar to lower key overnight interest rate by 50bps to
0.75% from 1.25%.
Germany announced its plan on a new EUR500bn bailout fund to rescue companies (around 10% of GDP)
on 22 Mar.
GERMANY
German government (20 Mar) reportedly looking at issuing net new debt of about EUR350bn to finance
stimulus measures amid the COVID-19 crisis, including supplementary budget of about EUR150bn.
Government detailed EUR45bn (2% of GDP) of emergency measures on 17 Mar.
FRANCE Government to guarantee EUR300bn of bank loans to businesses, while Eurozone members had
collectively offered EUR1tn in such national guarantees.
Government agreed on a EUR25bn (1.4% of GDP) rescue package, raised from EUR7.5bn previously on
ITALY
16 Mar.
PM Pedro Sánchez announced a EUR200bn (0.2% of GDP) stimulus, of which EUR117bn will come from
SPAIN
the public sector on 17 Mar.
Quarterly Global Outlook 2Q 2020
GLOBAL POLICY FOCUS 17
UOB Global Economics & Markets ResearchSINGAPORE FOCUS
Singapore MAS Preview:
More Easing Needed To Aid Growth
The Monetary Authority of Singapore We identify three drivers that could We reiterate our base case call for
(MAS) is slated to announce its lead to another round of monetary MAS to ease policy to neutral, down
monetary policy decision on 30 March easing in the upcoming meeting, seen from a currently perceived +0.5%
2020. MAS previously reduced its from (1) lower interest rates globally, appreciation slope. This is predicated
S$NEER slope by an estimated 0.5% (2) the softness in the S$NEER below on the recent deterioration in economic
in Oct 2019, while keeping other policy its mid-point and (3) a likelihood of a fundamentals. While not our base
parameters unchanged. persistent negative output gap in 2020. case, there is also a growing risk that
MAS could re-centre the S$NEER
band lower.
Quarterly Global Outlook 2Q 2020
18 SINGAPORE FOCUS
UOB Global Economics & Markets ResearchThree Drivers That Could
Signal Monetary Easing Chart 1: Benchmark Rate Cuts Seen Year-To-Date
Given that the objective for the Monetary Authority Source: Macrobond, UOB Global Economics & Markets Research
of Singapore is to “maintain price stability
conducive to sustained growth of the economy”,
we see three drivers that could signal a potential
MAS monetary easing in the upcoming meeting
on 30 March 2020, namely from the (1) lower
interest rates globally, (2) the softness in the
S$NEER below its mid-point and (3) a likelihood
of a persistent negative output gap in 2020.
First, MAS may see a growing impetus to ease
monetary policy conditions in tandem with lower
interest rates globally. Since the start of this
year, the US Federal Reserve has reduced its
Federal Funds Target Rate (FFTR) by a total
of 150 basis points to a range of 0.0% - 0.25%.
Other developed central banks that cut rates also
included RBNZ (-75bps since YTD), BOE (-65bps) Chart 2: S$NEER Has Softened To Below Mid-Point In March 2020
and RBA (-50bps). Over in Asia, Singapore’s key Source: Macrobond, UOB Global Economics & Markets Research
trading partners including Hong Kong (HKMA:
-114bps), Philippines (BSP: -75bps), Malaysia
(BNM: -50bps), Thailand (BOT: -50bps) and
Indonesia (BI: -50bps) have also cut rates since
the start of 2020.
Second, the softness in the Singapore Dollar
Nominal Effective Exchange Rate (S$NEER)
in the recent weeks below its mid-point reflects
a relative pullback in investor risk appetite on
concerns over the COVID-19 outbreak and
falling oil prices. As we flagged in our previous
MAS meeting preview report, we had observed
that a majority of easing moves were done when
the S$NEER were below the estimated mid-point
(specifically in October 2008, October 2011,
January 2015, October 2015 and April 2016).
The recent softening of the S$NEER below mid-
point could also suggest that market players have
guided the S$NEER lower in anticipation of such
monetary easing move in the next policy meeting.
According to our in-house S$NEER model, the
S$NEER has weakened to -0.4% from its mid-
point at the time of writing (24 March 2020), down
from a strong +1.8% from mid-point at the end of
January 2020.
Quarterly Global Outlook 2Q 2020
SINGAPORE FOCUS 19
UOB Global Economics & Markets ResearchNote that the fall in the S$NEER also coincided
with the MAS statement on 5th February which Chart 3: Negative Output Gap Persists, May Worsen Into 1Q20
cited that there is “sufficient room within the policy Source: Bloomberg, UOB Global Economics & Markets Research
band to accommodate an easing of the S$NEER
in line with the weakening economic conditions”.
With the fall of the S$NEER in the recent weeks,
the room for further weakness in the S$NEER is
comparatively limited versus when the S$NEER
is “fluctuating near the upper bound of the policy
band” after October 2019. As such, an easing of
monetary policy may be on the cards on 30 March
2020, in order to allow the S$NEER to weaken
further in line with the weaker economic outlook.
Third, the expected growth headwinds into 2020
should suggest a persistent negative output gap
for Singapore in the year ahead. Singapore’s
output gap, defined as the difference between the
actual GDP growth and potential GDP growth,
persisted in negative territory for five quarters into MAS Likely To Ease Policy Slope To Neutral
4Q19. A negative output gap also indicates the The negative output gap which is expected to worsen into the start of 2020 will
presence of growth slack in the economy, and likely persuade the MAS to ease monetary policy at the upcoming meeting.
that inflation will likely be kept in check as well. We reiterate our base case call for MAS to ease policy to neutral, down
from a currently perceived +0.5% appreciation slope, while keeping the
On the same note, given that the MAS monetary width of the policy band and the level at which it is centred unchanged.
policy is forward looking and focused on the This is predicated on the recent deterioration in Singapore-centric economic
medium term economic outlook, a monetary fundamentals, including the contraction in manufacturing PMI (Feb 2020) and
easing move on 30 March 2020 may indicate retail sales (Jan 2020) on the back of rising global recession risk. While not our
policy-makers’ reduced optimism on Singapore’s base case, there is also a growing risk that MAS could re-centre the S$NEER
economic outlook into the four to six quarters band lower as a signal that a looser monetary policy is needed to cushion both
ahead. The MAS noted that their econometric growth and inflation risks this year.
models suggest that the “peak impact of a change
in exchange rate policy on the economy occurs
only after four to six quarters,” which is then
cited as the main reason why monetary policy
formulation needs to be forward-looking1.
1 Monetary Authority of Singapore, How does MAS formulate
its monetary policy?, Oct 2018
Quarterly Global Outlook 2Q 2020
20 SINGAPORE FOCUS
UOB Global Economics & Markets ResearchINDONESIA FOCUS
Review & Outlook For
Domestic Banking Sector
2019 Review 2020 Outlook
A stagnant growth coupled with relatively low The year of 2020 will be more challenging for
inflationary pressure had prompted Bank Indonesia Indonesia as with the possibility of slower economic
to continue its accommodative monetary policy. growth due to the global outbreak of COVID-19,
Nonetheless, the positive impact of the 2019 rate especially if it will be prolonged in a longer time
cuts remained limited, given the previous 175 bps frame.
rate hikes in 2018 have not been fully transmitted
to the real economy and loan demand remained BI expects credit growth now to be in the range
weak. As the economic growth slowed to 5.02% of 6.0-8.0% for 2020, significantly down from 9.0-
(vs. 2018’s 5.17%), loan growth at the same time 11.0% previously while third-party deposit growth is
slowed significantly from 11.8% in 2018 to just 6.1% likely to be around 6.0-8.0%.
last year.
Quarterly Global Outlook 2Q 2020
INDONESIA FOCUS 21
UOB Global Economics & Markets Research2019 Review
Stagnant growth coupled with relatively low inflationary pressure Meanwhile, Indonesia’s processing/manufacturing and wholesale
had prompted Bank Indonesia to continue its accommodative & retail sectors, which accounts for over 30% of GDP, underwent
monetary policy and take more dovish policy stance. BI lowered a sharp deceleration in loan growth (Figure 3). The processing/
its benchmark rate by a total of 100bps to 5.00% throughout 2019 manufacturing loan growth eased from 9.1% in 2018 to 3.6% in
(Figure 1). Nonetheless, the positive impact of the 2019 rate 2019, while the wholesale & retail trade loan growth decreased
cuts remained limited, given the previous 175 bps rate hikes in from 9.4% to 3.7%. Only sectors with relatively lower contribution
2018 have not been fully transmitted to the real economy and to GDP (i.e. electricity, gas and water, fishery, and social services)
loan demand remained weak. As the economic growth slowed managed to record higher loan growth as compared to their
to 5.02% in 2019 (vs. 2018’s 5.17%), loan growth at the same previous period.
time slowed significantly from 11.8% to just 6.1% with the total
outstanding loan amounting to IDR 5,617tr (Figure 2).
Figure 1. BI 7D Reverse Repo Rate (%) Figure 2. Loan Growth (%-y/y)
Source: Bloomberg, UOB Global Economics & Markets Research Source: Financial Services Authority (OJK), UOB Global Economics & Markets Research
9.00 14.0
8.00 12.0
11.8
7.00 10.0
8.2
6.00 8.0
5.00 6.0
6.1
4.00 4.0
'08 '10 '12 '14 '16 '18 '20 2016 2017 2018 2019
Figure 3. Loan Growth By Sector (%-y/y)
Source: Financial Services Authority (OJK), UOB Global Economics & Markets Research
100.0% Total
27.8% Loans to Non Industrial (Household)
19.9% Wholesale and Retail Trade
16.6% Procesing Industry
9.2% Real Estate & Business Services
6.8% Agricultures & Fishery
6.4% Construction
4.4% Transportation, Warehousing
and Communications
3.5% Electricity, Gas and Water
2.9% Social Services
2.4% Mining and Quarrying
Share Per -10.0 -5.0 0.0 5.0 10.0 15.0 20.0 25.0
Total Loan
2017 2018 2019
Quarterly Global Outlook 2Q 2020
22 INDONESIA FOCUS
UOB Global Economics & Markets ResearchDespite the general elections in 2019, investment loan growth
(accounting for 26.4% of total outstanding loan) remained strong, Figure 4. Loan Growth By Type (%-y/y)
rising from 10.9% in 2018 to 13.2% in 2019 (Figure 4). This was Source: Financial Services Authority (OJK), UOB Global Economics & Markets Research
however not observed in both consumption and working capital
20.0
loan growth. Consumption loan (27.8% of total outstanding loan)
grew moderately by 5.8% (vs. 10.4% previously), while working
capital loan growth (45.9% of total outstanding loan) decelerated 16.0
13.2
to 2.5% from 13.0%. From another perspective, the loan growth
of Book 4 and Book 3 banks (which accounted for 85.3% of total 12.0
outstanding loan) slowed to 8.4% and 2.1% respectively, from
12.5% and 15.5% (Figure 5 & 6). Meanwhile, non-performing loan 5.8 8.0
ratio stayed at 2.5%, indicating manageable asset quality.
4.0
2.5
0.0
2016 2017 2018 2019
Working Capital (45.9%) Investments (26.4%)
Consumption (27.8%)
Figure 5. Book 4 Loan Growth (%-y/y) Figure 6. Book 3 Loan Growth (%-y/y)
Source: Financial Services Authority (OJK), UOB Global Economics & Markets Research Source: Financial Services Authority (OJK), UOB Global Economics & Markets Research
20.0 20.0
18.0
15.5
16.0
14.0
15.0
12.0
10.0
12.5 8.0
10.0
6.0
4.0
8.4
2.0
5.0 2.1 0.0
2018 2019 2018 2019
Book 4 (Core Capital: > IDR 30tr); Book 3 (Core Capital: > IDR 5tr, < IDR 30 tr)
Although loan growth underperformed as compared to last
year’s performance, deposit growth remained relatively stable at Figure 7. Deposit Growth (%-y/y)
6.5% (vs. 6.4% previously) or amounted to IDR 5,999tr (Figure Source: Financial Services Authority (OJK), UOB Global Economics & Markets Research
7). This is supported by Book 4 deposits, which accounts for
56.2% of total bank wide deposit and grew 8.3% (vs. 7.6% 12.0
previously). Consequently, the level of loan-to-deposit ratio (LDR)
was maintained at 94.4% in 2019 vs. 2018’s 94.8% (Figure 8). 10.0
9.4
This, accompanied by the central bank’s 100bps cut in reserve
requirement ratio to 5.50% in 2019, has helped improve interbank
8.0
liquidity, which was tightened during 2018’s rate hike cycle. The
overnight interbank rate spread over the risk-free rate – BI’s
standing facility (FASBI) rate – has slightly descended, while the 6.0
6.4 6.5
interbank excess liquidity measure has somewhat risen, albeit still
below the pre-rate hiking cycle level (Figure 9). As the liquidity 4.0
somewhat loosened and loan demand remained relatively weak,
banks’ asset rotated out of loans into debt securities as it rose by
2.0
7.5% in 2019 from a contraction of 9.0% in 2018 (Figure 10). 2016 2017 2018 2019
Quarterly Global Outlook 2Q 2020
INDONESIA FOCUS 23
UOB Global Economics & Markets ResearchYou can also read