New ZealaNd Economic and Financial
←
→
Page content transcription
If your browser does not render page correctly, please read the page content below
New Zealand
                               Economic and Financial
                                  Overview 2015

Aerial view of Mount Cook and the Southern Alps.
© Andris Apse

  ISSN: 1173-2334 (Print)
  ISSN: 1178-749X (Online)
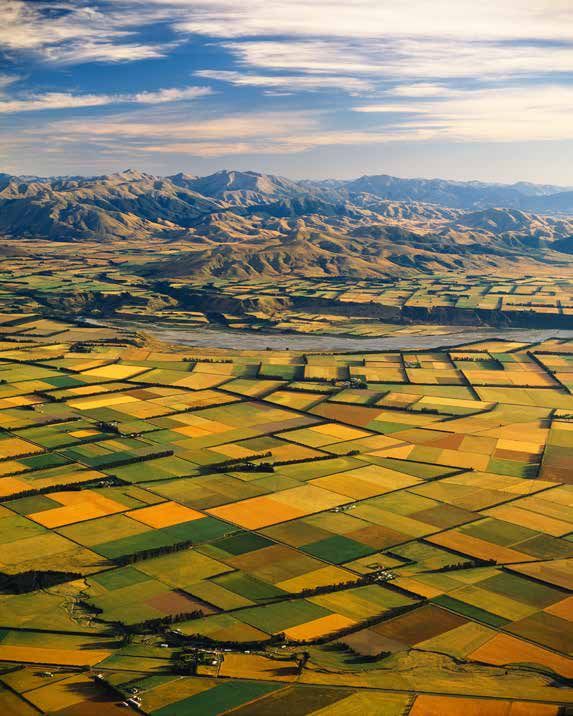
Canterbury Plains stretching towards the foothills of the Southern Alps.
© Andris Apse

                                                       2
CO NTENTS

5   New Zealand: An Overview
5   Area and Population
5   Form of Government
6   Social Framework
6   The Treaty of Waitangi
6   Foreign Relations and External Trade
7   Membership in International Economic Organisations
7   Environmental Policy
8   Selected Economic and Financial Data
9   Economic and Fiscal Forecasts
11 Economic Overview
11 Introduction
11 Recent Economic Performance and Outlook
12 Monetary Policy
12 Fiscal Policy
13 Public Debt
13 National Accounts
15 Labour Markets
16 Prices and Costs
17 Industrial Structure and Principal Economic Sectors
17 Primary Industries
20 Manufacturing
20 Service Industries
25 External Sector
25 External Trade
26 Composition of Merchandise Exports and Imports
28 Geographic Distribution of External Trade
29 Principal Trading Partners
30 Foreign Investment Policy
30 Balance of Payments
32 Foreign-Exchange Rates and Overseas Reserves
35 Banking and Business Environment
35 Supervision of the Financial Sector
36 Business Law Environment
39 Monetary Policy                                       Further information
39 Objectives                                            Unless otherwise specified, all monetary units
                                                         in this Overview are New Zealand dollars.
39 Implementation                                        The mid-point rate on 27 February 2015 was
40 Interest Rates and Money and Credit Aggregates        NZ$1 = US$0.7531.

41 Public Finance and Fiscal Policy                      The fiscal year of the Government of
                                                         New Zealand ends on 30 June.
41 Public Finance
                                                         Spelling and punctuation conform to usage in
43 Current Fiscal Position and 2014/15 Budget            New Zealand and have not been adjusted to
44 Taxation                                              conform to usage in the United States or any
                                                         particular external market.
47 Government Enterprises
                                                         Where figures in tables have been rounded,
47 State-Owned Enterprises and Crown Entities            totals listed may not equal the sum of the
                                                         figures.
47 Performance of Government Enterprises
                                                         In tables, NA = Not Available.
50 Public Debt
50 Debt Management Objectives
50 Debt Record
50 Summary of Direct Public Debt

                                                   3
● Whangarei

                                                       Auckland    ●

                                                                Hamilton   ●             ● Tauranga

                                                                               Rotorua   ●

                                                                                    ● Taupo       Gisbourne   ●
                                          New Plymouth      ●

                                                                                      Napier  ●
                                                                                   Hastings   ●
                                                        Whanganui      ●

                                                                               ● Palmerston
                                                                                  North

                                                                                ● Masterton
                                        Nelson   ●                ● Wellington

                                                 Blenheim   ●

                 Greymouth   ●

                                        ● Christchurch

                             ● Timaru

                          ● Oamaru
   ● Queenstown
                                                                           New Zealand
            Dunedin   ●

● Invercargill

                                           4
New Zealand: A n O ver v iew

Area and Population                                                             Form of Government
New Zealand is a parliamentary democracy situated in the South                  New Zealand is a sovereign state with a democratic parliamentary
Pacific Ocean, 6,500 kilometres (4,000 miles) south-southwest of                government based on the Westminster system. Its constitutional
Hawaii and 1,900 kilometres (1,200 miles) to the east of Australia.             history dates back to the signing of the Treaty of Waitangi in
With a land area of 268,000 square kilometres (103,000 square                   1840, when the indigenous Māori people ceded sovereignty over
miles), it is similar in size to Japan or Britain. It is comprised of two       New Zealand to the British Queen. The New Zealand Constitution
main adjacent islands, the North Island and South Island, and a                 Act 1852 provided for the establishment of a Parliament with
number of small outlying islands. Because these islands are widely              an elected House of Representatives. Universal suffrage was
dispersed, New Zealand has a relatively large exclusive maritime                introduced in 1893. Like Canada and Australia, New Zealand
economic zone of 4.1 million square kilometres.                                 has the British monarch as titular Head of State. The Queen is
                                                                                represented in New Zealand by the Governor-General, appointed
Over half of New Zealand’s total land area is pasture and
                                                                                by her on the advice of the New Zealand Government.
arable land and more than a quarter is under forest cover,
including 1.8 million hectares of planted production forest. It is              As in the United Kingdom, constitutional practice in New Zealand
predominantly mountainous and hilly, with 13% of the total area                 is an accumulation of convention, precedent and tradition, and
consisting of alpine terrain, including many peaks exceeding                    there is no single document that can be termed the New Zealand
3,000 metres (9,800 feet). Lakes and rivers cover 1% of the land.               constitution. The Constitution Act 1986, however, updated,
Most of the rivers are swift and seldom navigable, but many are                 clarified and brought together in one piece of legislation the most
valuable sources of hydro-electric power. The climate is temperate              important constitutional provisions that had been enacted in
and relatively mild.                                                            various statues. It provides for a legislative body, an executive and
                                                                                administrative structure and specific protection for the judiciary.
New Zealand’s resident population at 30 June 2014 is estimated
at 4,509,900. With an estimated population of 1,527,100 people,                 Legislative power is vested in Parliament, a unicameral body
the Greater Auckland Region is home to 34 out of every 100                      designated the House of Representatives. It currently has 121
New Zealanders and is one of the fastest growing regions in the                 members, who are elected for three-year terms through general
country.                                                                        elections at which all residents over 18 years of age are entitled to
                                                                                vote. Authority for raising revenue by taxation and for expenditure
New Zealand has a highly urbanised population with around 73%                   of public money must be granted by Parliament. Parliament also
of the resident population living in urban entities with 30,000 or              controls the Government by its power to pass a resolution of no
more people. As at June 2014, over half of all New Zealanders                   confidence or to reject a Government proposal made a matter of
(53%) lived in the four main urban areas of Auckland (1,413,                    confidence, in which event the Government would be expected
500), Hamilton (218.800), Wellington (393,500) and Christchurch                 to resign.
(375,200).
                                                                                The executive Government of New Zealand is carried out by the
The population is heavily concentrated in the northern half of the              Executive Council. This is a formal body made up of the Cabinet
North Island (54%), with the remaining population fairly evenly                 and the Governor-General, who acts on the Cabinet’s advice. The
spread between the southern half of the North Island (22.1%)                    Cabinet itself consists of the Prime Minister and his/her Ministers,
and the South Island (23.5%). The least populated regions, given                who must be chosen from among elected Members of Parliament.
their size in terms of land area, are the West Coast (0.7%) and the             Each Minister supervises and is responsible for particular areas
southern half of the South Island (6.8%).                                       of government administration. Collectively, the Cabinet is
                                                                                responsible for all decisions of the Government.

                                                                            5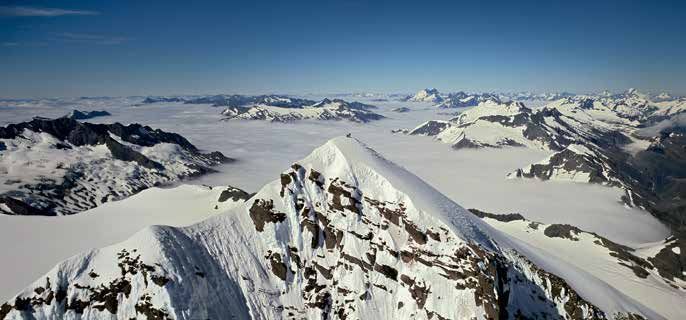
New Zealand: aN OVERVIEW
As a result of a referendum held in conjunction with the 1993 The Treaty of Waitangi
election, New Zealand changed from a “First Past the Post” (FPP)
The Treaty of Waitangi is regarded as a founding document of
system of electing Members of Parliament to a “Mixed Member
New Zealand. First signed at Waitangi on 6 February 1840, the
Proportional” (MMP) system of proportional representation.
Treaty is an agreement between Māori and the British Crown and
MMP is similar to the German Federal system of election to the
affirms for Māori their status as the indigenous people of New Zealand.
Lower House. Under MMP, the total number of seats each party
has in Parliament is proportional to that party’s share of the total The Treaty comprises three articles. The first grants to the Queen
list vote. Around half of all Members of Parliament are elected of England the right to “govern” New Zealand while the second
directly as electorate representatives as under the FPP system. article guarantees Māori possession of their lands, forests, fisheries
The remaining members are chosen by the parties from party lists. and other resources. The third and final article gives Māori all the
This change was put in place for the 1996 election. citizenship rights of British subjects. There are outstanding claims
Following the general election in November 2014, seven political by Māori that the Crown has breached the Treaty, particularly the
parties are represented in Parliament. The total number of seats guarantees under the second article. Since 1992, the Government
stands at 121, an ’overhang’ of one seat, because the Māori Party has developed processes and polices to enable the Crown and
won one more electoral seat than it was entitled to according to Māori to settle any Treaty of Waitangi claim relating to events that
its share of the party vote overall. The National Party formed a occurred before September 1992.
minority Coalition Government after the election with support
Foreign Relations and External Trade
agreements with ACT, United Future and the Māori Party. The
Honourable John Key, the Leader of the National Party, is Prime New Zealand foreign policy seeks to influence the international
Minister and the Honourable Bill English, Deputy Leader of environment to promote New Zealand’s interests and values,
National, is Deputy Prime Minister. and to contribute to a stable, peaceful and prosperous world.
In seeking to make its voice heard abroad, New Zealand aims to
The judicial system in New Zealand is based on the British model.
advance and protect both its security and prosperity interests.
By convention and the Constitution Act 1986, the judiciary is
independent from the executive. Trade is essential to New Zealand’s economic prosperity. Exports
of goods and services make up over 30% of New Zealand’s GDP.
Social Framework New Zealand’s trade interests are well diversified. Australia, China,
New Zealand has a high degree of social and political stability North America, the European Union and the Association of
and a modern social welfare system which includes universal South-East Asian Nations (ASEAN) take between around 10% and
entitlement to primary and secondary education and subsidised 25% each of New Zealand’s goods exports. Other major trading
access to health services for all residents. partners include Japan and the Republic of Korea.
The population is mainly European with around 75% of residents While New Zealand exports a broad range of products, it is reliant
designating themselves as being of European descent, 16% as on exports of commodity-based products as the main source of
New Zealand Māori, 8% as Pacific Islanders, 12% as Asian and export receipts and relies on imports of raw materials and capital
1% as other. (Note: Census respondents are able to give multiple equipment for industry.
responses to ethnicity questions, hence the number of responses New Zealand is committed to a multi-track trade policy which
is greater than the total population). There is a high incidence of includes the following measures:
intermarriage among these groups. The majority of Europeans multilateral trade liberalisation through the World Trade
are of British descent, while the New Zealand Māori are of the Organisation (WTO);
same ethnic origin as the indigenous populations of Tahiti, Hawaii regional co-operation and liberalisation through active
and several other Pacific Islands. In recent years there has been an membership of such fora as the Asia Pacific Economic
increasing level of immigration from Asian countries. Cooperation (APEC) and the East Asian Summit;
Table 1 – Distribution of Seats in Parliament Among Principal Parties Over the Last Six General Elections
1999 2002 2005 2008 2011 2014
National Party 39 27 48 58 59 60
Labour Party 49 52 50 43 34 32
Green Party 7 9 6 9 14 14
New Zealand First 5 13 7 - 8 11
M ori Party - - 4 5 3 2
ACT New Zealand 9 9 2 5 1 1
United Future 1 8 3 1 1 1
Other 10 2 1 1 - -
Total 120 120 121 122 121 121
Source: Electoral Commission
6
New Zealand: aN OVERVIEW
a focus on building regional relationships through various major objective of New Zealand’s tenure will be to ensure that the
policy initiatives; and perspective of small states is reflected in the workings of the Council.
bilateral and plurilateral trade arrangements, such as:
Environmental Policy
the Closer Economic Relations (CER) agreement with
Australia (in force since 1983); The New Zealand Government recognises the importance of
the Free Trade Agreement with China (signed 2008); the country’s environment and natural resources to its social and
bilateral agreements with Singapore, Thailand, Malaysia, economic development.
Hong Kong and Korea;
New Zealand is wealthy in natural resources. It has plentiful, clean
the Trans-Pacific Strategic Economic Partnership Agreement water; clean air; fertile soil and a temperate climate well-suited to
(previously known as P4) with Singapore, Chile and Brunei; forestry, livestock, and agriculture; long coastlines and significant
the ASEAN-Australia-New Zealand Free Trade Agreement; aquaculture resources; low energy use, waste, and greenhouse
the New-Zealand Gulf Cooperation Council (GCC) Free gas emissions per unit of economic output; significant mineral and
Trade Agreement; petroleum reserves; and extraordinary biodiversity both on land
the Chinese Taipei Agreement on Economic Co-operation; and in the rivers, lakes and surrounding ocean. The World Bank
current negotiations with India; estimates that New Zealand ranks eighth out of 120 countries
in natural capital per capita; it is outranked only by petroleum-
current Trans-Pacific Partnership (TPP) negotiations to
include Australia, Canada, Japan, Malaysia, Mexico, Peru, the exporting countries.1
United States, Vietnam and the original P4 countries; and
Given the importance of the primary sector to the economy,
current negotiations on RCEP (Regional Comprehensive better management of freshwater and other renewable resources,
Economic Partnership) which involve the ten members of the continued protection of biodiversity and marine resources,
ASEAN, China, India, Korea, Japan and Australia.
reducing waste, and improving energy efficiency are all essential
New Zealand remains committed to a reduction of world-wide for creating wealth and providing higher living standards for
trade barriers. Tariffs have been systematically reduced and New Zealanders. Programmes are in place or under further
quantitative controls on imported goods eliminated. Around 90% development in all these areas.
of goods come into New Zealand tariff free, including all goods
The Resource Management Act 1991 (RMA) provides a
from Least Developed Countries.
national framework for balancing environmental protection with
New Zealand was active in laying the foundations for the Doha economic, social and cultural values. Local government has the
round of WTO negotiations. Agriculture and services are of major responsibility for delivering resource management planning
prime importance to the New Zealand economy and agriculture, and consenting, with central government providing guidance
in particular, is central to the Doha negotiations. New Zealand is on how to apply the RMA and direction on matters of national
working with other like-minded countries to reduce barriers to importance. Amendments to the RMA in 2009 streamlined and
trade in goods and services and provide improved market access simplified processes and created a new agency, the Environmental
for New Zealand exporters. Protection Authority, to facilitate decision-making on proposals
of national significance. Further proposed amendments are
New Zealand, as a member of APEC, is committed to achieving
intended to strengthen planning outcomes, reduce uncertainty,
APEC’s goals of free trade and investment in the region. Asia-
reduce costs and delays and enhance Māori participation in
Pacific regional linkages remain at the core of New Zealand’s
resource management processes.
political and economic interests. The countries of APEC take more
than 70% of New Zealand’s exports, provide 71% of tourism Climate change presents a particular challenge for New Zealand,
arrivals and account for around 75% of New Zealand’s foreign both from an international and domestic policy perspective.
direct investment. New Zealand is a small country with a unique emissions profile
driven by the predominance of land-use industries. Despite
Membership in International Economic New Zealand’s relatively small contribution to global emissions,
Organisations the Government is nonetheless committed to participating
New Zealand is a long-standing member of the Organisation constructively in the international climate change dialogue.
for Economic Cooperation and Development (OECD), the
An Emissions Trading Scheme (ETS) is in place, designed to
International Monetary Fund (IMF), the World Bank Group,
assist New Zealand in meeting international climate change
the Asian Development Bank (ADB) and the World Trade
commitments at least cost and to reduce New Zealand’s net
Organisation (WTO).
emissions below business-as-usual levels by placing obligations on
In late 2114, New Zealand was elected to a non-permanent seat emitters to surrender units in relation to their emissions. The ETS
at the Unitied Nations Security Council for a two-year term. The came into force in 2008 and has been periodically reviewed and
New Zealand Representative took up the seat in January 2015. A adjusted since then.
1 World Bank. “The Changing Wealth of Nations: Measuring Sustainable Development in the New Millenium.” (2011). Retrieved from
http://data.worldbank.org/data-catalog/wealth-of-nations
7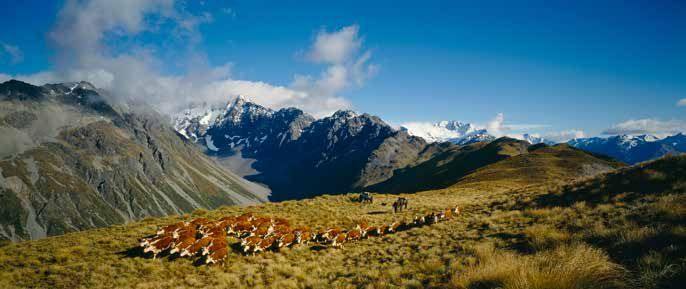
New Zealand: aN OVERVIEW

Selected Economic and Financial Data
Table 2 – Statistical Data

                                                                         2010                   2011                  2012                2013                  2014
                                                                                                 (dollar amounts in millions)
 GDP at Current Prices 1, 2                                          192,855               201,630                  210,300            215,735              230,498
 Annual % Increase (Decrease) in Real GDP 1, 2, 3                        (0.3)                   1.4                     2.2                2.2                   2.5
 Population4                                                            4,342                 4,379                   4,404              4,435                 4,494
 Unemployment Rate5                                                        6.3                   6.4                     7.1                6.1                   5.4
 Change in Consumer Price Index6                                           4.0                   1.8                     0.9                1.6                   0.8
 Exchange Rate7                                                        0.7578                0.7768                  0.8236             0.8281                0.7822
 90-Day Bank Bill Rate8                                                   3.18                  2.71                    2.64               2.69                  3.67
 10-Year Government Loan Stock Rate8                                      5.47                  4.20                    3.51               4.71                  3.95
 Terms of Trade Index 2, 9                                              1,246                 1,288                   1,170              1,355                 1,352
 Current Account Deficit as a % of GDP 2, 10                             (2.4)                 (3.3)                   (3.7)              (3.9)                 (2.6)

Source: Statistics New Zealand

Table 3 – Government Finance11
                                                                 2009/10           2010/11             2011/12           2012/13         2013/14          2014/1512
 Year ended 30 June                                                                              (dollar amounts in millions)
 Total Revenue                                                      74,725           81,563              83,483             86,655         89,396             94,300
 Total Expenses                                                     81,040           99,959              92,723             91,007         92,170             94,517
 OBEGAL13                                                          (6,315)         (18,369)             (9,240)            (4,414)        (2,933)              (572)
 Gains/(Losses)                                                      1,806            5,036              (5,657)           11,339           5,741              2,472
 Operating Balance                                                 (4,509)         (13,360)            (14,897)             6,925           2,808              1,900
 Operating Balance % of GDP                                           (2.3)            (6.6)                (7.0)              3.2             1.2                0.6
 Total Assets                                                     223,355             245,215          240,318            244,416        256,083            259,923
 Total Liabilities                                                128,367             164,328          180,538            174,405        175,304            177,363
 Minority interests                                                    402               308                432                1,940        5,211              5,184
 Net Worth                                                         94,586             80,579            59,348             68,071         75,568             77,376
 Net Direct Domestic Borrowing                                       8,016             18,362             8,557                  76         4,764                    -
 Net Direct Overseas Borrowing                                         409               787            (1,450)            (1,010)            278                    -

Source: The Treasury

Table 4 – Direct Public Debt
 Internal Funded Debt                                            38,575.5          60,519.9            64,006.2           67,587.3       73,121.6                    -
 Internal Floating Debt                                           8,065.0           7,326.0            10,081.0            4,735.0          3,800                    -
 External Debt                                                    2,197.2             214.0             (308.5)           (1222.5)        (342.7)                    -
 Total Direct Public Debt                                        48,837.7          68,059.9            73,078.7           71,099.8       76,598.9                    -

Source: The Treasury

1	Year ended 31 March.
2 2014 data provisional. Prior years' data revised.
3 Production based - chain volume series expressed in 2009/10 prices.
4 September year resident population estimate.
5 September quarter, seasonally adjusted.
6 Annual percentage change, December quarter.
7	US$ per NZ$ December quarter average.
8 December quarterly average.
9	Year ended 30 September. Base: June quarter 2002 = 1,000.
10	Year ended 30 September.
11 Financial Statements of the Government of New Zealand for the Year Ended 30 June 2014.
12	Half-Year Update announced 16 December 2014.
13 Operating Balance Excluding Gains and Losses (OBEGAL). The OBEGAL is the operating balance excluding gains and losses on assets and liabilities of institutions such
   as the Accident Compensation Corporation, Earthquake Commission and the Government Superannuation Fund.

                                                                                  8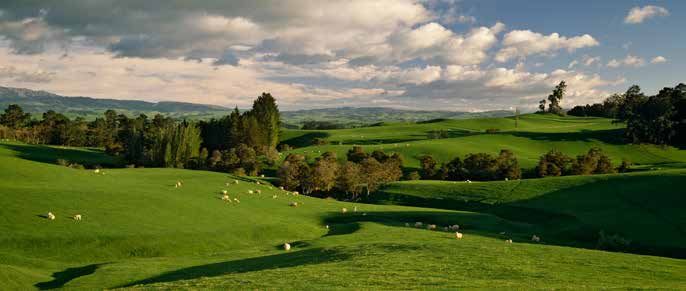
Economic and Fiscal Forecasts

The Treasury’s Half Year Economic and Fiscal Update (published          and the United Kingdom are achieving a sustained recovery, led
16 December 2014) forecasts a solid pace of expansion for               primarily by steady improvements in their labour markets, while
the New Zealand economy over the next couple of years,                  activity in Australia is expected to pick up towards trend growth
underpinned by strong domestic demand owing to high net                 over the next few years. However, the outlook for Japan and the
migration inflows, business investment and the Canterbury               euro area is weak, while growth in China and many other emerging
earthquake rebuild. Real production GDP is expected to expand           Asian economies is forecast to slow over the medium term.
3.4% in the year to December 2015 and 3.0% in 2016. However,
                                                                        The terms of trade fell in the September quarter 2014 from
low domestic inflation and weak international commodity prices,
                                                                        their 40-year high in June, and are expected to decline further in
particularly crude oil, mean nominal GDP growth will be slower.
                                                                        the near term, as prices of dairy exports continued to fall in the
As the impulse to growth from migration and the earthquake              second half of 2014. The terms of trade are forecast to stabilise
rebuild diminishes and monetary policy is gradually tightened           later in 2015 at above-average levels, and are expected to remain
in response to increasing capacity constraints, real GDP growth         solid over the medium term on the back of stronger global
is expected to ease in 2016. In addition, the government’s fiscal       demand, particularly from China. However, risks to this forecast
consolidation is expected to continue to weigh on domestic              are weighted towards weaker prices.
demand, and the high New Zealand dollar to continue to be a
                                                                        The fiscal position of the government is expected to continue
drag on exports, leading to forecasts of higher current account
                                                                        improving over the medium term, with the operating balance
deficits as a percentage of GDP. Other factors leading to the
                                                                        deficit reducing in the 2014/15 fiscal year (ending on 30 June
likelihood of a higher current account deficit in the near term
                                                                        2015), followed by a surplus in 2015/16. The operating surplus is
include rising imports for the Canterbury rebuild and generally
                                                                        expected to continue to increase as a percentage of GDP over the
strong domestic demand.
                                                                        medium term. Net debt is expected to fall from 26.5% of GDP in
Economic growth amongst New Zealand’s main trading partners             2014/15 to 22.5% in 2018/19.
remains positive but uneven. The economies of the United States

Southern Alps reflected in Okarito Lagoon, Westland National Park.
© Andris Apse

                                                                    9
economic and fiscal forecasts

Table 5 – Summary of Economic Forecasts1
 March Years                                                  2014              2015             2016          2017       2018       2019
 Annual average % change                                     Actual          Forecast         Forecast       Forecast   Forecast   Forecast
 Private consumption                                            3.3              3.6               3.4            3.1       1.7        1.6
 Public consumption                                             1.7               1.6             -0.5            0.1        2.8        2.5
 Total Consumption                                              3.0              3.2               2.6           2.5        2.0        1.8
 Residential investment                                        17.0               15.3               12.2        4.5        0.9       (2.6)
 Non-market investment                                         (2.6)              (2.0)               5.1        2.4        2.4        2.4
 Market investment                                              8.8                6.2                7.1        6.7        4.4        2.9
 Total Investment                                              10.6                8.2                8.4        6.5        3.9        2.0
 Stock change2                                                  0.3                0.5               (0.8)      (0.1)      (0.1)       0.1
 Gross National Expenditure                                     4.7                4.9                3.3        3.4        2.4        1.9
 Exports                                                        0.3                0.5                1.8        3.5        3.1        2.5
 Imports                                                        8.0                5.9                1.7        5.0        3.2        1.7
 Expenditure on GDP                                             2.5                3.3                3.4        2.8        2.3        2.1
 GDP (production measure)                                       3.2                3.5                3.4        2.8        2.3        2.2
  - annual % change                                             3.8                3.3                3.2        2.5        2.3        2.0
 Real GDP per capita                                            2.2                1.9                1.8        1.7        1.3        1.3
 Nominal GDP (expenditure basis)                                6.7                3.0                4.9        5.7        4.1        3.6
 GDP deflator                                                   4.1               (0.2)               1.5        2.8        1.8        1.5
 Output gap (% deviation, March year
 average)3                                                     (0.6)               0.1                0.6        0.6        0.3        0.2
 Employment                                                     2.5                2.9                1.7        1.6        1.3        1.1
 Unemployment (% March quarter s.a.)4                           6.0                5.4                5.1        4.7        4.5        4.5
 Participation rate5                                           69.2               68.9               68.7       68.8       68.8       68.8
 Wages (average ordinary-time hourly,
 ann % change)6                                                 2.5                2.8                2.8        3.1        3.3        3.5
 CPI inflation7                                                 1.5                1.3                2.0        2.1        2.0        2.0
 Terms of trade8                                               13.5               (3.9)              (3.6)       3.7        0.5        0.4
 House prices9                                                  8.0                5.4                3.9        2.5        2.3        2.0
 Current account balance – $billion                            (6.0)           (12.4)            (15.2)        (14.8)     (15.4)     (16.4)
 Current account balance – % of GDP                            (2.7)              (5.3)              (6.2)      (5.8)      (5.7)      (5.9)
 TWI-510                                                       78.7               76.5               76.5       76.6       75.6       73.6
 90-day bank bill rate10                                        3.0                3.7                3.9        4.4        4.8        5.2
 10-year bond rate10                                            4.6                4.0                4.2        4.7        5.0        5.1

1    Forecasts finalised 10 November 2014.
2    Contribution to GDP growth.
3    Estimated as the percentage difference between actual real GDP and potential real GDP.
4    Percent of the labour force, March quarter, seasonally adjusted.
5    Percent of the working-age population, March quarter, seasonally adjusted.
6    Quarterly Employment Survey, average ordinary-time hourly earnings, annual percentage change.
7    Annual percentage change.
8    System of National Accounts (SNA) and merchandise basis, annual average percentage change.
9    Quotable Value New Zealand (QVNZ) House Price Index, annual percentage change.
10   Average for the March quarter.
Source: The Treasury

                                                                             10
Economic O ver v iew
Introduction The Government introduced retail and wholesale bank guarantees
aimed at restoring confidence in the banking sector and providing
New Zealand has a small open economy which operates on free
banks with improved access to wholesale funding. (Both schemes
market principles. It has a sizable manufacturing and a large
have since been discontinued.)
services sector complementing a highly efficient export-oriented
agricultural sector. Primary commodities account for more than The Labour-led government proceeded with income tax cuts in
half of total goods exports while exports of goods and services October 2008 and the National-led government, which came
represent around one third of real expenditure GDP. to power in November 2008, introduced further tax reductions
effective from 1 April 2009.
New Zealand’s high proportion of winter sunshine hours
and considerable rainfall provide an ideal base for pastoral Other short-term measures taken by the Government in late 2008
agriculture, forestry, horticulture and hydro-electicity generation. included infrastructure projects and a temporary relief package
New Zealand is also a popular overseas vistor destination and to assist small and medium-sized businesses.
tourism is an important source of export income.
Canterbury Earthquakes
Over the past three decades, the New Zealand economy has On 22 February 2011, the Canterbury region on the eastern side
changed from being one of the most regulated in the OECD to of the South Island experienced a devastating 6.3-magnitude
one of the least regulated. The minority National-led Government earthquake. A total of 185 people were killed; the second
first elected in November 2008, and re-elected for a third term deadliest natural disaster in New Zealand history. This followed
in September 2014, aims to lift the long-term perfomance of a 7.1-magnitude earthquake on 4 September 2010, in which
the economy through five key policy drivers: building a stronger there had been no direct casualties. The earthquakes (including
economy, investment in world-class infrastructure, better public subsequent aftershocks) caused wide-spread damage to buildings
services, rebuilding Christchurch; and by building a safer and infrastructure, in particular to the Central Business District
New Zealand. (CBD) and eastern parts of Christchurch, New Zealand’s second
most populous city.
Recent Economic Performance and Outlook
The New Zealand Treasury estimated the total cost of the rebuild
The New Zealand economy has steadily recovered from the
at around $40 billion (about 20% of annual nominal GDP), much
global financial crisis (GFC) despite further disruptions such as the
of which is covered by private insurance (reinsured through
Canterbury earthquakes and occasional periods of drought.
overseas insurance companies) and the government-owned
Response to GFC Earthquake Commission (EQC).
The New Zealand economy experienced a recession in 2008 Economic Recovery and Outlook
and 2009 owing primarily to the intensification of the GFC in
The New Zealand economy has made a solid recovery since
2008. Similar to the experience in many advanced economies,
the 2008/09 recession, which was shallow compared to other
business and consumer confidence plummeted as the cost of
advanced economies. Annual growth has averaged a solid 2.2%
credit increased and house prices fell modestly. Local banks’
since the March quarter of 2010 despite a period of softer growth
access to funding in overseas markets was temporarily curtailed
in 2012, and was strong by historical standards in 2014. Growth
as uncertainty dominated the global financial and economic
in the March, June and September quarters of 2014 was 0.9%,
environment. Real GDP contracted 2.8% overall between
0.7% and 1.0% respectively, bringing annual average growth to
March 2008 and June 2009.
2.9% in the year ended September, the fastest rate of expansion
The Reserve Bank of New Zealand (RBNZ) responded to the crisis in six years. Growth over the past year has been driven by the
by lowering the Official Cash Rate (OCR) from 8.25% in June 2008 construction, services and agricultural sectors, with agricultural
to a low of 2.5% at the end of April 2009 and introducing facilities output rebounding in the September quarter from a drought
to ensure adequate liquidity for the banking sector. affecting some regions earlier in the year.
11Economic overview
Despite the significant disruption caused by the earthquakes, is to increase the resilience of the domestic financial system and
the impact on economic activity was less than expected. Many counter instability arising from credit, asset price or liquidity
businesses were able to relocate out of the badly-damaged CBD shocks. Macro-prudential instruments include adjustments to the
and continue trading, and primary and manufacturing production core funding ratio, countercyclical capital buffers, adjustments
in the region was not significantly affected. to sectoral capital requirements and quantitative restrictions on
the share of high loan-to-value ratio (LVR) loans in the residential
The Canterbury rebuild is expected to be a positive driver of
property sector. The latter was implemented on the 1 October
growth over the next several years through residential, commercial
2013 with a requirement for commercial banks to restrict new
and infrastructure investment. Construction activity in the region
residential mortgage lending at LVRs of 80% or higher to no more
has picked up since early 2012, and current indicators point to
than 10% of the dollar value of new residential mortgage lending.
continued solid growth in 2015. Earthquake-related construction
is expected to peak around the end of 2015 but the level of overall LVR restrictions have contributed to a moderation in the housing
residential investment in the economy is expected to continue to market. Demand for existing housing has fallen and annual
expand, supported by housing construction in Auckland. house price inflation in November 2014 (6%) was lower than in
November 2013 (10%). House sales recovered to some extent
The global economy rebounded from the GFC in 2010 but then
from their declines in early to mid-2014, to be up 6.5% on the
slowed significantly as public stimulus measures faded in China,
previous year in November.
the earthquake in Japan caused disruption in 2011 and European
sovereign debt issues emerged. However, New Zealand’s
Fiscal Policy
increasing exposure to the faster growing areas of the world,
in particular Australia and emerging Asia including China, Prudent Fiscal Management
resulted in exports holding up better than otherwise expected. In 1994, the Government enacted the Fiscal Responsibility Act.
New Zealand’s trading partner growth was 3.5% in 2013 and is The Act was intended to assist in achieving consistent good quality
expected to be 3.7% in 2014 and to increase to 3.9% 2015. fiscal management over time. Good quality fiscal management
should enable the Government to make a major contribution to
Monetary Policy the economic health of the country and be better positioned to
The focus of monetary policy is to maintain price stability. A Policy provide a range of services on a sustained basis. The provisions of
Targets Agreement (PTA) between the Governor of the RBNZ and the Fiscal Responsibility Act have since largely been incorporated
the Minister of Finance sets out the specific targets for maintaining into Part 2 of the Public Finance Act 1989.
price stability, while seeking to avoid unnecessary instability in Part 2 requires the Government to pursue its policy objectives in
output, interest rates and the exchange rate. The current PTA accordance with the principles of responsible fiscal management.
requires the RBNZ to maintain inflation in the range of 1% to
3% on average over the medium term, but with an additional Key Fiscal Indicators
requirement to “focus on keeping future average inflation near An extended period of growth had led to a strong fiscal position
the 2% target midpoint”. for the Government in the 2007/08 year. However, the recession
that began in the first quarter of 2008 resulted in a decrease in
The OCR was lowered from 8.25% in mid 2008 to 2.5% in April
revenues and expenditure increases which weakened the fiscal
2009 in response to the GFC but, as the economy began to recover,
position in 2008/09 and subsequent years.
the Bank started to raise rates again. The OCR was increased to
3.0% in July 2010, before a 50 basis points cut back to 2.5% was Operating Balance: In 2013/14, the operating balance before
made following the February 2011 Canterbury earthquake. A gains and losses (OBEGAL) was a deficit of $2.9 billion (1.3% of
deteriorating global outlook meant that interest rates remained at GDP). However, when gains and losses are included, the operating
2.5% until March 2014 when the Bank began to tighten monetary balance was a surplus of $2.8 billion (1.2% of GDP). The December
policy. The OCR was increased by a cumulative 100 basis points 2014 Half-Year Economic and Fiscal Update forecasts for the
to reach 3.5% in July 2014, as rising momentum in the Canterbury OBEGAL for 2014/15, 2015/16, 2016/17, 2017/18, and 2018/19
rebuild and domestic demand pressures were expected to lead are for a deficit of $0.6% billion (0.2% of GDP) and surpluses of
to increasing inflationary pressures. However, the RBNZ has $0.6 billion (0.2%), $2.6 billion (1.0%), $3.1 billion (1.1%) and
maintained the OCR at 3.5% since then as it assesses the impact $4.1 billion (1.4%) respectively.
of its recent monetary tightening before making further moves.
Core Crown operating expenses as a percentage of GDP fell to
Macro-Prudential Policy 30.5% in 2013/14 from 32.4% in 2012/13. Expenses are controlled
The RBNZ is also responsible for promoting the maintenance of a through output budgeting, accrual reporting and decentralised
sound and efficient financial system. In May 2013, a Memorandum cost management.
of Understanding was signed between the Minister of Finance
Net debt: Net debt was broadly steady at 25.6% of GDP in
and the Governor of the RBNZ defining macro-prudential policy
2013/14 as strong nominal growth offset additional borrowing
and its operating guidelines. The objective of the Memorandum
undertaken by the Government to cover its cash deficit.
12Economic overview
Net worth: After a prolonged period of deficits, net worth The current short-term fiscal intention is for the OBEGAL to return
attributable to the Crown rose in 2012/13 and 2013/14 to to surplus in 2014/15, subject to any significant shocks.
$68.1 billion and $75.6 billion respectively, reflecting the
operating surplus coupled with positive property revaluations. Public Debt
Fiscal Objectives Prior to March 1985, successive governments had borrowed
The Government’s long-term fiscal objectives were set out in the under a fixed exchange-rate regime to finance the balance
Fiscal Strategy Report published with the 2014 Budget and re- of payments deficit. Since the adoption of a freely floating
confirmed in the 2015 Budget Policy Statement in December 2014. exchange-rate regime, governments have undertaken new
The long-term fiscal objectives include objectives for debt, the external borrowing only to rebuild the nation’s external reserves
operating balance, operating expenses and revenue, and net worth. and to meet refinancing needs.
The long-term debt objective requires net debt to be brought Direct public debt increased by a net amount of $5 million
back to no higher than 20% of GDP by 2020 and to remain between including swaps between 1 July 2013 and 30 June 2014. This
10% and 20% thereafter. Consistent with this, the objective for the increase was due to a net increase in internal debt of $4,599 million
operating balance is to return to an operating surplus sufficient and an increase of $880 million in external debt.
to meet the Government’s net capital requirement, including Government gross direct debt amounted to 33.2% of GDP in the
contributions to the Government Superannuation Fund, and year ended June 2014, unchanged from 33.2 % the previous year.
ensure consistency with the debt objective.
National Accounts
In the year to September 2014, the New Zealand economy recorded annual average growth in real production GDP of 2.9%. Growth in
the September 2014 quarter was 1.0% following growth of 0.7% in the June quarter and 0.9% in the March quarter.
Table 6 – Gross Domestic Product and Gross National Expenditure1
The following table shows Gross Domestic Product and Gross National Expenditure in nominal terms for the five years to March 2014:
2010 2011 2012 2013 2014
Year ended 31 March (dollar amounts in millions)
Compensation of Employees 85,762 88,811 92,218 95,999 100,127
Net Operating Surplus 54,346 57,954 60,566 60,094 68,225
Consumption of Fixed Capital 29,888 29,873 30,189 30,997 31,838
Indirect Taxes 23,524 25,997 28,364 29,175 31,718
Less Subsidies 665 1,004 1,037 951 870
Gross Domestic Product 192,855 201,630 210,300 215,315 231,038
Final Consumption Expenditure
General Government 38,249 39,864 41,392 41,725 43,428
Private 111,668 116,148 122,110 125,975 130,338
Physical Increase in Stocks (851) 862 1,283 598 1,857
Gross Fixed Capital Formation 39,278 40,087 42,216 45,910 50,928
Gross National Expenditure 188,343 196,962 207,002 214,208 226,551
Exports of Goods and Services 55,832 61,559 64,749 62,762 67,175
Less Imports of Goods and Services 51,320 56,891 61,451 61,235 63,227
Expenditure on Gross Domestic Product 192,855 201,630 210,300 215,735 230,498
1 2014 data provisional. Prior years’ data revised.
Source: Statistics New Zealand
13Economic overview
Figure 1 – Real Gross Domestic Product
%
Forecast
― Annual average % change Quarterly % change
Sources: Statistics New Zealand, the Treasury
Table 7 – Gross Domestic Product by Production Group1
The following table shows GDP by major industries at constant 1995/96 prices.
2010 2011 2012 2013 2014 2014
Year ended 30 September (dollar amounts in millions) % of Total
Rental, hiring, and real estate services 23,121 23,873 24,543 24,735 25,060 11.8
Manufacturing 23,373 23,002 22,597 23,185 23,678 11.1
Prof, scientific, technical, admin, and support 17,884 18,509 18,762 19,558 19,750 9.3
Retail trade and accommodation 12,373 12,553 13,088 13,554 14,104 6.6
Construction 10,584 10,248 11,170 12,381 13,874 6.5
Health care and social assistance 11,959 11,794 12,123 12,602 13,222 6.2
Financial and insurance services 11,264 11,403 11,491 11,894 12,330 5.8
Agriculture, forestry, and fishing 10,699 10,935 12,240 11,881 11,981 5.6
Wholesale trade 9,770 10,312 10,510 10,719 11,095 5.2
Education and training 9,231 9,243 9,270 9,307 9,381 4.4
Public administration and safety 8,851 8,880 8,842 8,995 9,186 4.3
Transport, postal, and warehousing 8,422 8,850 9,015 9,035 9,157 4.3
Arts, recreation, and other services 6,894 6,793 6,803 7,027 7,105 3.3
Information media and telecommunications 5,901 6,346 6,512 6,689 6,734 3.2
Electricity, gas, water, and waste services 6,282 6,307 6,122 6,156 6,260 2.9
Mining 4,141 3,601 3,458 3,547 3,686 1.7
Production GDP 194,876 197,082 201,931 206,710 212,639 100.0
Annual Average % change 1.6 1.1 2.5 2.4 2.9
Primary Industries 14,732 14,554 15,897 15,546 15,807 7.4
Goods-producing industries 40,263 39,564 39,903 41,749 43,850 20.6
Service industries 125,672 128,552 130,971 134,083 137,069 64.5
1 2014 data estimated. Prior years’ data revised.
Source: Statistics New Zealand
14Economic overview
Figure 2 – Gross Domestic Product by Industry Group
Electricity, gas, water,
and waste services
Information media Mining
and telecommunications Rental, hiring, and
real estate services
Arts, recreation,
and other services
Transport, postal,
and warehousing
Public administration
and safety
Manufacturing
Education and training
Wholesale trade
Retail trade and
accommodation
Financial and
insurance services
Construction
Health care and
social assistance
Sources: Statistics New Zealand, the Treasury
Labour Markets unemployment rate fluctuated between 6.2% and 7.2% until 2012,
in part owing to a volatile participation rate. The unemployment
New Zealand has a decentralised labour market. The Employment
rate fell to 5.4% in the September quarter 2014 as the economy
Relations Act 2000 provides the statutory framework that
picked up. Employment also grew strongly, up 3.1% over the
supports the building of productive employment relationships.
previous year in the September quarter. This occurred despite
The legislation protects the integrity of individual choice in
increasing labour force participation, which remains elevated, in
terms of freedom of association and union membership and the
part owing to high net inflows of migrants. The positive outlook
choice of collective and individual employment agreements.
for the New Zealand economy points to continued solid jobs
It also promotes collective bargaining, requires the parties to
growth and the unemployment rate is expected to decline to
employment relationships (unions, individual employees and
5.2% by the end of 2015, 4.8% by the end of 2016 and around
employers) to deal with each other in good faith and promotes
4.5% in subsequent years.
mediation to assist in the early resolution of workplace disputes.
The Canterbury earthquakes initially had a negative impact on
In 2010, the Government made several amendments to the Act
the labour market, with employment falling 8.3% in the region
in order to increase choice and flexibility, ensure the balance
in the year to December 2011. The Canterbury labour market
of fairness between employers and employees is appropriate
strengthened considerably over 2012 and 2013, with total
for both parties, improve the operation and efficiency of the
employment up by 5.2% and 5.9%, respectively. Employment in
legislation and reduce compliance costs.
the Canterbury region expanded at a robust pace of 10.7% in the
A set of minimum employment standards also underpins year to September 2014, and the unemployment rate declined
employment relationships and protects the more disadvantaged to 3.2% from a post-earthquake peak of 6.5% in June 2012. As
in the workforce. Relevant legislation includes the Minimum Wage the Canterbury rebuild continues, employment is expected to
Act, the Equal Pay Act, the Holidays Act and the Parental Leave continue to expand.
and Employment Protection Act.
Labour productivity contracted 2.3% in the year to March
New Zealand’s relatively high rate of job turnover and of firm 2009 but then rebounded to 3.8% in the year to March 2010
creation and destruction suggests that there are few regulatory as employers absorbed underutilised labour. Productivity
and institutional impediments to employment, investment and contracted again for a large part of 2010 and 2011 reflecting soft
innovation. Government policy is directed to building up skill GDP growth, which restrained firms’ demand for labour. Weak
levels in the workforce, addressing skill shortages and incentivising employment and a pick-up in GDP saw labour productivity grow
welfare beneficiaries to seek employment. strongly over 2012, with annual growth reaching a post-recession
peak of 3.8% in September. However, growth stalled again in
Employment contracted significantly in 2009 as weakness in the
2013, as employment strengthened, and eased by 0.1% in the
economy led to lower demand for labour.
year to September 2014. Productivity growth is expected to pick
The unemployment rate increased sharply from a record low of up again to around 2.0% in 2015 and 2016.
3.5% in December 2007 to around 7.0% at the start of 2010. The
15Economic overview
Prices and Costs the September quarter owing to a high exchange rate, soft wage
growth and low global inflation. It fell further to 0.8% in the
Consumer price inflation declined over the early 1990s as
December quarter, chiefly as a result of lower petrol prices.
monetary policy directed at maintaining price stability
(introduced in 1989) took effect. Since September 1991, inflation Inflation is expected to rise gradually in 2015 to just under the mid-
has averaged 2.1% per annum, around the mid-point of the point of the Reserve Bank’s target band owing to solid domestic
Reserve Bank’s current 1% to 3% target band. demand, the decline in the exchange rate in the second half of 2014
and capacity constraints associated with the Canterbury rebuild
Annual Consumers Price Index (CPI) inflation increased significantly
and residential construction in Auckland. Annual inflation is forecast
in the December quarter 2010 as an increase in the rate of goods
to be steady at around 2% in 2016, 2017 and 2018 as monetary
and services tax (GST) from 12.5% to 15% in October 2010 was
policy tightening keeps domestic price pressures in check.
passed on to consumers. The CPI rose 2.3% in the quarter, taking
annual inflation to 4.0%, above the RBNZ’s target range, although Growth in the index of salary and ordinary-time wage rates
the Policy Targets Agreement allows the RBNZ to look through declined sharply during the GFC to just 1.5% at the start of 2010
administrative price increases. Inflation increased further during compared with around 3.5% before the crisis. Since then it has
2011, rising to 5.3% on an annual basis in June 2011 before falling crept up, reaching 2.0% over late 2011 and early 2012 before
to 1.8% in the year to December. This fall was mainly the result of easing again over the remainder of 2012 and 2013 as low inflation
the GST rate rise falling out of the calculation. placed less pressure on wage growth. Wage growth stabilised
at a low level of 1.7% in the September quarter of 2014 but
Annual CPI inflation continued to ease over 2012 and the first
is expected to pick up over the next couple of years, partly as
half of 2013, falling to 0.7% in the December quarter owing to
inflation gradually returns to trend.
the strong New Zealand dollar, which depressed tradables prices.
Annual inflation gradually picked up in the second half of 2013, The following table shows on a quarterly basis the Terms of Trade
reaching 1.6% in the December quarter as tradables inflation was Index, the Producers Price Index, the Consumers Price Index, and
less negative and non-tradables inflation rose. Annual inflation the Labour Cost Index and, in each case, the percentage change
remained relatively steady in the first half of 2014, at 1.5% in over the same quarter of the previous year.
the March quarter and 1.6% in June, before falling to 1.0% in
Table 8 – Price and Cost Indices
Terms of Annual % Producers Annual % Consumers Annual % Labour Cost Annual %
Year Month Trade Index1 Change Price Index2 Change Price Index3 Change Index4 Change
2010 March 1,186 0.1 971 0.6 1,097 2.0 1,012 1.5
June 1,210 12.7 984 2.0 1,099 1.7 1,016 1.6
September 1,246 17.9 991 3.8 1,111 1.5 1,021 1.6
December 1,256 12.3 1,000 4.4 1,137 4.0 1,026 1.7
2011 March 1,266 6.7 1,022 5.3 1,146 4.5 1,030 1.8
June 1,296 7.1 1,031 4.8 1,157 5.3 1,035 1.9
September 1,288 3.4 1,037 4.7 1,162 4.6 1,041 2.0
December 1,269 1.0 1,042 4.2 1,158 1.8 1,047 2.0
2012 March 1,240 (2.1) 1,045 2.3 1,164 1.6 1,051 2.0
June 1,209 (6.7) 1,051 1.9 1,168 1.0 1,056 2.0
September 1,170 (9.2) 1,040 0.3 1,171 0.8 1,061 1.9
December 1,156 (8.9) 1,037 (0.5) 1,169 0.9 1,066 1.8
2013 March 1,205 (2.8) 1,045 0.0 1,174 0.9 1,070 1.8
June 1,261 4.3 1,051 0.0 1,176 0.7 1,074 1.7
September 1,355 15.8 1,074 3.3 1,187 1.4 1,078 1.6
December 1,389 20.2 1,066 2.8 1,188 1.6 1,083 1.6
2014 March 1,414 17.3 1,077 3.1 1,192 1.5 1,086 1.5
June 1,415 12.2 1,066 1.4 1,195 1.6 1,091 1.6
September 1,352 (0.2) 1,050 (2.2) 1,199 1.0 1,096 1.7
December N/A N/A N/A N/A 1,197 0.8 N/A N/A
1 Base: June quarter 2002 = 1,000.
2 All industry inputs. Base: December quarter 2010 = 1,000.
3 Base: June quarter 2006 = 1,000.
4 All industry ordinary-time salary and wage. Base: June quarter 2009 = 1,000.
Source: Statistics New Zealand
16Industrial Struct u re and Pri nci pal Economic S ectors
Primary Industries Prices increased strongly again in 2013, with historically high levels
The agricultural, horticultural, forestry, mining and fishing for dairy products due to robust demand from China and tighter
industries play a fundamental role in New Zealand’s economy, global milk supply. However, dairy and forestry prices declined
particularly in the export sector and in employment. Overall, the following the March 2014 quarter, with dairy prices down about
primary sector directly accounts for around 7.5% of real GDP and 50% at the start of 2015 compared to their peak in February
contributes around half of New Zealand’s total export earnings. 2014. Meat prices rose to a record high in September 2014
before falling somewhat over the December quarter.
Agriculture and Horticulture
Rising prices over 2013 enabled New Zealand’s major dairy
Agriculture directly accounts for around 4% of GDP, while the
exporter, Fonterra, to lift the final farm gate milk price for the
processing of food, beverage and tobacco products accounts
2013/14 season to $8.40 per kilogram of milk solids, from $5.84
for a further 4%. Downstream activities, including transportation,
in the 2012/13 season. However, Fonterra expects the farm gate
rural financing and retailing related to agricultural production,
milk price for the 2014/15 season to be significantly lower at
also make important contributions to GDP. Dairy farming is the
$4.70 per kilogram of milk solids, noting high uncertainty in the
predominant agricultural activity, followed by beef and sheep
price outlook owing to increased global milk production and
farming and horticulture.
weaker international demand.
Prices for New Zealand’s key agricultural commodities recovered
strongly following large declines during the GFC and continued Wine and kiwifruit are the principal horticultural products. Other
to increase over 2010 and the first half of 2011. Prices came significant horticultural exports include apples and pears, fresh
off their highs in the second half of 2011 as renewed euro area and processed vegetables, and seeds.
concerns emerged and continued to fall in the first half of 2012.
Table 9 – Gross Agricultural Production1
The following table shows sales of the principal categories of agricultural products for the years indicated and as a percentage of
agricultural sales for the year to March 2014.
2010 2011 2012 2013 2014 2014
Year ended 31 March (dollar amounts in millions) % of Total
Dairy 8,888 10,960 10,567 10,386 14,637 54.9
Sheepmeat 2,165 2,364 2,820 2,263 2,518 9.4
Cattle 1,848 2,129 2,289 2,316 2,209 8.3
Fruit 1,983 1,882 2,071 2,017 2,030 7.6
Vegetables 988 1,062 1,065 987 1,027 3.9
Sales of live animals 766 848 871 866 895 3.4
Crops and seeds 799 588 745 751 703 2.6
Wool 450 563 675 587 580 2.2
Non-farm income 387 399 408 472 576 2.2
Other farming 252 225 232 210 423 1.6
Agricultural services 221 216 216 220 269 1.0
Other horticulture 259 243 251 239 249 0.9
Deer 189 200 234 200 230 0.9
Poultry/eggs 156 169 185 174 185 0.7
Pigs 179 153 167 167 168 0.6
Value of livestock change 70 87 200 (30 ) (30 ) (0.1)
Total Gross Revenue 19,600 22,089 22,995 21,826 26,667 100.0
1 All data estimated.
Source: Ministry for Primary Industries
17Industrial Structure and Principal Economic Sectors
Forestry Fishing is a major New Zealand industry and an important
Forestry and logging makes up around 1.0% of GDP and is the basis merchandise export earner. Fish and other seafood accounted for
of an important export industry. Almost 70% of wood from the $1.4 billion in export revenues in the year ended November 2014,
planted production forests is exported in a variety of forms, including up by 2.5% from the previous year.
logs, wood chips, sawn timber, panel products, pulp and paper, and The most important export species are green-lipped mussels,
further manufactured wooden products such as furniture. salmon, hoki, mackerel, squid and tuna. Smaller volume but
For the year ended June 2014, the value of exports of forestry high value exports are rock lobster, abalone and orange roughy.
products was $5.1 billion, 10.0% of New Zealand’s total goods The main export markets are China, Hong Kong, Australia, the
exports. China, Australia, South Korea and Japan were the largest United States and Japan. Around 80% of export volumes are from
markets for forestry products. China was the largest market for wild capture with the remainder from aquaculture. Ninety percent
logs and wood chips, sawn timber and pulp. Japan was the largest of New Zealand’s commercial seafood production is exported.
market for panels and Australia the largest market for paper and The conservation and management of the fisheries is based on
paperboard. a quota management system designed to protect the future
New Zealand’s climate and soils are well-suited to the growth sustainability of the fisheries while facilitating their optimum
of planted production forests. These forests cover an area of economic use. The system uses markets, together with scientific
1.8 million hectares and produce over 99% of the country’s assessments of fish stocks, to allocate fishing rights without
wood. Radiata pine, which makes up 90% of the plantation estate, arbitrarily restricting fishing methods. With quotas fully allocated,
matures in 25 to 30 years, more than twice as fast as in its natural forecast future growth in wild capture seafood exports is modest.
habitat of California. This species has had considerable research Stronger growth is expected in aquaculture exports, as salmon
investment and has demonstrated its versatility for a wide range farm capacity expands.
of uses. The second most important species is Douglas fir, which Energy and Minerals
makes up 6% of the planted forest area.
New Zealand has significant natural energy resources, with
For the year ended June 2014, an estimated 30.1 million cubic good reserves of coal, natural gas and oil/condensate, extensive
metres of wood were harvested from production forests, geothermal fields, and a geography and climate which have
representing an increase of 55% over the last five years and the supported substantial developments of hydro-electric and wind
largest production volume on record. Wood availability is forecast power. The main minerals mined are coal, gold, silver, ironsand,
to be relatively stable at 26 to 28 million cubic metres a year up various industrial minerals and gravel for construction.
to 2016. Wood availability is then forecast to increase rapidly
Programmes for the exploitation of New Zealand’s energy
to 35 million cubic metres per annum between 2016 and 2025.
resources were accelerated after the first oil shock in 1973. Oil
Market conditions and logistical constraints (availability of logging
and gas exploration was increased and energy conservation
crews, transport and wood processing capacity) will dictate how
programmes were developed and promoted. As a result,
quickly the additional wood can be harvested. Capacity in logging
New Zealand is able to meet a significant proportion of its overall
and wood processing is expected to expand over the coming years.
energy requirements from domestic sources.
Logs, wood and wood article export values fell 2.0% in the year to
There is a renewed interest in the development of energy and
November 2014 due to declines in the price of forestry products
mineral resources to contribute to economic growth. Since 2012,
and the volume of forestry exports, as the downturn in the
an annual permitting round has been used exclusively for allocating
Chinese housing market and a high level of inventories in China
petroleum exploration permits. The EEZ and Continental Shelf
weighed on demand. Nevertheless, the price of forestry products
Act was passed in 2012 and requires all petroleum and mineral
remained at an historically high level after peaking in April 2014,
operations within the exclusive economic zone and continental
and global forestry prices and demand are expected to pick up
shelf to seek consent from the Environmental Protection
further in 2015 on the back of further economic stimulus measures
Authority. Within New Zealand’s territorial waters, operators must
in China. Meanwhile, relatively low supply from other forestry
seek permits under the Resource Management Act.
exporters is also expected to support global prices in 2015.
Natural Gas: Natural gas is currently produced from 16 fields and
Fishing
wells in the Taranaki region of the North Island, with production
New Zealand has an Exclusive Economic Zone (EEZ) of 4.1 million dominated by the inshore Pohokura oil and gas field, the long-
square kilometres supporting a wide variety of inshore fish, standing offshore Maui field and smaller onshore fields. There are
some large deep-water fin fish, squid and tuna. New Zealand’s three main uses for gas in New Zealand: electricity generation,
unpolluted coastal waters are also well-suited to aquaculture. The petrochemical production and fuel for industrial sectors.
main species farmed are Pacific oyster, green-lipped mussels and
quinnat salmon.
18You can also read