New Zealand Economic and Financial Overview 2004 - The ...
←
→
Page content transcription
If your browser does not render page correctly, please read the page content below

New Zealand
                 Economic and Financial

                 Overview

                 2004

Abel Tasman National Park - Wharariki Beach. Andris Apse

ISSN: 1173 - 2334
Ta b l e                of C o n t e n t s

                                     3        Sum m a r y
                                     5        Se le c t e d Stati sti cal an d F i n an ci al D ata
                                     7        N e w Ze a la n d
                                     7        Area and Population
                                     7        Form of Government
                                     8        Social Framework
                                     8        The Treaty of Waitangi
                                     9        Foreign Relations and External Trade
                                     9        Membership in International Economic Organisat ions
                                     11       The Ec onom y o f N ew Z eal an d
                                     11       Introduction
                                     11       Background
                                     12       Recent Developments and Outlook
                                     12       Fiscal Policy
                                     13       Direct Public Debt
                                     14       National Accounts
                                     16       Prices and Costs
                                     17       Labour Markets
                                     19       Indus t r ia l S tru ctu re an d P ri n ci p al E co n o m i c S ecto rs
                                     19       Primary Industries
                                     22       Manufacturing
                                     22       Service Industries
                                     27       Ex t e r na l Secto r
                                     27       External Trade
                                     31       Foreign Investment Policy
                                     32       Balance of Payments
                                     34       Foreign-Exchange Rates and Overseas Reserves
                                                                                      37        B an ki n g an d B u si n ess E n vi ro n m en t
                                                                                      37        Supervision of the Financial Sector
                                                                                      38        Business Law Environment
                                                                                      39        M o n etary P o l i cy
                                                                                      40        Interest Rates and Money and Credit Aggregates
                    F U RT H E R I N F O R M AT I O N
                                                                                      43        P u b l i c F i n an ce an d F i scal P o l i cy
Unless otherwise specified, all monetary units in this                                43        Public Sector Financial System
Overview are New Zealand dollars. The mid-point                                       43        Public Sector Financial Management
rate on 31 January 2004 was NZ$1 = US$0.6728.
                                                                                      46        Current Fiscal Position and 2003 Budget
The fiscal year of the Government of New Zealand                                      48        Taxation
ends on 30 June.                                                                      49        G o vern m en t E n terp ri ses
                                                                                      49        State-Owned Enterprises
Spelling and punctuation conform to usage in New
                                                                                      49        Crown Entities
Zealand and have not been adjusted to conform to
usage in the United States or any particular external                                 50        Performance of Government Enterprises
market.                                                                               53        D i rect P u b l i c D eb t
                                                                                      53        Debt Management Objectives
Where figures in tables have been rounded, totals
                                                                                      53        Debt Record
listed may not equal the sum of the figures.
                                                                                      54        Summary of Direct Public Debt
In tables, NA = Not Available.                                                        54        Public Debt by Currency of Payment
                                                                                      55        Interest and Principal Requirements
This Overview is based on data available as at
                                                                                      57        T ab l es an d S u p p l em en tary I n fo rm ati o n
January 2004.

                                                                           2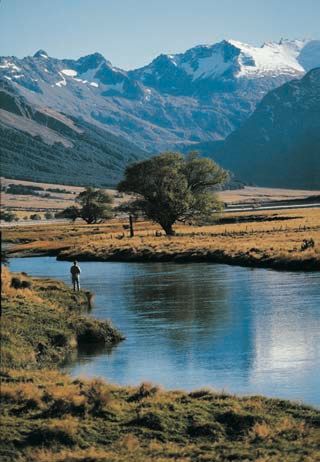
Introduction

    New Zealand is a parliamentary democracy situated in the South Pacific. It has a population of nearly 4 million in a
    country similar in size to Japan. New Zealand has a market economy with sizeable manufacturing and services
    sectors complementing a highly efficient export-oriented agricultural sector. Energy-based industries, forestry, mining,
    horticulture and tourism have expanded rapidly over the past two decades. Pastoral agriculture and commodity
    exports remain important to the country but the significance of the service sector relative to primary production and
    manufacturing continues to grow.

Economy

    Over the last two decades the New Zealand economy has changed from being one of the most regulated in the OECD
    to one of the most deregulated. The minority Labour-led Coalition Government elected in July 2002 aims to foster
    the transformation of New Zealand into a leading knowledge-based economy with high skills, high employment and
    high value-added production.

    The New Zealand economy grew strongly in the mid-1990s. Over the latter half of 1997 and early 1998, however,
    the economy slipped into recession with the twin "shocks" of the Asian economic downturn and a summer drought
    occurring at the same time as the economy was slowing. The fall in activity was short-lived with the economy
                                                      recovering through the second half of 1998 and 1999. The economy
                                                      grew 4% in calendar 1999 and 3.8% in 2000.
     Summary
                                                      In the context of global developments, the economy performed
                                                      strongly in 2001, and growth accelerated in 2002 and became more
                                                      broad-based. Economic growth eased in the first half of 2003 due
    to a number of temporary setbacks. These included travel disruptions and uncertainty due to the conflict in Iraq,
    the outbreak of Severe Acute Respiratory Syndrome (SARS) and the effect of dry weather on electricity production
    and farm output. Growth bounced back, however, in the September quarter with a quarterly growth rate of 1.5%.
    In annual average terms, economic growth was 3.9% in the year to September 2003. The main sources underlying
    growth over the past year were household and business spending with net exports contributing less to growth than
    in previous years.

    Household and business spending are likely to continue to be the main sources of GDP growth for several quarters,
    although their impetus is expected to lessen. The current momentum of household spending is being supported by
    relatively low interest rates, a strong labour market, rising house prices and migration. With export earnings expected
    to remain under pressure in the short run because of the higher exchange rate and also because it will take time
    for a global economic recovery to translate into increased demand for New Zealand's exports, growth is expected
    to moderate. Signs of improvement in the external sector are expected to appear in late 2004.

    Annual CPI inflation was 1.5% in the September 2003 quarter and is currently in the bottom half of the Reserve Bank
    of New Zealand's (RBNZ) target range of 1% to 3%. Inflation is expected to remain within the lower part of the band
    for the coming year. Tradeable inflation is expected to remain low due to the appreciation of the exchange rate,
    while non-tradeable inflation is likely to remain around current levels due to the strength of domestic demand.

    While New Zealand had been running current account deficits of 5% to 7% of GDP during the latter half of the 1990s,
    the current account deficit fell to 2.3% of GDP in the March 2002 year. Strong domestic demand and the rise in the
    exchange rate contributed to the current account deficit increasing to 4.6% of GDP in the September 2003 year.

                                                           3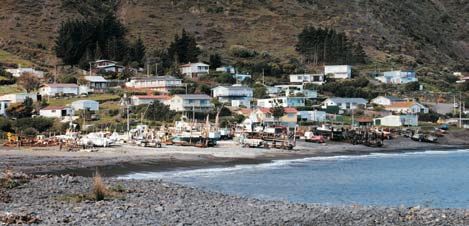
Su mma r y / c o n t in u e d
Over the last decade, New Zealand's current account deficit has predominantly been a story of payments to non-
residents, who have built up substantial direct investment in New Zealand. While the trade balance has generally
been in surplus, the deficit on the investment income balance has been equivalent to around 7% of GDP.
Macroeconomic Policy
In the area of macroeconomic policy, the Reserve Bank Act (1989) and the Fiscal Responsibility Act (1994) continue
to set the framework.
Monetary Policy
The focus of monetary policy is on maintaining price stability. A Policy Targets Agreement between the Governor
of the Reserve Bank and the Minister of Finance sets out the specific targets for maintaining price stability, while
seeking to avoid unnecessary instability in output, interest rates and the exchange rate. The current Agreement
was signed in September 2002 with the appointment of a new RBNZ Governor. The key changes to the Agreement
were the increase in the price stability target floor to 1% (from 0% previously) while the price stability target ceiling
remains unchanged at 3%, and a focus on inflation outcomes over the medium term. Overall, these changes to
the Agreement do not substantially change the way monetary policy is conducted but add a little more flexibility
to allow greater stability of monetary policy outcomes over the medium term.
Fiscal Policy
On the fiscal front, the 1990s saw a consolidation of the countrys fiscal position with the Fiscal Responsibility
Act ensuring that fiscal policy is prudent and transparent. The Government remains committed to maintaining a
sound fiscal position.
In 2002/03, a surplus on the Government operating balance of $1,966 million was achieved ($5,580 million once
liability revaluation movements are excluded). This compares with a surplus of $2,391 million in 2001/02 and
$1,358 million in 2000/01. An operating surplus of $6,092 million is forecast for 2003/04 (or $5,207 million once
liability revaluation movements are excluded).
The Governments fiscal policy approach is based on an assessment of the current state of government finances,
the emergence of future spending pressures, particularly those associated with ageing, and the potential impact
of shorter-term influences. At a summary level, the Governments fiscal approach is to:
l run operating surpluses on average across the economic cycle sufficient to meet New Zealand Superannuation
Fund contributions;
l meet capital pressures and priorities; and
l manage debt at prudent levels.
More formal objectives on key fiscal aggregates sit behind the summary statement.
Direct Public Debt
At 30 June 2003, New Zealands gross direct public debt was $38.2 billion, or 29.8% of estimated GDP. At the
same date, public sector foreign-currency debt was $4.5 billion, and interest charges on foreign-currency debt
were $217 million. The Government has no net foreign-currency debt.
4
SEL EC T ED STAT I ST I C AL
AN D F I N AN C I AL D ATA
Statistical Data
1999 2000 2001 2002 2003
(dollar amounts in millions)
Gross Domestic Product at Current Prices(1)(2) 101,938 107,403 113,875 122,904 127,769
Annual % Increase (Decrease) in Real GDP(1)(2)(3) 0.4% 4.9% 2.7% 3.3% 4.5%
Population (thousands)(4) 3,835.1 3,857.8 3,880.5 3,939.1 4,009.5
Unemployment Rate(5) 7.0% 6.2% 5.3% 5.2% 4.7%
Change in Consumer Price Index(6) (0.4%) 2.0% 3.2% 2.8% 1.5%
Exchange Rate(7) 0.5327 0.4699 0.4148 0.4897 0.5809
90-Day Bank Bill Rate(8) 4.74% 6.88% 5.82% 5.96% 5.23%
10 Year Government Loan Stock Rate(8) 6.51% 6.85% 6.63% 6.64% 5.23%
Terms of Trade Index(2)(9) 959 942 1,057 982 1,007
Current Account Deficit as a % of GDP(1)(2) (4.3%) (6.7%) (4.1%) (2.3%) (4.0%)
Government Finance(10)
Year ended 30 June 1998/99 1999/2000 2000/01 2001/02 2002/03 2003/04 (11)
(dollar amounts in millions)
Total Revenue 41,985 41,557 45,506 49,979 57,027 59,522
Total Expenses 40,280 40,128 44,213 47,653 55,224 53,508
Miscellaneous Items 58 74 65 65 163 78
Operating Balance 1,763 1,503 1,358 2,391 1,966 6,092
% of GDP 1.7% 1.4% 1.2% 1.9% 1.5% 4.5%
OBERAC(12) 246 884 2,115 2,751 5,580 5,207
Crown Net Worth 6,022 8,583 11,463 18,820 23,781 29,920
Net Direct Domestic Borrowing (190) (1,027) 961 885 (973) -
Net Direct Overseas Borrowing (893) (158) (474) (466) 1,381 -
Direct Public Debt
Internal Funded Debt 25,644.7 25,318.0 26,204.5 27,507.4 27,540.6 -
Internal Floating Debt 5,980.0 5,500.0 5,675.0 5,521.0 5,700.0 -
External Debt 5,810.1 6,575.8 6,518.5 5,120.3 4,997.4 -
Total Direct Public Debt 37,434.8 37,393.8 38,398.0 38,148.7 38,238.0 -
(1) Year ended 31 March.
(2) 2003 data provisional. Prior years data revised.
(3) Production based chain volume series expressed in 1995/96 prices. Base = 100.
(4) June year.
(5) June quarter, seasonally adjusted.
(6) Annual percentage change, June quarter.
(7) US$ per NZ$ monthly average for June.
(8) June monthly average.
(9) Year ended 30 June. Base: June quarter 2002 = 1000.
(10) This table is prepared in accordance with New Zealand Generally Accepted Accounting Practice (GAAP).
(11) 2003/04 Budget revisions announced 18 December 2003.
(12) Operating Balance Excluding Revaluations and Accounting Changes.
Note: The above data is presented in a standardised format to facilitate comparisons with previous years. In some cases, later
data can be found in the relevant text or tables.
5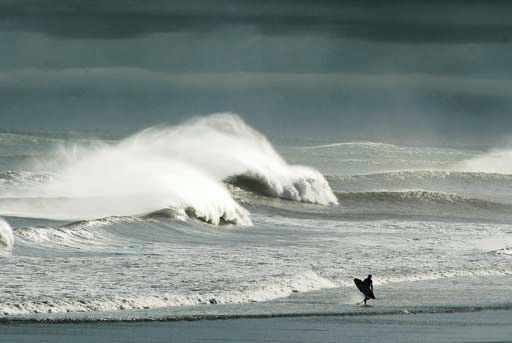
WHANGAREI

             NORTH

                                                  AUCKLAND

                                                                 TAURANGA
                                                         HAMILTON
WEST                             EAST                           ROTORUA

                                                                                  GISBORNE
                                                                          TAUPO

                                        NEW PLYMOUTH
            SOUTH

                                                                       NAPIER
                                                                      HASTINGS
                                                     WANGANUI

                                               PALMERSTON NORTH

                                                                      MASTERTON

                                        NELSON              WELLINGTON
                                              BLENHEIM

                     GREYMOUTH

                                                                    N E W
                                                                     Z E A L A N D
                                               CHRISTCHURCH

                                   TIMARU

                        OAMARU

       QUEENSTOWN

                       DUNEDIN

               INVERCARGILL

                                                 6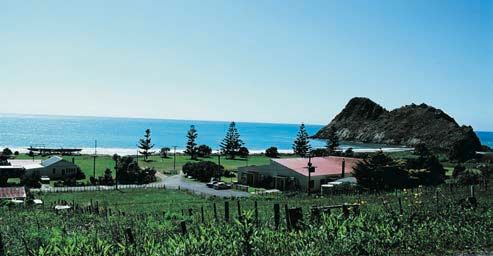
New Zealand

Ar ea    and        P opul at i on
    New Zealand is situated in the South Pacific Ocean, 6,500 kilometres (4,000 miles) south-southwest of Hawaii and
    1,900 kilometres (1,200 miles) to the east of Australia. With a land area of 268,000 square kilometres (103,000
    square miles), it is similar in size to Japan or Britain. It is comprised of two main adjacent islands, the North Island
    and South Island, and a number of small outlying islands. Because these islands are widely dispersed, New Zealand
    has a relatively large exclusive maritime economic zone of 3.1 million nautical square kilometres.

    Over half of New Zealand's total land area is pasture and arable land, and more than a quarter is under forest cover,
    including 1.7 million hectares of planted production forest. It is predominantly mountainous and hilly, with 13% of
    the total area consisting of alpine terrain, including many peaks exceeding 3,000 metres (9,800 feet). Lakes and
    rivers cover 1% of the land. Most of the rivers are swift and seldom navigable, but many are valuable sources of
    hydro-electric power. The climate is temperate and relatively mild.

    New Zealand's resident population at 30 June 2003 is estimated at 4,009,580. With an estimated population of
    1,291,000 people, the Greater Auckland Region is home to 32 out of every 100 New Zealanders and is the fastest
    growing region in the country.

    New Zealand has a highly urbanised population with around 72% of the resident population living in urban entities
    with 10,000 or more people. Over half of all New Zealanders live in the five main urban areas of Auckland (1,199,500),
    Hamilton (179,000), Wellington (363,400), Christchurch (343,700) and Dunedin (113,800).

    The population is heavily concentrated in the northern half of the North Island (52%), with the remaining population
    evenly spread between the southern half of the North Island (24%) and the South Island (24%).

For m     of     Gov ernm ent
    New Zealand is a sovereign state with a democratic parliamentary government based on the Westminster system.
    Its constitutional history dates back to the signing of the Treaty of Waitangi in 1840, when the indigenous Maori
    people ceded sovereignty over New Zealand to the British Queen. The New Zealand Constitution Act 1852 provided
    for the establishment of a Parliament with an elected House of Representatives. Universal suffrage was introduced
    in 1893. Like Canada and Australia, New Zealand has the British monarch as titular Head of State. The Queen is
    represented in New Zealand by the Governor-General, appointed by her on the advice of the New Zealand Government.

    As in the United Kingdom, constitutional practice in New Zealand is an accumulation of convention, precedent and
    tradition, and there is no single document that can be termed the New Zealand constitution. The Constitution Act
    1986 has, however, updated, clarified and brought together in one piece of legislation the most important constitutional
    provisions that had been enacted in various statutes. It provides for a legislative body, an executive and administrative
    structure and specific protection for the judiciary.

    Legislative power is vested in Parliament, a unicameral body designated the House of Representatives. It currently
    has 120 members, who are elected for three-year terms through general elections at which all residents over 18
    years of age are entitled to vote. Authority for raising revenue by taxation and for expenditure of public money must
    be granted by Parliament. Parliament also controls the Government by its power to pass a resolution of no confidence
    or to reject a Government proposal made a matter of confidence, in which event the Government would be expected
    to resign.

    The executive Government of New Zealand is carried out by the Executive Council. This is a formal body made up
    of the Cabinet and the Governor-General, who acts on the Cabinet's advice. The Cabinet itself consists of the Prime
    Minister and his/her Ministers, who must be chosen from among elected Members of Parliament. Each Minister
    supervises and is responsible for particular areas of Government administration. Collectively, the Cabinet is
    responsible for all decisions of the Government.

    As a result of a referendum held in conjunction with the 1993 election, New Zealand changed from a "First Past the
    Post" (FPP) system of electing Members of Parliament to a "Mixed Member Proportional" (MMP) system of proportional
    representation. MMP is similar to the German Federal system of election to the Lower House. Under MMP, the total
    number of seats each party has in Parliament is proportional to that party's share of the total list vote. Around half
    of all Members of Parliament are elected directly as electorate representatives as under the FPP system. The
    remaining members are chosen by the parties from party lists. This change was put in place for the 1996 election.

                                                           7
At the last six general elections, the distribution of seats in Parliament among the principal parties was as follows:
                                            1987           1990            1993            1996            1999           2002
        Labour Party                         57              29              45              37              49             52
        National Party                        40             67              50              44              39             27
        New Zealand First                      -              -               2              17               5             13
        Progressive Coalition
         (previously Alliance)                 -              -               2              13              10              2
        ACT                                    -              -               -               8               9              9
        Green Party                            -              -               -               -               7              9
        United Future (previously United)      -              -               -               1               1              8
        Other                                  -              1               -               -               -              -

        TOTAL                                 97             97              99             120             120            120

        Following the general election in July 2002, seven political parties are represented in Parliament. The Labour Party
        and the Progressive Coalition formed a minority Coalition Government after the election. The United Future Party
        has pledged to support the Coalition on confidence and supply. An arrangement has also been reached with the
        Green Party for co-operation on a range of policy and legislative matters (excluding confidence and supply). The
        Right Honourable Helen Clark, the Leader of the Labour Party, is Prime Minister and the Honourable Michael Cullen,
        Deputy Leader of Labour, is Deputy Prime Minister.

        The judicial system in New Zealand is based on the British model. By convention and the Constitution Act 1986,
        the judiciary is independent from the executive.

So cial           Fr am ework
        New Zealand has a high degree of social and political stability and a modern social welfare system which includes
        universal entitlement to primary and secondary education and subsidised access to health services for all residents.
        The population is mainly European with 80% of residents designating themselves as being of European descent,
        14.7% as New Zealand Maori, 6.5% as Pacific Islanders, 6.6% as Asian and 0.7% as other. (Note: Census
        respondents are able to give multiple responses to ethnicity questions, hence the number of responses is greater
        than the total population). There is a high incidence of intermarriage among these groups. The majority of Europeans
        are of British descent, while the NZ Maori are of the same ethnic origin as the indigenous populations of Tahiti,
        Hawaii and several other Pacific Islands. In recent years there has been an increasing level of immigration from
        Asian countries.

        The principal social services financed by the Government are health and education, income support for low and
        middle income families, and a range of benefits and pensions, including New Zealand Superannuation and the
        unemployment, single parent, sickness and invalid benefits. The publicly-funded social services are augmented by
        privately-financed schools, health services, pension plans and philanthropic services.

T h e      Trea ty            of      Wai t angi
        The Treaty of Waitangi is regarded as a founding document of New Zealand. First signed at Waitangi on 6 February
        1840, the Treaty is an agreement between Maori and the British Crown and affirms for Maori their status as the
        indigenous people of New Zealand.

        The Treaty comprises three articles. The first grants to the Queen of England the right to "govern" New Zealand
        while the second article guarantees Maori possession of their lands, forests, fisheries and other resources. The third
        and final article gives Maori all the citizenship rights of British subjects. There are outstanding claims by Maori that
        the Crown has breached the Treaty, particularly the guarantees under the second article, which are for Maori and
        the Crown to resolve.

        Since 1992, the Government has developed processes and polices to enable the Crown and Maori to settle any
        Treaty of Waitangi claim relating to events before September 1992.

                                                                      8
Fo reign       Rel at i ons
   New Zealand foreign policy seeks to influence the international environment to promote New Zealand's interests and
   values, and to contribute to a stable, peaceful and prosperous world. It is thus a policy of constructive international
   engagement. In seeking to make its voice heard abroad, New Zealand aims to advance and protect both its security
   and prosperity interests.

   Trade is essential to New Zealand's economic prosperity. Exports of goods and services make up over 30% of
   New Zealand's GDP. New Zealand's interests are well diversified. Australia, North America, the European Union,
   and East Asia each take between 15% and 30% of New Zealand's exports. New Zealand remains reliant in exports
   of commodity-based products as a main source of export receipts and relies on imports of raw materials and capital
   equipment for industry.

   New Zealand is committed to a multi-track trade policy:

   l   multilateral trade liberalisation through the World Trade Organisation (WTO);

   l   regional co-operation and liberalisation through active membership of such fora as the Asia Pacific Economic
       Cooperation (APEC);

   l   bilateral trade arrangements such as the Closer Economic Relations (CER) agreement with Australia and the
       Pacific Three Agreement currently being negotiated between New Zealand, Singapore and Chile. Similar
       arrangements with other economies are being actively pursued;

   l   there is also a focus on building regional relationships, such as through the Latin American strategy and the
       Seriously Asia programme.

   New Zealand remains committed to a reduction of world-wide trade barriers. Tariffs have been systematically reduced
   and quantitative controls on imported goods eliminated. Currently around 95% of goods come into New Zealand
   tariff free, including all goods from Least Developed Countries.

   New Zealand was active in laying the foundations for the Doha round of WTO negotiations. Agriculture and services
   are of prime importance to the New Zealand economy and agriculture in particular is central to the Doha negotiations.
   New Zealand will be working with other like-minded countries to reduce barriers to trade in goods and services and
   provide improved market access for New Zealand exporters.

   New Zealand, as a member of APEC, is committed to achieving APEC's goals of free trade and investment by 2010
   for developed economies (2020 for developing economies). Asia-Pacific regional linkages remain at the core of
   New Zealand's political and economic interests. The countries of APEC take more than 70% of New Zealand's
   exports. They provide 70% of New Zealand's tourist visitors and 80% of New Zealand's investment.

Membership in International Economic Organisations
   New Zealand is a long-standing member of the Organisation for Economic Cooperation and Development (OECD),
   the International Monetary Fund (IMF), and the International Bank for Reconstruction and Development (World Bank).

   Other major international economic organisations of which New Zealand is an active member include the International
   Finance Corporation, the International Development Association, the Asian Development Bank and the European
   Bank for Reconstruction and Development. New Zealand is also a contracting party to the World Trade Organisation.

                                                          9
Whale Rider
The New Zealand film industry has been in the
international spotlight in recent years for large budget
movies such as The Lord of the Rings (see pages
41 and 42) and The Last Samurai, not to mention a
spate of other overseas funded movies currently in
production here.
At the same time the home-grown low budget
production, Whale Rider has taken overseas
audiences by storm.
Whale Rider star, Keisha Castle-Hughes, aged just 11 when the movie
was made, became the youngest ever person to be nominated for a Best
Actress Oscar. Fotopress
Whangara, a small township on the East Coast of the North Island, home of Whale Rider author Witi Ihimaera and location for the movie.
Whangara is the home of the whale rider legend on which the movie is based. © South Pacific Pictures Limited 2002
Whangara Beach in a more sombre mood. Fotopress
10The Economy of N e w Z e a l a n d
Intr od uc t i on
New Zealand has a mixed economy which operates on free market principles. It has sizable manufacturing and
service sectors complementing a highly efficient agricultural sector. The economy is strongly trade-oriented, with
exports of goods and services accounting for around 33% of total output.
B ackg round
New Zealand emerged from World War II with an expanding and successful agriculture-based economy. In the 1950s
and 1960s, a period of sustained full employment, GDP grew at an average annual rate of 4%. Agricultural prices
remained high, due in part to a boom in the wool industry during the Korean War. However, even during this period
there were signs of weakness. In 1962, the Economic and Monetary Council advised the Government that between
1949 and 1960 New Zealand's productivity growth had been one of the lowest amongst the world's highest earning
economies.
In the late 1960s, faced with growing balance of payments problems, successive Governments sought to maintain
New Zealand's high standard of living with increased levels of overseas borrowing and increasingly protective
economic policies.
Problems mounted for the New Zealand economy in the 1970s. Access into key world markets for agricultural
commodities became increasingly difficult. The sharp rises in international oil prices in 1973 and 1974 coincided
with falls in prices received for exports. As in many OECD countries, policies in New Zealand were principally aimed
at maintaining a high level of economic activity and employment in the short term. High levels of protection of
domestic industry had greatly undermined competitiveness and the economy's ability to adapt to the changing world
environment. The combination of expansionary macro policies and industrial assistance led to macroeconomic
imbalances, structural adjustment problems and a rapid rise in government indebtedness. After the next major shift
in oil and commodity prices in 1979 and 1980, New Zealand's position deteriorated further.
From around 1984 onwards, the direction of economic policy in New Zealand turned away from intervention toward
the elimination of many forms of government assistance. On the macroeconomic level, policies have aimed at
achieving low inflation and a sound fiscal position while microeconomic reforms have been intended to open the
economy to competitive pressures and world prices.
The reforms included the floating of the exchange rate; abolition of controls on capital movements; the ending of
industry assistance; the removal of price controls; deregulation across a number of sectors of the economy;
corporatisation and privatisation of state-owned assets; and labour market legislation aimed at facilitating more
flexible patterns of wage bargaining.
The 1990s
New Zealand's economic performance improved significantly over the 1990s. From mid-1991 the economy grew
strongly, with particularly strong output growth from 1993 to 1996.
The slowdown in key Asian trading partners during the latter part of 1997 and through 1998 took a toll on economic
activity. Together with a drought that affected large parts of the country over the 1997/98 and 1998/99 summers,
the "Asian crisis" caused the economy to contract over the three quarters to March 1998.
In the following period, the economy experienced broad-based growth, including two periods of above average growth.
The first began in second half of 1999 as the economy came out of recession with annual average growth peaking
at around 5% in 2000. Economic growth slowed markedly over 2001 as some of the factors supporting growth in
the prior period unwound. However, the economy regained momentum, with a combination of two good agricultural
seasons, relatively high world prices for New Zealand's export commodities, a low exchange rate and a robust labour
market contributing to strong income flows throughout the economy. Over the decade to the end of 2002, real GDP
growth averaged 3.6%.
Since the mid-1970s, New Zealand has consistently run a deficit on its external accounts. In the 1991-1994 period,
the annual current account deficit was moderate, remaining in the range of around 3% to 4% of GDP. From the mid-
1990s, the current account deficit increased, reaching approximately 7% of GDP in 1997 and again in 2000. The
first dip was caused by the international income deficit increasing, while the second was due to a turnaround in the
11merchandise trade balance, which went from surplus to deficit. This investment income deficit reflects the servicing
of the country's large net external liability position, which at 31 March 2003 stood at around 77% of GDP.
New Zealand's strong banking system, sound fiscal position and floating exchange rate, together with the role of
foreign direct investment in building up external liabilities, means that concerns about the size of the current account
deficit needs to be kept in perspective. However, a large current account deficit does make any economy vulnerable
to changes in financial market sentiment.
Following a period of large and persistent fiscal deficits, New Zealand's fiscal position improved over the first part
of the 1990s, assisted by fiscal consolidation and the economic recovery. In 1990/91, the country was running a
fiscal deficit equivalent to nearly 3% of GDP. With the surplus recorded in 2002/03, New Zealand's fiscal position
has now been in surplus for ten years.
R e ce nt De v el opm ent s an d O u t lo o k
After a pause in growth over 2001 when growth slowed to around 2½%, the economy accelerated over 2002 with
calendar year annual average growth reaching 4.4%. More recently economic growth eased with quarterly growth
of 0.7% and 0.3% being recorded for the March and June 2003 quarters respectively. This resulted in the economy
growing 4.2% for the year to June 2003. September quarter growth of 1.5% illustrates that the economy has bounced
back from a number of temporary setbacks earlier in the year. These included travel disruptions and uncertainty
due to the conflict in Iraq, the outbreak of Severe Acute Respiratory Syndrome (SARS), and the effects of dry weather
on electricity production and farm output.
The main sources underlying growth over the last year were household and business spending, with net exports
contributing less to growth than in previous years. Over the year to March 2004, the annual average rate of economic
growth is expected to slow to just under 3%. Household and business spending are likely to continue to be the main
sources of GDP growth for several quarters, although their impetus will begin to lessen. The current momentum of
household spending is being supported by relatively low interest rates, the delayed effects of steady employment
growth, rising house prices, and migration.
Export earnings are expected to remain under pressure in the short run because of the higher exchange rate and
because it will take time for a global economic recovery to translate into increased demand for New Zealand's exports.
Signs of improvement in the external sector are expected to appear in late 2004. Given the balance of domestically-
oriented spending and export revenue, the annual current account deficit is expected to exceed 5% of GDP by March
2004. Some rebalancing of the drivers of growth is expected as 2004 progresses, in line with slowing domestic
demand growth and recovering exports.
Annual CPI inflation is currently in the bottom half of the 1% to 3% band set by the Policy Targets Agreement, and
is expected to remain within the lower part of the band for the coming year. Tradable inflation is expected to remain
low due to the appreciation of the exchange rate, while non-tradable inflation will likely remain around current levels
due to the strength of domestic demand.
The risks and uncertainties around this outlook look to revolve around domestic or New Zealand specific factors.
This is in contrast to the last few years when global developments were key. On the basis that the global recovery
continues, household behaviour, particularly their resilience or vulnerability to shocks, will be an important driver
of developments. The impact of the rise in the exchange rate is another key driver.
F i s ca l Po l i c y
Prudent Fiscal Management: The Fiscal Responsibility Act
In 1994, the Government enacted the Fiscal Responsibility Act. The Act is intended to assist in achieving consistent
good quality fiscal management over time. Good quality fiscal management should enable the Government to make
a major contribution to the economic health of the country and be better positioned to provide a range of services
on a sustained basis.
The Act requires the Crown's financial reporting to be in accordance with New Zealand Generally Accepted Accounting
Practice. The primary fiscal indicators are the operating balance, debt and net worth.
The Fiscal Responsibility Act requires the Government to pursue its policy objectives in accordance with the principles
of responsible fiscal management set out in the Act. These include:
l reducing debt to prudent levels to provide a buffer against future adverse events;
12l maintaining, on average, operating balance once prudent debt levels are reached i.e., the Government is to live
within its means over time, with some scope for flexibility through the business cycle;
l achieving and maintaining levels of net worth to provide a buffer against adverse events;
l managing the risks facing the Crown; and
l pursuing policies that are consistent with a reasonable degree of predictability about the level and stability of
future tax rates.
Key Fiscal Indicators
Operating Balance: Following a prolonged period of fiscal deficits, New Zealand achieved an operating balance
surplus in 1993/94 and has remained in surplus since then. The initial improvement in the operating balance from
1993/94 onwards reflected a growing economy, increasing tax revenues and firm expense control. Subsequent
reductions in the operating balance reflect two rounds of tax reductions, lower nominal economic growth over the
1997/98 year which reduced tax revenue growth, and changes in accounting policy. Operating balances have started
to increase again from 2000, reflecting the current intention of building structural surpluses to assist in pre-funding
future demographic pressures.
Core Crown operating expenses have been reduced as a percentage of GDP from over 40% in 1992/93 to 32.4% in
2002/03. Expenses have been controlled with output budgeting, accrual reporting and decentralised cost management.
In 2002/03, the operating balance was $2.0 billion. Operating surpluses are expected to continue over the forecast
period. Forecasts for 2003/04, 2004/05, 2005/06, 2006/07 and 2007/08 are $6.1 billion, $6.3 billion, $5.8 billion,
$5.9 billion and $6.2 billion respectively. Core Crown expenses as a percentage of GDP are expected to fall to
around 31.1% by 2007/08.
The operating balance result of $2.0 billion for 2002/03 includes liability valuation movements. If such valuation
movements are excluded, the operating balance is $5.6 billion, reflecting a steady increase over the last three years.
Net debt: Net debt has fallen from 49% of GDP in 1992/93 to 13.0% in 2002/03. Debt repayments have been
financed from operating surpluses and, prior to 2000, asset sales proceeds. Looking forward, net debt is projected
to fall to around 8.1% of GDP by 2007/08. From 2002/03 onwards, it is assumed that surpluses will contribute to
building up financial assets to begin pre-funding future superannuation costs rather than solely paying down debt.
These assets do not form part of net debt. The cumulative contributions toward pre-funding (including ongoing
revenue earned on the contributions) are estimated to reach around 9% of GDP in 2007/08.
Net worth: New worth increased from -$7.7 billion in 1992/93 to $9.9 billion in 1997/98. In 1998/99, net worth fell
to around $6 billion. The fall reflected the recognition of the net future costs of already accepted ACC claims
($6.1 billion) partly offset by the $1.8 billion operating surplus. Net worth then increased steadily to $23.8 billion in
2002/03. This improvement reflects the ongoing operating surplus plus revaluations of physical assets. With forecast
operating surpluses, net worth is projected to reach $54.2 billion in 2007/08.
Direct P ubl i c Debt
Prior to March 1985, successive Governments had borrowed under a fixed exchange-rate regime to finance the
balance of payments deficit. Since the adoption of a freely floating exchange-rate regime, Governments have
undertaken new external borrowing only to rebuild the nation's external reserves and to meet refinancing needs.
Direct public debt increased by a net amount of $89 million including swaps between 1 July 2002 and 30 June 2003.
This increase consisted of a net increase in internal debt of $212 million and a net decrease in external debt of
$123 million.
The Government achieved its objective of zero net foreign-currency debt in September 1996 following the sale of
Forestry Corporation of New Zealand for $1.6 billion.
Government gross direct debt amounted to 29.8% of GDP in the year ended June 2003, down from 31.7% the previous
year.
The proceeds from the domestic bond programme will be used to finance maturing domestic term debt during 2003/04
and to pre-fund a portion of the forecast 2004/05 borrowing requirement.
13N a tion al Ac c ount s
In the year to September 2003, the New Zealand economy recorded average annual growth of 3.9%. September
quarter growth was 1.5% following a relatively weak result in the June quarter of 0.3% due in part to adverse climatic
conditions and disruptions to international travel.
The following table shows Gross Domestic Product and Gross National Expenditure in nominal terms for the last five
March years:
Gross Domestic Product and Gross National Expenditure
Year ended 31 March
1999 2000 2001 2002 2003(1)
(dollar amounts in millions)
Compensation of Employees 44,472 45,473 47,606 51,305 54,470
Net Operating Surplus 30,397 33,445 36,501 39,899 40,528
Consumption of Fixed Capital 13,877 14,328 15,294 16,344 17,202
Indirect Taxes 13,484 14,150 14,724 15,527 16,840
Less Subsidies 283 329 358 355 389
Expenditure on Gross Domestic Product 101,938 107,403 113,875 122,904 127,769
Final Consumption Expenditure
General Government 18,664 20,268 20,464 21,953 23,080
Private 63,107 65,667 68,439 71,869 76,509
Physical Increase in Stocks 122 1,373 1,242 1,919 731
Gross Fixed Capital Formation 19,713 21,068 21,541 23,481 25,521
Gross National Expenditure 101,605 108,377 111,685 119,222 125,841
Exports of Goods and Services 30,468 33,488 41,442 43,595 41,836
Less Imports of Goods and Services 30,135 34,462 39,252 39,913 39,907
Expenditure on Gross Domestic Product 101,938 107,403 113,875 122,904 127,769
Real GDP(2) 105.4 110.5 113.5 117.2 122.5
Annual % Increase in Real GDP 0.4% 4.9% 2.7% 3.3% 4.5%
(1) Provisional prior years data revised.
(2) Production based chain-linked volume series expressed in 1995/96 prices. Base = 100.
REAL GROSS DOMESTIC PRODUCT
Percent Change
8
6
4
2
0
-2
SEP SEP SEP SEP SEP SEP SEP SEP
1996 1997 1998 1999 2000 2001 2002 2003
Quarterly (seasonally adjusted) Annual Average
S O U R C E : S TAT I S T I C S N E W Z E A L A N D
14The following table shows Gross Domestic Product by major industries at constant 1995/96 prices.
Gross Domestic Product by Industry Group(1)
Year ended 31 March
1999 2000 2001 2002 2003 2003
% of Total
(dollar amounts in millions)
Finance, Insurance and Business Services, etc 24,792 25,300 25,938 26,866 27,868 24.6
Manufacturing 15,480 16,157 16,478 16,686 17,625 15.5
Personal and Community Services 11,775 12,205 12,674 13,568 13,961 12.3
Transport and Communication 8,590 9,459 10,331 10,994 11,546 10.2
Wholesale Trade 7,695 8,488 8,861 9,185 9,399 8.3
Retail, Accommodation, Restaurants 7,083 7,463 7,619 7,924 8,348 7.4
Agriculture 5,143 5,434 5,534 5,608 5,645 5.0
Construction 4,030 4,587 4,149 4,232 4,722 4.2
Government Administration and Defence 4,177 4,155 4,244 4,313 4,467 3.9
Fishing, Forestry, Mining 2,840 2,931 3,001 3,045 3,197 2.8
Electricity, Gas and Water 2,267 2,188 2,303 2,147 2,335 2.1
Gross Domestic Product 97,694 102,450 105,180 108,665 113,507 100.0
Primary Industries 7,983 8,370 8,540 8,656 8,837 7.8
Goods Producing Industries 21,807 22,950 22,952 23,065 24,693 21.8
Service Industries 64,069 66,876 69,359 72,489 75,199 66.3
(1) 2003 data provisional. Prior years data revised.
GROSS DOMESTIC PRODUCT BY INDUSTRY GROUP
Electricity, Gas and Water
Fishing, Forestry and Mining 2%
3%
Construction
Finance, Insurance and
4%
Business Services, etc
Government Administration and 25%
Defence
4% Agriculture
5%
Retail, Accommodation,
Restaurants
7%
Manufacturing
Wholesale Trade 16%
8%
Transport and
Communication Personal and Community
10% Services
12%
S O U R C E : S TAT I S T I C S N E W Z E A L A N D
15P r ice s and Cos t s
New Zealand experienced a substantial improvement in inflation performance during the 1990s relative to previous
decades. Annual inflation as measured by the Consumers Price Index (CPI) remained below 2% from the December
1991 quarter through to the September 1994 quarter before rising to around 4½% in mid-1995 as the economy
experienced rapid growth. Inflation subsequently bottomed at -0.5% in the year to September 1999 and then peaked
at 4.0% at the end of 2000. Inflation has been trending downwards over 2003.
Annual CPI inflation was 1.5% in the September 2003 quarter, the same as the June quarter result. Behind the
headline number have been diverging trends between tradable and non-tradable inflation. The current strength in
the domestic economy, particularly in the housing market, has resulted in an acceleration in non-tradable inflation
which recorded an annual increase of 4.1% in the September 2003 quarter. In contrast, the current strength in the
currency and discounting in international airline travel has resulted in declines in tradable inflation, which fell 0.9%
in the September 2003 quarter.
Other price measures reflect the current position of the economy. Producer price inflation has been negative recently
reflecting the impact of the higher exchange rate and the declines seen in commodity prices. In contrast, wage
increases have been accelerating at moderate rates reflecting the increasing tightness in the labour market.
The following table shows on a quarterly basis the Terms of Trade Index, the Producers Price Index, the Consumers
Price Index, and the Labour Cost Index and, in each case, the percentage change over the same quarter for the
previous year.
Terms of Trade Producers Price Consumers Price Labour Cost
Index(1) Index(2)(3) Index(4) Index(5)
1999 March 953 (3.2) 994 (0.2) 998 (0.1) 964 1.9
June 959 (0.3) 1001 (0.2) 1000 (0.4) 966 1.5
September 991 1.6 1016 1.3 1004 (0.5) 970 1.4
December 958 (1.1) 1032 3.1 1006 0.5 974 1.6
2000 March 942 (1.2) 1046 5.2 1013 1.5 977 1.3
June 956 (0.3) 1060 5.9 1020 2.0 983 1.8
September 1005 1.4 1101 8.4 1034 3.0 985 1.5
December 1001 4.5 1142 10.7 1046 4.0 990 1.6
2001 March 1057 12.2 1130 8.0 1044 3.1 995 1.8
June 1045 9.3 1146 8.1 1053 3.2 1000 1.7
September 1057 5.2 1169 6.2 1059 2.4 1005 2.0
December 1034 3.3 1163 1.8 1065 1.8 1011 2.1
2002 March 1050 (0.7) 1162 2.8 1071 2.6 1016 2.1
June 1000 (4.3) 1163 1.5 1082 2.8 1021 2.1
September 982 (7.1) 1145 (2.1) 1087 2.6 1028 2.3
November 971 (6.1) 1147 (1.4) 1094 2.7 1033 2.2
2003 March 996 (5.1) 1147 (1.3) 1098 2.5 1039 2.3
June 1007 0.7 1141 (1.9) 1098 1.5 1044 2.3
September 1004 2.2 1146 0.1 1103 1.5 1052 2.3
(1) Base: June quarter 2002 = 1000.
(2) Base: December quarter 1997 = 1000.
(3) All industry inputs.
(4) Base: June quarter 1999=1000.
(5) All industry ordinary time salary and wage. Base: December quarter 1992 = 1000.
16La bo ur M ark et s
New Zealand has a decentralised labour market. Enterprise bargaining predominates in the negotiation of the terms
and conditions of employment. The Employment Relations Act 2000 provides the statutory framework that supports
the building of productive employment relationships. The legislation promotes collective bargaining in various ways,
such as providing that only unions and employers can be parties to collective agreements, and giving employees
the right to strike in pursuit of multi-employer contracts. It also requires the parties to employment relationships
(unions, individual employees and employers) to deal with each other in good faith. At the same time, individual
choice is protected, in terms of freedom of association and union membership and the choice of collective and
individual employment agreements. The legislation promotes mediation to assist in the early resolution of workplace
disputes.
The Government has introduced amendments to strengthen the Act to ensure it is better able to achieve its key
objectives of promoting good faith, collective bargaining and the effective resolution of employment relationship
problems. The Employment Relations Law Reform Bill also provides protective measures for employees affected
by the sale, transfer or contracting out of businesses. Finally, it updates equal pay legislation to reflect the changes
made to the employment relations framework.
A set of minimum employment standards also underpins employment relationships and the more disadvantaged in
the workforce. Legislation here includes the minimum Wage Act, the Equal Pay Act, the Holidays Act and the Parental
Leave and Employment Protection Act.
Employment growth has been strong over the past decade, with annual growth of between 2% and 3.5% since the
second half of 2000. Full-time employment has grown at a similar rate. The labour force participation rate remains
high at 66.6%, which, combined with strong working-age population growth, saw the labour force grow 1.5% in the
year to September 2003. Unemployment has also continued to decline, from around the 6% to 8% range in the late
1990s, to around a 4 ½% to 5 ½% range over the past two years. The unemployment rate fell to a 16-year low of
4.4% in September 2003. In addition, the number of those unemployed for 27 weeks or more has been declining
over the past decade. The last three years have seen a combination of job growth and labour productivity growth
and, while wage growth has increased, it is not excessive. Industrial action has remained at historically low levels.
Nevertheless, improvements in productivity growth need to be maintained if New Zealand is to improve its ranking
amongst OECD countries. Growth depends on the ability of firms to move resources into more productive activities,
and for productive new firms to replace less productive ones. From this perspective, New Zealand's relatively high
rate of job turnover and of firm creation and destruction suggests that there is a relatively low level of regulatory
and institutional impediments to employment, disinvestment and innovation. Attention continues to be given to
building up skill levels in the workforce and to addressing skill shortages.
EMPLOYMENT / UNEMPLOYMENT
Employment 000s Unemployment %
1,950 10.0
1,900 9.0
1,850 8.0
1,800 7.0
1,750 6.0
1,700 5.0
1,650 4.0
SEP SEP SEP SEP SEP SEP SEP SEP
1996 1997 1998 1999 2000 2001 2002 2003
Employment Unemployment Rate
S O U R C E : S TAT I S T I C S N E W Z E A L A N D
17Conservation
New Zealands three main and numerous offshore islands
are remaining fragments of the once-great continent of
Gondwana, separated from it some 80 million years ago. As
a result, New Zealand experienced the evolution of plant and
animal species distinctive from any others on Earth.
Many of these species have become extinct since the first
arrival of humans around 1000 years ago. Many more are
on the verge of extinction due to loss of habitat and the
impact of introduced plant and animal pests.
The Department of Conservation is responsible for strategies
to halt the decline in threatened species and rebuild their
populations, with some remarkable success stories. Most
recently, the Government has purchased the Birchwood
Station in the Upper Ahuriri Valley (pictured) in order to retain
it for the ongoing management of the many rare and unique
plant, animal and bird species located there. Among these
is the Kaki (Black Stilt), the worlds rarest wading bird, the
population of which had declined to just 23 birds in 1980.
Royal Albatross
The Royal Albatross is the worlds largest seabird, with a
wing span of up to 3.3 metres. These birds are renowned
ocean wanderers, travelling vast distances from their breeding
grounds to feed and only returning to land to breed. It is
estimated they cover up to 190,000 km per year.
Unfortunately, Albatross are at threat from international
fishing practices, which are, in part at least, responsible for
their declining numbers. New Zealand is signatory to the
International Agreement for the Conservation of Albatross
and Petrels, which came into force in February 2004. It is
hoped that the Multilateral Agreement will help ensure greater
protection for these magnificent seabirds.
The New Zealand Conservation Department is responsible
for protecting the Albatrosss breeding sites, including that
at Taiaroa Head, near Dunedin, one of only two mainland
Ahuriri Valley. Andris Apse
breeding sites in the world.
Royal Albatross. Fotopress Royal Albatross at Taiaroa Head, Dunedin. Andris Apse
18Industrial Structure and Principal Economic Sectors
Primary Industries
The agricultural, horticultural, forestry, mining, energy and fishing industries play a fundamentally important role in
New Zealand's economy, particularly in the export sector and in employment. Overall, the primary sector contributes
over 50% of New Zealand's total export earnings.
Agriculture and Horticulture
The agricultural sector, comprising the land, labour, capital and services involved in getting agricultural and horticultural
products to the farm gate, constitutes around 6% of GDP. The manufacture of primary foods accounts for a further
2% of GDP. However, downstream activities, including transportation, rural financing and retailing, which are related
to agricultural production also make important contributions to GDP.
The importance that agriculture plays in the New Zealand economy was highlighted during the 1997/98 and 1998/99
summers, when drought conditions adversely affected agricultural production, dragging down export and GDP growth.
During 2000/01 and 2001/02, climatic conditions were generally more favourable, resulting in record milk-solids
production and record average lamb carcass weights. Despite dry climatic conditions over much of the country in
early 2003 and a negative impact on total agricultural production, production recovered in late 2003.
The changing makeup of pastoral based production over the past 10 years reflects the relative returns of different
farming types and sheep stock numbers have dropped dramatically in favour of dairy cows, beef cattle and deer.
Horticultural crops have become increasingly important, with the principal crops being apples and kiwifruit. Other
significant export crops include wine, onions, processed vegetables, squash and seeds. The value of horticultural
exports is estimated to be around $2.0 billion for the year ended March 2003.
The following table shows sales of the principal categories of agricultural products for the years indicated, and as
a percentage of total sales for 2003.
Gross Agricultural Production(1)
Year ended 31 March
1999 2000 2001 2002 2003 2003
% of
Total
(dollar amounts in millions)
Dairy 3,205 3,625 5,028 6,182 4,685 29.2
Sheep meat 1,185 1,318 1,759 1,940 2,035 12.7
Cattle 1,270 1,537 1,834 2,139 1,902 11.9
Agricultural Services 1,235 1,405 1,712 1,808 1,452 9.1
Sales of Live Animals 921 835 1,149 1,349 1,201 7.5
Fruit 922 910 1,091 1,175 1,154 7.2
Wool 604 619 693 664 736 4.6
Vegetables 682 621 648 712 723 4.5
Value of Livestock Change 37 183 365 272 605 3.8
Crops and Seeds 329 332 335 402 418 2.6
Other Horticulture 260 279 281 287 282 1.8
Non-farm Income 208 193 194 220 226 1.4
Other Farming 174 170 198 180 184 1.1
Pigs 129 129 147 167 163 1.0
Deer 152 147 206 205 148 0.9
Poultry and Eggs 94 93 95 111 117 0.7
Total Gross Revenue 11,407 12,396 15,735 17,814 16,030 100.0
Less Intermediate Consumption (6,222) (6,296) (7,670) (8,388) (8,062)
Agricultural Contribution to GDP 5,185 6,100 8,065 9,426 7,968
(1) 1999 - 2001 data provisional, 2002 - 2003 data estimated.
19Forestry
The forestry and logging sector grew 3.0% in the year to September 2003 (in real terms). Forestry and logging
makes up around 1.4% of GDP and is the basis of an important export industry with more than 67% of wood from
the planted production forests eventually being exported in a variety of forms, including logs, wood chips, sawn
timber, panel products, pulp and paper and further manufactured wooden products including wooden furniture.
For the year ended September 2003, the value of exports of forestry products was $2,981 million (f.o.b.), 10.4% of
New Zealand's total merchandise exports. The largest markets for forestry exports are Japan and Australia. The
Republic of Korea, the United States, China and Taiwan and a range of Asian countries are important developing
markets. Forestry export volumes increased 1.0% in the year to September 2003, with weak prices suppressing
production.
New Zealand's climate and soils are well-suited to the growth of planted production forests. Planted production
forests cover an area of 1.7 million hectares and produce 99% of the country's wood. Radiata pine, which makes
up to 90% of the plantation estate, matures in 25 to 30 years, more than twice as fast as in its natural habitat of
California. This species has had considerable research investment since it was introduced last century and has
demonstrated its versatility for a wide range of uses.
As at April 2003, about 27% of New Zealand's planted production forests were owned or managed by two major
private sector forestry companies (Carter Holt Harvey Limited 18% and Timber Management Company 9%). Seven
medium-sized forestry companies own a further 22% of forests. Five percent of the forest area remains in central
Government ownership. Three percent of this is mainly on land leased from Maori and is managed by the Ministry
of Agriculture and Forestry. The other 2% is held through a State Owned Enterprise. Local authorities own a further
3% of the area while the balance (43%) is owned by a large number of private owners including Maori Trusts.
However, the mix of forest ownership is changing. Most of the recent new planting has been carried out by investment
syndicates and other small-scale private owners. There is also an active market in forests. For example, as at
November 2003, forests managed by the Timber Management Company have been sold to a US-based investment
company, while Fletcher Challenge Forests has recently signed an agreement to sell all its forests and related assets.
New Zealand's total planted forest growing stock at 1 April 2002 was estimated as 390 million cubic metres. For
the year ended 31 March 2003, a provisional estimate of 23.1 million cubic metres of wood were harvested from New
Zealand production forests. Of this, 8.1 million cubic metres were exported as logs and the balance was manufactured
into a range of products, including 4.3 million cubic metres of sawn timber; 1.4 million cubic metres of wood panels
and 1.5 million tonnes of wood pulp (made from harvested logs plus residues from sawmills). The wood pulp was
then exported as unprocessed pulp (771,000 tonnes) or manufactured into paper and paperboard (855,000 tonnes,
including from recycled paper).
Forecasts show that the current annual harvest of 23.1 million cubic metres could increase to 29 million cubic metres
by 2010.
Fishing
New Zealand has an Exclusive Economic Zone (EEZ) of 3.1 million nautical square kilometres supporting a wide
variety of inshore fish, some large deep-water fin fish, squid and tuna.
Fishing has developed into a major New Zealand industry and is now the fourth largest merchandise export earner.
Fish and other seafood accounted for $1,127 million in export revenues in the year ended September 2003, about
3.9% of total merchandise exports.
Approximately half of production is exported, the most important species being green-lipped mussels, hoki, mackerel,
squid and tuna. Smaller volume but high value exports are rock lobster, abalone and orange roughy. The main
export markets are the United States, Japan and Australia. New Zealand's unpolluted coastal waters are also well-
suited to aquaculture. The main species farmed are Pacific oyster, green-lipped mussels and quinnat salmon.
The New Zealand domestic fishing fleet has grown substantially in recent years and investment in processing capacity
has increased accordingly. Foreign vessels under charter to New Zealand companies are used extensively.
The conservation and management of the fisheries is based on a quota management system designed to protect the
future sustainability of the fisheries while facilitating their optimum economic use. The system uses market forces,
together with scientific assessments of fish stocks, to allocate fishing rights without arbitrarily restricting fishing
methods. Within the quota management system, certain administrative functions, such as registration of quota sales
and fishing vessels, have been devolved to the fishing industry. This allows for a greater level of partnership between
the government and the fishing industry and enables the commercial sector to deliver administrative services according
to their needs.
20You can also read


