The Irish Economy During the Century After Partition
←
→
Page content transcription
If your browser does not render page correctly, please read the page content below

The Irish Economy During the Century After Partition

               Cormac Ó Gráda and Kevin Hjortshøj
                          O’Rourke

                            Working Paper # 0062
                                April 2021

               Division of Social Science Working Paper Series
        New York University Abu Dhabi, Saadiyat Island P.O Box 129188, Abu Dhabi, UAE

         http://nyuad.nyu.edu/en/academics/academic-divisions/social-science.html
The Irish economy during the century after Partition1

                     Cormac Ó Gráda (University College Dublin)

                      Kevin Hjortshøj O’Rourke (NYU Abu Dhabi)

      ABSTRACT:

      We provide a centennial overview of the Irish economy in the one hundred
      years following partition and independence. A comparative perspective
      allows us to distinguish between those aspects of Irish policies and
      performance that were unique to the country, and those which mirrored
      developments elsewhere. While Irish performance was typical in the long
      run, the country under-performed prior to the mid-1980s and over-
      performed for the rest of the twentieth century. Real growth after 2000 was
      slow. The mainly chronological narrative highlights the roles of
      convergence forces, trade and industrial policy, and monetary and fiscal
      policy. While the focus is mostly on the south of the island, we also survey
      the Northern Irish experience during this period.

      Keywords: Ireland, economic growth, living standards, trade policy, crises

      JEL codes: N14

1
 We are extremely grateful to Frank Barry, Graham Brownlow, John FitzGerald, Eoin Flaherty, Patrick
Geary, Ronan Lyons, Morgan Kelly, Peter Solar, Rebecca Stuart, Paul Sweeney, Rodney Thom, and John
Turner for their advice and many helpful comments. The usual disclaimer applies.
1. Introduction

        Irish economic history was born in the dying decades of the Union of Great
Britain and Ireland. The timing was important: a growing conviction that home rule
would foster economic growth led to an interest in the economic past.2 Alice Murray’s
1903 history of the commercial and financial relations between the two islands was
followed 15 years later by George O’Brien’s economic histories of Ireland in the
eighteenth and early nineteenth centuries: Charles Bastable, at the rival (and
Unionist) Trinity College commented that it was “hard to escape feeling that the
author … has been affected by the sentiment which was engendered by the grievances
of his country”.3

        Subsequent economic histories of Ireland also reflected contemporary concerns
about Irish underachievement, but from very different perspectives. Blaming the
connection with Britain no longer carried conviction. Nearly half a century after
independence James Meenan echoed the widely-felt sense that “we have used not our
qualities to the fullest possible extent”, while in a national accounting perspective on
that half century Joseph Lee lamented that “every country ranked above Ireland in the
early twentieth century pulled much further ahead (while) every country below
Ireland either overtook her, or significantly narrowed the gap”. A comparative survey
by the present authors of economic performance between 1945 and 1988 similarly
dwelt on “the reasons … why Ireland’s record has been so poor”. However, by 2002,
when Patrick Honohan and Brendan Walsh published their landmark assessment of
Irish economic trends since the 1960s, their quest was for explanations for what they
dubbed ‘the Irish miracle’.4 Such shifts reflected both long-term swings and short-
term crises in the century since Ireland was partitioned and the south became
independent.

The Irish economy is among the world’s richest today, though perhaps not as rich
as sometimes portrayed. Nor has the path to affluence been a smooth one. Twice,

2
  Cullen, ‘Irish economic history: fact and myth’, p. 119.
3
  Murray, History; O’Brien, Economic History (three volumes); Bastable, ‘Review’.
4
  Meenan, Irish Economy since 1922, p. 393; Lee, Ireland 1912-1985, p. 514; Ó Gráda and O’Rourke, ‘Irish
Economic Growth’, p. 419; Honohan and Walsh, ‘Catching Up with the Leaders’, p. 53. Compare
Kennedy et al. Irish Economic Growth, pp. 118-121.

                                                    1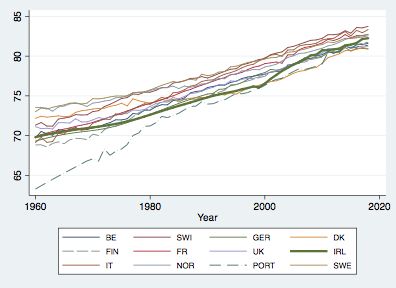
in the 1950s and the 1980s, the case for the Republic of Ireland being considered a
failed economic entity was a strong one. The impact of a post-colonial, but self-
imposed, trade dispute in the 1930s and semi-autarky imposed by World War 2
were severe, while that of the financial crisis of 2008 was more damaging in
Ireland than anywhere else in Europe, Greece excepted. The impact of these five
crises – four of them mainly or wholly self-inflicted -- on economic activity and on
emigration, long a sensitive marker of Irish economic malaise, may be inferred
from Figures 1a and 1b. In terms of duration those of World War 2 and the 1980s
were the worst; it is too soon to include the COVID-related crisis of 2020-21.

 (a) GNI, deviations from trend 1926-2018    (b) Migration and Population Change 1951-2018

                Figure 1. Five post-independence economic crises

 Sources: For GDP/GNI Bolt et al., ‘Maddison style estimates’ (1926-1994); Central Statistics
 Office (1995-2018); for migration, Central Statistics Office; Statistical Abstract, various
 years. The deviations from trend in GNI were calculated using a Hodrick-Prescot filter.

       Running any new country exacts an economic cost. If the break-up is
peaceful and anticipated, the cost may be small. But if the rhetoric of
independence is one of economic nationalism and exploitation, separation may
be followed by costly inward-looking economic policies. In other words, a new

                                             2
government's freedom to manoeuvre is conditioned by the past. A century ago
those who lived in that part of Ireland known until 1937 as the Irish Free State5
separated from the rest of the United Kingdom because they wanted to be different.
Supporters of independence included both moderate and strong nationalists. In
economic terms, for the moderates independence meant continued focus on the
British market and accentuating comparative advantage by improving quality and by
cutting costs. For more radical nationalists, it would entail greater self-sufficiency
through industrialisation underpinned by tariff protection in the towns, and a shift
from grass to cereals in the countryside. As it turned out, the economic history of
Ireland in the 1920s and 1930s would be split in two by the victory of radical over
moderate nationalists in early 1932.
It would be incorrect, however, to link the policy shifts introduced by Eamon
de Valera’s Fianna Fáil administration after 1932 solely to a more inward-looking
nationalism. True, the dispute known in Ireland as the Economic War (1932-38) was a
classic post-colonial dispute and the Fianna Fáil party was founded on a more populist
economic programme than its predecessor. Agriculture suffered badly during the
Economic War, as tariffs and government policy shifted it away from its comparative
advantage in dairying and live cattle exports. Early accounts of Irish economic
development thus emphasised the rise of Fianna Fáil when explaining Irish economic
development, or the lack of it, between the 1930s and the 1950s. The subtitle of a
pamphlet penned by Trinity College Dublin economist Joseph Johnston at the height
of the Economic War read: “Thoughts suggested by a study of the Anglo-Irish
experiment in economic vivisection”. A colleague in Dublin’s other university also had
Fianna Fáil in mind when he declared that he “accepted the facts of geography and
history instead of attempting to charm them away”.6 But, as we shall see, the
protectionist trade policies associated with that party were the norm during the Great
Depression era of the 1930s, and in the circumstances some version of them would
have been inevitable in any case. A new government's freedom to manoeuvre is
conditioned not only by the past but by the international environment of
5
The Free State would become simply ‘Ireland’ or ‘Éire’ in 1937. It became a republic in 1949.
6
Johnston, Nemesis’; Meenan, George O’Brien, p. 139.
3the present, and the interwar period was a difficult era into which to be born. More
generally, over the past century Irish economic policy, although on the whole
derivative of policy elsewhere and cautious, on occasion took some distinctive twists
and turns. Some cost it dearly, while a few were inspired. But in the long run, in a
comparative perspective Irish economic performance was just about what an
economist with little previous knowledge of the country would have predicted. In
what follows, we will describe both what was unique and what was unexceptional.
2. Irish performance in comparative perspective
How poor were the Irish on the eve of independence? Wage data fail to provide
a clear answer. Although a century ago farm labour earned far less in Ireland than in
Britain, Irish urban, and especially skilled, labour did not.7 Historical national
accounts offer further comparative perspective, although economic historians have
not as yet extended the official national accounts, which began in 1938, backwards in
time. There are however estimates for individual years on the eve of World War I
(1907, 1911, and 1914).8 In a classic, pessimistic account of Irish development since
independence, written in the crisis-ridden 1980s, Lee favourably compared GDP per
capita in Ireland in 1910 with incomes in eight other west European economies: the
point was that it had once been rich, but then became poor.9 The latest version of the
Maddison database places Ireland further down the pre-war European league table
than Lee had thought. It was much better off than Finland, Greece or Iberia, and on a
par with Italy, Norway and Sweden, but other countries in northwest Europe were
between 20 and 60 per cent richer, while UK incomes were 88 per cent higher (Table 1,
column 1).
Between independence and the late 1960s GDP per head in the Republic more
than doubled; since the late 1960s household consumption per capita, a better
7
O’Rourke, ‘Did labor?’.
8
Cullen and Smout, ‘Economic growth’; Bielenberg and O’Mahony, ‘Expenditure estimate’; Ó Gráda,
‘Ireland’. See also the symposium in the 2010 volume of Irish Economic Social History, summarizing the
work of the Historical National Accounts Group that was set up in the 1990s by Kieran Kennedy of the
ESRI (Begley, ‘Irish income tax returns’; Bielenberg, ‘Current position’; Cullen, ‘Context and
development’).
9
Lee, Ireland, pp. 53-4, 513.
4measure of living standards in this period, has trebled. Whether this performance was
good or poor requires a yardstick. Britain has often been seen as an appropriate
comparator, but since Britain was itself an under-performer for much of the period
this potentially sets the bar too low. In the 1980s Kennedy et al. and Lee reinforced
this point by pointing out that, since Ireland was a relatively poor country, it should
have grown more rapidly than a core economy like the UK, and achieved higher
growth rates akin to those observed elsewhere on the European periphery. The
present authors were the first to follow up this suggestion more rigorously, showing
that in such a convergence perspective post-1950 Ireland was a notable failure: it grew
significantly more slowly after 1950 than it should have done, given how poor it was
initially.10 That paper used the data available at the time (up through 1988), and Figure
2a confirms its dismal conclusion, taking 1926 rather than 1950 as the basis for
comparison. By the time the paper was published, however, Ireland had begun its
convergence process, which was all the more dramatic for being belated (since by the
1990s there was a lot more catching-up to be done). By 2001, Irish national income had
grown exactly as much as would have been predicted given its relative income in 1926,
with underperformance prior to 1973 being precisely matched by over-achievement
during the 1990s, and Ireland’s long run performance remains unexceptional today
(Figure 2b). More precisely, in a convergence perspective Ireland performed as well as
it should have done in the interwar period (but no-one performed well in the 1920s
and 1930s); it underperformed between 1950 and 1973, a period elsewhere remembered
as the European Golden Age; it stopped underperforming after 1973, but experienced
no overall convergence between then and 1990; and it made up for lost time in the
1990s, over-performing and converging in spectacular fashion. 11 In the 21st century it
experienced a spectacular housing bubble and bust, before resuming growth from 2012
onwards. By that stage, however, its GDP statistics had become essentially worthless
as a measure of real economic activity in the country, a subject to which we will return
below.12
10
Kennedy et al., Economic Development; Lee, Ireland; Ó Gráda and O’Rourke, ‘Irish economic growth’.
For a similar discussion, see Ó Gráda, Rocky Road, and Johnson and Kennedy, ‘The two economies’.
11
O’Rourke, ‘Independent Ireland’.
12
Figure 2 thus uses GNP rather than GDP for Ireland before 1995, and Modified Gross National Income
(GNI*) thereafter.
53.5
Portugal
Finland
Average annual growth (%)
3 Norway
Italy
Spain Sweden
2.5
Austria
Greece Germany
Denmark
France
Switzerland
Ireland
2
Belgium
United Kingdom
USA
Netherlands
1.5
2000 4000 6000 8000 10000 12000
1926 GDP per capita, 2011 international dollars
(a) 1926-88
3.5
Norway
Average annual growth (%)
3
Portugal
Finland
2.5
Ireland
Spain
Germany
Sweden
Austria
Italy
Switzerland
Greece
Denmark
2
France Netherlands
Belgium
United Kingdom USA
1.5
2000 4000 6000 8000 10000 12000
1926 GDP per capita, 2011 international dollars
(b) 1926-2018
Figure 2. Initial income and subsequent growth, 1926-1988 and 1926-2018
Sources: Maddison Project Database version 2020. Bolt et al., ‘Maddison style
estimates’. For Ireland we use GNI* (see below) from 1995 onwards, using adjustment
ratios based on CSO data. Before 1995 we use GNP, using adjustment ratios kindly
provided by Rebecca Stuart. Her data go back to 1944 so we have simply assumed
that GNP was the same proportion of GDP in previous years.
6Table 1 provides some comparative data.13 Columns (1) and (2) show that
Ireland, which had not been particularly rich to begin with, had fallen significantly
further behind other western European economies by 1958, being overtaken by
Finland and Italy. The mid-1950s represented a nadir for the Irish economy, a period
when observers from near and far were questioning its future viability. A key public
policy document of the time noted that “a sense of anxiety” about Ireland’s economic
prospects was indeed justified, and that “after 35 years of native government people
are asking whether we can achieve an acceptable degree of economic progress”.14 The
Irish economy’s relative position had barely improved by the mid-1980s (column 3),
implying only very mild convergence since the 1950s. Greek and Spanish incomes had
by this stage also caught up with Irish ones. However, by 2018 the doleful picture
painted by Lee had been reversed, and Irish GDP per capita was bettered only by oil-
rich Norway’s (column 4).
However, in the Irish case present-day comparisons based on GDP are
notoriously misleading because of the considerable share of output—real or
otherwise—accruing to foreign-owned businesses. Thus, in 2005 Irish GDP per capita
was ranked fifth highest in the world, whereas in terms of GNP per capita—a better
measure since it refers to output accruing to Irish residents—it was tenth highest. A
decade later the rankings were eighth and twentieth, respectively. Today the gap
between Irish GDP and GNP is over thirty per cent. Multinationals distort the Irish
national accounts in other ways. When they choose to domicile capital assets such as
intellectual property or aircraft in Ireland, depreciation of these assets is included in
GNP, while the undistributed profits of multinationals headquartered in Ireland are
also included. For this reason the Irish Central Statistics Office (CSO) now calculates
GNI*, which excludes these distortions, and which is roughly forty per cent lower than
GDP.15 Ireland was only the seventh richest country in the table in 2018 using GNI*
(column 5). An alternative gauge of economic wellbeing is household consumption
13
In 1940 Colin Clark, a pioneer in national accounting, placed Ireland 9th of 53 economies in terms of
th
income per head of occupied population in 1925-34; later he placed it 12 of 25 economies in terms of
income per head of population (as cited in Maddison, ‘Macromeasurement’, p. 33, 39).
14
Economic Development, p. 5.
15
Honohan, ‘Is Ireland really?’.
7per capita and this is shown for 2019 in column 7.16 In 1985 Ireland’s relative standing
was similar whether you used this metric (column 6) or GDP, but that is no longer
true today. Based on consumption Ireland no longer stands out as being unusually
wealthy, with household consumption per head in Ireland being more or less on a par
with that in Germany, and well behind levels in the UK and the Nordic countries.
2018 2019
1913 1958 1985 2018 1985 (C)
(GNI*) (C)
Belgium 154 166 161 61 102 145 95
Germany 133 174 163 71 106 152 101
Denmark 143 209 187 72 111 192 118
Finland 77 141 156 60 96 139 104
France 127 177 167 60 90 142 93
Greece 43 77 100 36 57 103 63
Ireland 100 100 100 100 100 100 100
Italy 93 138 151 53 83 143 84
Netherlands 148 193 164 73 112 148 94
Norway 101 172 186 131 135 202 161
Portugal 46 69 89 42 68 73 62
Spain 70 84 99 49 79 101 72
Sweden 105 209 174 70 104 154 107
United
188 206 152 59 91 127 111
Kingdom
Irish ranking 9th 11th 11th 2nd 7th 12th 7th
Table 1. Irish income per capita in comparative perspective (Ireland = 100)
Sources: Columns (1)-(4) (GDP per capita, 2011 dollars): Maddison Project Database,
version 2020. Bolt et al., ‘Maddison style estimates’. Column (5): Eurostat, with the Irish
GDP figures converted to GNI* using CSO data. The figures were kindly provided by
John FitzGerald. Columns (6) and (7): household consumption per capita (2010 dollars):
World Bank.
To summarize: interwar Ireland’s economic performance was poor but not
atypical, while it was a striking underperformer during the European ‘Golden Age’.
Relative decline was halted after 1973, and reversed after 1990. In the subsequent
sections we will revisit each of these phases of Irish economic history.
16
This is household expenditure per capita in constant 2011 international $US.
8Health and Inequality
The Cumann na nGaedheal ministers who ruled the new Ireland in the 1920s liked to
see themselves as “the most conservative revolutionaries that ever put through a successful
revolution”. The harsh economic climate in 1924 prompted one of them to cut the old age
pension payment by ten per cent and another to predict that “people may have to die in this
country and may have to die through starvation”. And, sure enough, Ireland had its last
brush with near-famine in remote pockets of Connemara in 1925.17 Soon the electorate
would come to expect more. Cumann na nGaedheal’s successors, the new Fianna Fáil party,
which ruled without interruption from 1932 to 1948, immediately increased public spending
on land reform, social housing, export bounties, and the old age pension. As we shall see
below, however, more life-threatening hardship lay in store for neutral Ireland during
World War 2.
In the century since independence and partition, infant mortality rates have fallen
dramatically and life expectancy has grown. But in 1989 Lee castigated Cumann na
nGaedheal for the high rates of infant mortality in Dublin in the 1920s and noted how the
rate in Northern Ireland dipped below that in the south in 1943 and would remain below it
for a few decades.18 The average life span in the South has risen from under 60 years for
both males and females in the 1920s to 68 years for males and 72 years for females in 1960,
and 82 years for males and 86 for females today. There were two periods of rapid
improvement, in the immediate post-war period and again at the turn of the new
millennium. Walsh speculates that the striking rise in life expectancy at birth (e0) between
1946 and the late 1950s—9 years for females and 7.5 years for males—may have been due to
an increasing focus by government on health, symbolized by the introduction of children’s
allowances in 1944 and the 1947 Health Act.19 In the 2000s Irish life expectancy began to
converge with that elsewhere in Western Europe. Was this due to increased spending on
public health, or rising incomes, or did changes in lifestyle play a role? For now, there is no
17
Kevin O’Higgins, Parliamentary Debates Dáil Eireann (PDDÉ), 2: 1909, 1 March 1923; Patrick
McGilligan, PDDÉ, 9: 561-2, 30 October 1924; O’Neill, ‘Minor famines’; Ó Gráda, ‘The greatest benefit of
all’, pp. 150-1.
18
Lee, Ireland, pp. 124, 256.
19
Walsh, ‘Life expectancy’, pp. 132-3.
9obvious answer. While the increase in the 2000s put an end to Ireland’s laggard status in the
life expectancy stakes, Figure 3 suggests that Ireland still has some catching up to do. The
wide gaps in e0 today between white collar and unskilled workers (6.2 years for males in
2016) and between those living in the most favoured and deprived areas (4.3 years between
the top and bottom quintiles) point to the scope for further improvement.20
Figure 3. Life expectancy at birth (e0), European countries, 1980-2017
Source: World Bank
Although Ireland is a small country (84,421 km2), it has long been marked by
striking interregional inequalities. In the mid-1950s a friendly outside observer
surmised that since GDP per capita in Leinster, the province covering the eastern part
of the Irish state, was then about 65 per cent that of the UK, it must have been less
than half in the rest of the country. Data on the interregional variation in incomes in
the 1960s imply a much wider gap than this between Leinster and the rest. Still, there
had been convergence of sorts in earlier decades. For example, the coefficients of
variation in private car ownership relative to population halved between 1926 and
1966. Data on income distribution across counties imply no convergence in the 1960s,
significant improvement in the 1970s and 1980s, but a reversal of that process in recent
years. Meanwhile, the population share of the poorer counties continues to fall. That
20
Life expectancy in Northern Ireland (78.7 years for males, 82.4 for females in 2016-18) currently lags
behind that in the Republic.
10of Connacht (the province taking in west central Ireland) and the three Ulster
counties in the Irish state was 30 per cent in 1911, 23 per cent in 1961, and just 18 per
cent in 2016. Peripherality still matters: the poorest counties today are concentrated
in the northwest and along the border with Northern Ireland, and the richest, with the
exception of Limerick, in the east.21
Top Income Shares: Ireland 1922-2017 Top 1% and 10% Income Shares, 1975-2017
.4
50
40
.3
30
Share
.2
20
10
.1
0
0
1920 1940 1960 1980 2000 2020
Year 1975 1985 1995 2005 2015
Year
Top_10% Top_10%a
Top_1% Top_1%a IRL_1% EUR_AV_1%
Top_0.5% Top_0.1% IRL_10% EUR_AV_10%
Figure 4. Income Inequality in Ireland since the 1920s
Sources: Nolan, ‘Long-term trends’; World Income Database
Surtax data, available from the formation of the new state, track the income
share of the richest members of society from the 1920s. The qualitative trends that
emerge in Figure 4 are familiar from the experiences of other countries. Top
income shares declined from the 1920s to the 1970s, and rose thereafter, although
there was a pronounced (but apparently temporary) fall in the wake of the 2008
financial crisis. Comparative data available from 1975 allow us to compare top
income shares in Ireland and a sample of 15 European economies. The gap that
opened up in the 1970s and accelerated during the Tiger years closed during the
crash of 2007-08 and has stayed close to the European average since. Time series
data on wealth distribution in Ireland in the past are still too few for any inferences
about trends, but a series describing wealth inequality in Northern Ireland using will
probates has revealed a drop in wealth inequality in NI between the 1920s and the
1990s, during which period the share of the top 1 per cent halved (from over half to
21
Carter, ‘Irish Economy’, p. 137; Ross, Further Data; Ó Gráda, Rocky Road, pp. 87-8.
11less than a quarter).22
3. The interwar period
The economy of the Irish Free State (IFS) remained closely linked to that of the
United Kingdom in the 1920s. Its new currency, the Saorstát pound, was fully backed
at parity by sterling bonds. In that way the IFS was spared the inflation and monetary
instability that characterised several of the new states created in the wake of World
War 1.23 Fiscal policy was cautious and regressive. The IFS was one of the most open
economies in the world,24 but its foreign trade continued to be overwhelmingly to and
from the United Kingdom. In 1924, the first year for which there are data, UK (GB)
imports and exports accounted for 79.1 (67.7) and 98.1 (83.6) per cent of the total,
respectively. The UK share of imports, it is true, exaggerates because the data refer to
country of consignment rather than country of origin. The latter definition was
employed from 1936 on, and the share of imports from the UK (GB) dropped markedly
as a result, from 72.4 (67.7) per cent in 1935 to 53.3 (51.9) per cent in 1936. Despite the
Economic War, much of the Free State’s trade came either through or from the UK.
For several centuries southern Irish foreign trade had consisted, broadly
speaking, of exchanging products of pastoral and small-holder agriculture for cereals,
tropical agricultural goods and manufactures. In 1924 live animals and manufactured,
processed, or simply prepared food and drink accounted for six-sevenths of exports,
while manufactured goods or their raw materials accounted for over half of imports,
and tea, sugar, flour and imported cereals for another quarter. There was little serious
effort at changing this pattern in the 1920s; official policy was that exporting meat,
mainly in the form of live animals, and dairy products reflected the country’s
comparative advantage. The main focus of trade policy in the 1920s was therefore on
enhancing that comparative advantage by keeping input costs down and improving
quality.25
22
Nolan, ‘Long-term trends’; Atkinson and Nolan, ‘The changing distribution’; Turner, ‘Wealth
concentration’.
23
Compare Lopez and Mitchener, ‘Uncertainty and hyperinflation’.
24
The share of exports plus imports in GDP was 64 per cent in 1924.
25
George O’Brien, ‘Patrick Hogan’. But some lip service was also paid to tariff protection. Excise duties
imposed on imported tobacco in 1923 led to the establishment of three major British subsidiaries in
Dublin, while tariffs on soap and candles and on confectionery led to the creation of several indigenous
12It is true that there was somewhat more to Irish industry in the wake of
independence than ‘beer and biscuits’, exemplified by the Dublin firms of Guinness
and Jacobs.26 Still, in the late 1920s the IFS contained only two dozen or so
manufacturing firms with a workforce of 400 workers or more, with nearly two-thirds
of them located in Dublin. The biggest manufacturing concern, the Irish subsidiary of
Henry Ford & Sons, reached peak production in early 1930 when it was producing
about three thousand tractors a month and employing nearly seven thousand men.
But a majority were laid off in the following months as the depression began to bite.
By 1931 there was intermittent employment for only 1,250, and from 1932 on Ford
would treat Cork “like a little assembly plant, as in e.g. Barcelona”27. The next largest
employer was indeed Arthur Guinness, whose Dublin workforce of 3,200 produced
nearly all the 1.5 million barrels, worth £5 million, that were exported annually in the
1920s. Several of the other large firms produced non-tradable goods such as milk,
bread, and local newspapers; very few exported anything.
As noted earlier, this was a period of two rather distinct halves, defined by both
the onset of the Great Depression, and the transfer of power from Cumann na
nGaedheal to Fianna Fáil in March 1932. The pursuit of comparative advantage gave
way to protection, more generous social welfare, significant investments in social
housing, and a trade dispute with the United Kingdom that lasted until 1938. The
collapse in the prices of agricultural produce during the depression was worsened by
these measures, which led to a reduction in the share of output exported from 49 per
cent in 1929/30 to 33 per cent in 1934/5. Although protection boosted industrial
output, the impact of the Economic War on farming implied countervailing economic
losses. But this was not a time for “accept(ing) the facts of geography and history
instead of attempting to charm them away”.
Fianna Fáil’s case for import-substituting industrialization (ISI) rested on the
convictions that farming could never provide the employment needed to sustain a
vibrant, growing community, and that free trade could not produce the industries
concerns. According to the Department of Industry and Commerce employment in protected firms rose
by 5,300 between 1926 and 1929, while employment in exposed firms fell. By 1929 there were 59 tariffs —
but by 1936 there would be 1,900 (Bielenberg and Ryan, Economic History, pp. 9, 73, 75).
26
Barry, ‘Leading manufacturing firms’.
27
Grimes, ‘Starting Ireland on the Road to Industry’, vol. 2, pp. 115-6, 141, 180.
13needed to increase employment. Its proponents ignored the fundamental truth that
the Irish domestic market was simply too small for ISI to prove a panacea in the long
run. Keynes, who was far from hostile to the government’s quest for greater self-
sufficiency, raised the issue in a famous lecture delivered in Dublin in 1933, asking
whether Ireland, and “above all…the Free State”, was “a large enough unit
geographically, with sufficiently diversified natural resources, for more than a very
modest measure of national self-sufficiency to be feasible without a disastrous
reduction in a standard of life which is already none too high”.28 The Fianna Fáil
strategy was also predicated, implicitly, on the hope that Irish workers would work for
less at home than what they might obtain in neighbouring Britain. As de Valera
quipped, using the analogy of a servant leaving his master, “If he goes into the cottage,
he has to make up his mind to put up with the frugal fare of that cottage”.29
Still, although the inspiration for tariffs was largely home-grown, a rise in
protectionism after 1932 was inevitable regardless of who was in power, because the
1930s were years of trade destruction everywhere, even in such traditionally free-
trading nations as the Netherlands and the United Kingdom. With the gold standard
constraining monetary policy and a universal prejudice against expansionary fiscal
policy, for many tariffs seemed the only option.30 Ireland was one of the last countries
in Europe to tilt towards protectionism, and it would have been extraordinary if it had
bucked the trend altogether. And to a point protection worked. In the 1930s on
average, higher tariffs were associated with better economic performance, and there
are reasons to suspect that protection was beneficial in interwar Ireland just as it was
elsewhere. The deadweight efficiency losses were not that large, and may have been
smaller than the gains associated with defaulting on the land annuities owed to the
UK; Britain and other export markets were moving to protection anyway, lowering the
opportunity costs of Irish protection; and new jobs in protected industries were
28
Keynes, ‘National self-sufficiency’, p. 189. Keynes concluded that it would be ‘an act of high wisdom
on the part of the Irish to enter into an economic arrangement with England which would, within
appropriate limits, retain for Ireland her traditional British markets against mutual advantages for
British producers within the wide field which for long to come will not interfere with Ireland’s own
developments’.
29
As cited in Grimes, ‘Starting Ireland’, vol. 2, p. 172.
30
Eichengreen and Irwin, ‘Slide to protectionism’.
14welcome at a time of mass unemployment around the world. 31 Manufacturing
employment rose by almost half (from 111,000 to 166,00) between 1931 and 1938.32
Nor was Ireland unusually protectionist during the 1930s; Irish average tariffs
were towards the higher end of the spectrum in the sample of European countries for
which we have data, but they were similar to those in Germany, Italy, Portugal, Spain,
and the United Kingdom. And focusing on tariffs alone is misleading, since these were
not the real problem during the 1930s. Rather, countries during this period adopted a
wide variety of quantitative restrictions on trade, up to and including exchange
controls which in some cases effectively nationalised the international trading
activities of particular countries. Ireland didn’t do anything nearly as drastic; it was
towards the more liberal end of the spectrum when it came to the adoption of quotas
as well. Nor were Ireland’s restrictions on foreign investment exceptional in the 1930s.
And the upshot was that Irish economic performance was also unexceptional.33
In the long run Fianna Fáil’s policies would prove a cul de sac, but from the
contemporary comparative perspective of the 1930s they were not so misguided. For a
time ISI seemed to work: industrial employment expanded considerably for a while
under protection, a welcome development in the context of the Depression and in a
polity still trying to find its democratic feet (Table 2). The increase between 1926 and
1936 would have been larger but for the transfer of a portion of Arthur Guinness’s
activities to London and the contraction of employment at Henry Ford in Cork.
However, the inability of the strategy to generate sustained output growth was soon
evident in the trend of industrial production: official data imply a tapering off in
output and employment by the late 1930s, by which time the home market had been
saturated by protected firms.34 The Second World War intervened before the message
could sink in, and the costs of protection would come to outweigh the benefits in the
years that followed.
31
Clemens and Williamson, ‘Tariff-growth correlation’; Neary and Ó Gráda, ‘Protection’; O’Rourke,
‘Burn everything British’.
32
Daly, Industrial Development, p. 76.
33
O’Rourke, ‘Independent Ireland’, pp. 28-9. For data on quotas and other non-tariff restrictions, see
League of Nations, Quantitative Trade Controls; Whittlesey, ‘Import Quotas in the United States’.
34
Compare the data for employment and output in individual sectors in Statistical Abstract 1934, pp.
68-70; Statistical Abstract 1940, pp. 81-83.
151926 1936 1946
Total % Male Total % Male Total % Male
FDT 32,369 77.7 34,370 76.1 37,180 74.7
Textiles 7,767 36.5 10,842 36.1 10,165 50.3
Apparel 28,021 47.3 34,847 42.4 36,201 40.1
Leather 1,848 95.1 2,061 84.9 3,389 78.9
Wood, 14,059 96.4 14,440
furniture 94.8 13,717 95.2
Metal & 12,242 96.4 13,185
machinery 93.4 14,637 89.4
Vehicles & 10,238 97.7 9,274
parts 97.8 7,727 98.1
Chemicals, 2,432 78.9 3,916
fertilizers 68.7 4,237 65.7
Paper & 7,217 66.4 9,435
printing 64.5 10,684 64.0
Bricks, glass, 706 94.5 1,947
etc. 84.3 3,658 85.6
Misc. 1,320 69.3 3,882 71.5 6,111 64.4
Total 118,219 73.4 138,199 68.7 147,706 68.0
Table 2. Numbers Employed in Industry, 1926-1946
Source: Statistical Abstract 1936, p. 23; Statistical Abstract 1942, p. 32; Statistical
Abstract 1951, p. 40. FDT = Food, Drink, Tobacco.
4. The Emergency
One of the first acts of the Irish government following the outbreak of war in
September 1939 was to pass an Emergency Powers Act. Hence the term ‘Emergency’ as
a depiction of the war years in Ireland: and this, indeed, was a real emergency. First of
all, it was a political emergency, with much intimidation from local representatives of
three of the warring parties. Had the country been seriously divided on the issue of
neutrality the situation would have been much more critical.
Fears of mass unemployment were very real. A hastily-prepared confidential
‘Report of Inter-Departmental Committee on the Probable Effect on Employment of
the Complete Isolation of Eire’ predicted that a complete end to international trade
(including cross-border trade) from July 1st 1940 would increase unemployment by
between 60,000 and 76,000 immediately, and that an additional ten thousand would
lose their jobs in the following two months. This calculation was made on the basis
that available stocks of materials and fuel were sufficient for only three months of
16normal activity. Obviously, the situation was bound to deteriorate rapidly thereafter,
as stocks of materials and fuel ran out. Were autarky to last longer and the economy
forced to rely entirely on native resources, the committee estimated that “the
additional unemployment which might be expected at this point would be
approximately 161,000 persons”. The report excluded the impact on employment in
agriculture and fisheries, on the liberal professions, and on the self-employed.35
The strategy of ISI pursued since 1932 had not prepared the economy for the
degree of self-reliance dictated by the war, because – as was often the case for
countries pursuing such strategies – the country still depended on imports, in the Irish
case from Britain, for fuel, raw materials, and producer goods. Ireland was now faced
with a neighbour with considerable monopsony and monopoly power. By the summer
of 1940 British coal exporters were demanding payment prior to delivery. Ireland’s
representative in London failed to convince the colliery owners that “if they want to
maintain their monopoly in future, (not) to take advantage of the present position in
the manner proposed”. Still, the British realised that their supplies of Irish cattle and
beef were dependent on the quality of the coal they supplied.36
The Emergency was associated with the rationing of foodstuffs (particularly
sugar, tea, and butter)37 and a policy of compulsory tillage that was far more drastic
than that imposed during the First World War.38 Not only did compulsory tillage
result in higher acreages under the plough than in 1917-18; it also affected agriculture
for a much longer period. And surprisingly, perhaps, the impact of compulsory tillage
was more drastic in the South than in Northern Ireland, as had been the case during
World War I. Fianna Fáil’s tillage inspectors proved much tougher on farmers than
Lloyd George’s, and resentment against compulsory tillage—reliant on horses rather
than tractors--was considerable. This helps explain the success of a new farmer’s party,
Clann na Talmhan, in the general election of 1943. It is also likely that the large
sustained rise in cultivation inflicted far more damage on agricultural productivity in
35
National Archives of Ireland, INDC/EMR/19/8.
36
Rigney, Trains and Coal and Turf, p. 90.
37
Evans, Ireland During the Second World War, pp. 44-68; Crotty, Irish Agricultural Production, pp. 158-
160; Bryan, Rationing in Emergency Ireland.
38
Evans, ‘Coercion in the Countryside’; Evans, Ireland During the Second World War, pp. 134-52.
17the wake of the war than it had during the campaign of 1916-1918: certainly, soil
exhaustion was a factor in poor grass yields in the late 1940s.
The Emergency saw a rise in the importance of previously marginal economic
activities. Exports of rabbit meat and furs peaked at 11,400 tons of meat and nearly 0.7
million skins in 1941. In value terms, rabbits represented about 3 per cent of all exports
in that year! The industry was eventually destroyed by the spread of myxomatosis, a
virus surreptitiously introduced into wild rabbits in Ireland by a group of well-heeled
farmers in 1954.39 The war years also saw more harvesting of wild fruit. The four
hundred tons of bilberries (worth £64,292) exported in 1941 would have entailed over
sixty thousand days’ labour.40
The impact of the crisis can also be seen in the temporary halt to the declining
use of horses off the farm; in the sharp decline of travel within the country; and in the
substitution of peat turf for coal and gas. The use of peat in post-independence Ireland
peaked during the Emergency. It was at this time that the official Scientific Research
Bureau briefly revived the nineteenth-century dream of finding non-fuel uses for turf:
Peter Rigney has likened the country to “a gigantic outdoor fuel laboratory” with the
railway network acting as the national grid for turf.41 As imports of household coal
plummeted from 1.6 million tons in 1941 to 2,169 tons in 194442, Emergency Ireland’s
bogs became a lifeline. In a final flourish in 1957 the policy document Economic
Development envisaged turf being used as a raw material for ‘peat wax’, ‘peat coke’,
and ‘activated carbon’. The document also mentioned the ‘possibility of producing
town gas from milled peat’ and a soil fertiliser developed by state-owned Bord na
Móna (the Irish Turf Board).43 None of these proved viable; Bord na Móna scored
modest but more enduring successes with peat moss and peat briquettes.
While high food prices in Britain had boosted incomes in a largely agricultural
economy during the First World War, the Emergency had a dramatic negative impact
on living standards. Of the European neutrals, Ireland alone suffered a reduction in
39
Conry, Rabbit Industry, pp. 16-52.
40
Conry, Picking Billberries; id., Rabbit Industry, pp. 134-35.
41
Rigney, Trains and Coal and Turf, p. 222.
42
Bryan, Rationing in Emergency Ireland, p. 74.
43
Economic Development, pp. 176-7; Irish Press, ‘Popular fertiliser based on turf’, 28 May 1957. A soil
conditioner branded as ‘Humona’ faded from the scene after a few years.
18both GDP and GDP per capita during the conflict, although both recovered in 1945.44
On the eve of the war the ratio of Irish to UK GDP per capita had fallen to less than
half; by 1943 it was down to 43 per cent.45 The fall in personal consumption probably
entailed some intra-household redistribution; spending on fuel and light and on
clothing fell dramatically, while that on alcohol and tobacco held its own. The lack of
domestic heating hurt the poor most. Campaigning paediatrician Robert Colles
described how, in the wake of a cold spell in early March 1941, he used a sub-normal
thermometer to take the temperature of a dying infant in Dublin’s Rotunda Hospital.
It registered 85ºF. The infant’s young mother revealed that “for the last ten days they
had no fire in the room”.46 In Ireland the war led to temporary rises in infant
mortality rates and in deaths from tuberculosis. The rise in the former was particularly
marked in the cities; the latter was dramatic relative to trends in the UK. And while
the crude death rate did not rise during the war, it is its failure to fall as it did in
Northern Ireland and Britain that is significant. If trends in Northern Ireland are any
guide (Figure 5), excess deaths south of the border in 1942-1945 may have reached the
low thousands.
TB Death Rate 1938-1950 Death Rates North and South, 1936-1946
16
1.4 1.2
Per 1,000 population
15
1
Per 1,000
14
.6 .8
13
.4
12
1938 1942 1946 1950
YEAR
1936 1938 1940 1942 1944 1946
Ireland NI Year
E&W Scotland DR_IRL DR_NI
Figure 5. Death rates from TB and from all causes 1936-1945
Source: Annual Report of the Registrar-General of Marriages, Births, and
Deaths in Ireland, 1950, pp. xix, xxix.
The Emergency forced a certain amount of institutional innovation, notably the
creation of the Irish Central Bank. Until the Emergency, Ireland’s lack of a central
44
Gerlach and Stuart, ‘Money’.
45
Maddison Project Database, version 2020. Bolt et al., ‘Maddison style estimates’.
46
Irish Times, 9 March 1941.
19bank had not previously worried its joint-stock banks; on the contrary, they did not
relish the idea. For over a century the Bank of Ireland had played the role of quasi-
central bank, while looking on the Bank of England as its friend in need. Just a few
days before the outbreak of war a delegation from the Bank of Ireland travelled to
London for reassurance about the availability of foreign exchange and the free
repatriation of Irish bank assets held in London. They were told in blunt language that
given Ireland’s Dominion status, it was time for its banks to appreciate the need for an
Irish central bank. The Central Bank Act followed in 1942. The Emergency also led to
the creation of the Irish Shipping Company in 1941 and the purchase or leasing of
fifteen second-hand vessels to service Irish trade. Before the war Ireland had relied on
foreign shipping for its merchandise trade, but now no British vessels were available to
service Irish bulk cargoes from abroad. Irish Shipping lent Irish trade a lifeline, but at
considerable cost in lost ships and lost lives.47
5. 1945-58
The immediate post-war years saw rapid recovery in all countries at war except
Germany and more modest growth in ex-neutrals, Spain excepted. There was a
consumer-led boom in Ireland, the result of a wartime lack of consumer goods that
had led to a doubling in real terms of personal savings between 1938 and 1945. These
savings were spent between 1945 and 1948, investment almost trebled in real terms
over the same period, and there was a huge surge in imports, particularly of
manufactured goods. The Irish performance during the late 1940s was relatively poor
however, and the fact that it relied so heavily on both consumption and imports was a
portent of problems to come. The contrast between 1931-36, when net industrial
output rose by 31 per cent, and 1936-38, when it rose by 6 per cent, is matched by
that between 1945-53 and 1953-58, when industrial production rose by 87 and 7 per
cent, respectively . By the early 1950s government officials realized full well that
“many forms of production are now at the limits of existing market needs”.48
47
Ó Gráda, Ireland, pp. 373-5; Rocky Road, pp. 8-9.
48
National Archives (NA), DT/813101 c/1.
20ISI had simply not worked. Instead of generating an expanding, self-sustaining
economy, less reliant on the land, it had resulted in an inefficient, highly protected
manufacturing sector that produced a narrow range of products in small plants with
short production runs, widely spread throughout the country. The data in Table 3,
which were collected in connection with de Valera’s pre-election tour of January-
February 1948, confirm this impression. Almost three in four employees worked in a
firm employing fewer than twenty workers: such a structure was unlikely to produce
either internal or external returns to scale. Many firms simply produced or assembled
foreign goods under license, without giving a thought to exports. Virtually none of the
hundreds of firms set up under ISI survived trade liberalisation in the 1960s.
All Firms Firms Employing >20
Region
Employees per Employees per
Firms Firms
Firm Firm
Dublin 516 35 111 54
Rest of Leinster 191 46 63 113
Munster 219 41 69 108
Connacht/Ulster 146 27 47 70
Total 1,072 37 294 82
Table 3. Firms and Employment in Protected Industries, 1947
Source: National Archives of Ireland, S.11987B
Policy shifted only cautiously away from ISI. But a return to the policies of the
1920s was not very palatable either. The promotion of export-oriented subsidiaries of
multinationals was politically attractive, since it did not threaten existing indigenous
firms directly, at least in the short run. It was even more attractive if the firms in
question were American: US investment was not seen as threatening national
sovereignty, in the same way as might an over-reliance on British companies.49 The
decision to allow in foreign capital preceded that to liberalize commodity trade by
49
Barry and O’Mahony, ‘Regime change’.
21several years. The focus at the outset was indeed largely on American investment,
which also promised U.S. dollars at a time when these were scarce across Europe.
By 1955 Irish delegations were busily seeking foreign investment in Germany, the U.S.,
and elsewhere, and in 1956 the inter-party government (not involving Fianna Fáil)
enacted a 50 per cent tax remission for a fixed period on export-derived profits.
The blame for the economy’s poor performance in the post-war era was
widely shared. Fianna Fáil failed to avail of the opportunity to liberalize after 1945,
but the inter-party coalitions of 1948-51 and 1954-57 proved little better. Seán
Lemass, Minister for Industry and Commerce (1932-1959) and subsequently
Taoiseach (1959-66), is remembered not only as ISI’s demolisher but as its
architect. Although already disillusioned by rent-seeking manufacturers in the
1940s, his disappointments were not then sufficient to prompt him to scupper tariff
protection, and his successor almost immediately reassured manufacturers that
“so far as he was concerned personally, no Irish industrialist need have the
slightest qualms or fears’”50 Indeed, one of the main functions of the Industrial
Development Authority as originally constituted in 1949 was to review requests for
protection.
By the late 1950s Economic Development (November 1958) was stating the
obvious when it declared that “the coming of freer trade in Europe in one form or
another must be faced in due course”. Thereafter Lemass would repeatedly claim
that protection had made industry complacent and inefficient: one of the
attractions of the various trade liberalization options being discussed was that
they would force it to be competitive and reduce its capacity to profiteer.51
A second policy failure concerned short-run macroeconomic management. This
has been largely forgotten now, but it loomed large in economic discussions of the
time.52 In retrospect, it is striking how heavily—one might say obsessively—economic
commentary and policy focused on the balance of trade. Thus, according to the New
York Times (which in those days contained surprisingly frequent reports of Irish
50
IBEC Archive, Box 15 (Meetings with Morrissey, 8 March 1948 and 4 August 1948).
51
E.g. IBEC Archives, Box 14 (FII council meeting, 26 November 1937); NA/ICTU/4002 (Meeting
with Taoiseach 1959).
52
Ó Gráda, Rocky Road, pp. 30-33, 67-73.
22economic conditions), ‘Ireland betters position in trade’ (January 6 1953); ‘the balance
of payments has reached so dangerous a state of disequilibrium that we are within
sight of national bankruptcy’ (July 29 1956, citing an Irish Times editorial); and ‘Irish
austerity balances trade: Dublin cuts imports’ (January 7 1958). The focus on the gap
between imports and exports led to a succession of stop-go measures that stifled the
growth potential of the economy. The post-war boom ended as a result of a balance of
payments crisis that emerged in 1950 and worsened in 1951. This ultimately led to the
disastrous recessionary budget of 1952, the work of Fianna Fáil’s Seán McEntee. By
1955 the economy was recovering, but so were consumption and imports; in response
Fine Gael’s Gerard Sweetman ushered through two deflationary budgets in 1956, the
second of which—among other measures—increased levies on a wide range of
‘luxuries’ to a preferential rate of 40 per cent on imports from the United Kingdom,
and 60 per cent on imports from most other countries. The ensuing decline in
consumption was drastic enough to restore the balance of payments, but at the cost of
yet another long-lasting recession. Both McEntee and Sweetman, following the
conventional economic wisdom of the day, underestimated the ability of the
macroeconomy and the balance of payments to self-correct.53
It is important to emphasize, however, that Irish policymakers were not
uniquely incompetent in this regard: far from it. This was an era of fixed exchange
rates and limited capital mobility, in which trade deficits were more of a problem than
they would subsequently become. The classic ‘stop-go’ sequence of loosening fiscal
policy, rising imports, and balance of payments crises, leading in turn to tighter fiscal
policy, recession, falling consumption and imports, and improvements in the balance
of payments, was a familiar feature of the economic landscape in the 1950s and 1960s,
with the UK and former colonies such as Australia and New Zealand being particularly
badly affected. As Trevor Swan pointed out at the time such problems were
predictable in countries with overvalued fixed exchange rates.54 And it is striking how
closely correlated Irish and UK business cycles were during the period.55
53
Honohan and Ó Gráda, ‘Irish macroeconomic crisis.’
54
Feinstein, Managed Economy; Swan, ‘Longer run problems’.
55
The correlation between business cycles in the two countries from 1950 to 1972 inclusive is 0.74,
where the business cycle series are simply calculated as deviations from log trend. O’Rourke,
‘Independent Ireland’.
23In the ‘lost decade’ of the 1950s Ireland fared worst of all the economies listed in
Table 4. Granted, the UK’s growth rate was only slightly higher, but this comparison
flatters the Irish one in several respects. First, the familiar convergence logic
highlighted earlier stresses that since the UK was a rich country it should have grown
significantly more slowly than Ireland. Second, the UK was an underperformer during
this period, even when its initial starting position is taken into account.56 And third,
Ireland’s population was, uniquely, declining during this period. This was a much
commented-upon metric of failure in its own right, but it also meant that Ireland’s
relative economic performance was even worse when measured in terms of aggregate
GDP growth, rather than per capita growth.
1922- 1938- 1950- 1960- 1973- 1990- 2000-
1938 1950 1960 1973 1990 2000 2018
Belgium 0.6 1.0 2.4 4.4 2.1 2.1 0.9
Denmark 2.1 1.6 2.4 3.6 1.7 2.9 1.0
Germany 2.6 -2.1 7.1 3.4 1.7 2.8 1.8
Finland 3.5 1.4 3.9 4.5 2.5 2.0 1.0
France 1.3 1.3 3.6 4.3 1.9 1.7 0.8
Greece 2.0 -2.8 5.1 7.1 1.6 2.8 0.6
Ireland 1.0 1.0 2.2 3.7 3.3 7.5 2.9
Ireland
1.1 2.2 3.9 1.8 5.2 0.7
(GNI*)
Italy 1.5 1.0 5.4 4.6 2.6 2.3 0.3
Netherlands 0.8 1.1 3.3 3.6 1.6 3.3 1.3
Norway 2.5 2.0 2.9 3.5 2.9 6.3 2.5
Portugal 1.3 1.5 3.6 6.9 2.5 3.1 0.8
Spain -1.6 2.3 3.8 6.7 3.0 3.5 0.9
Sweden 3.0 2.7 2.6 3.4 1.6 2.0 1.6
Switzerland 1.8 1.5 3.6 3.6 1.6 2.4 2.0
United
1.9 0.9 2.2 2.6 1.9 2.0 1.0
Kingdom
Table 4. Per capita GDP growth in successive periods
Source: Maddison Project Database, version 2020. Bolt et al., ‘Maddison style
estimates’. The CSO GNI* data for Ireland were kindly provided by John FitzGerald.
Note: Figures in parentheses indicate negative growth rates.
56
Crafts, Forging Ahead.
24Pessimism and despair were the order of the day. Asked to comment on the
situation by Studies, then a widely read and influential quarterly, an eminent Belfast-
based economist lamented how “(t)he statistical evidence, as far as it can be
interpreted, confirms general observation, that the Republic is falling further behind;
and it is falling behind, not only in income, but in the technical progress which creates
the promise of further income”. The enormous emigration and the huge fall in the
ratio of Irish to British share prices between 1950 and 1958 also captures the dominant
mood of economic pessimism.57
The economy’s dismal performance in the 1950s was mainly, though not
entirely, the product of poor economic policies. The lack of attractive foreign outlets
for agricultural produce hurt, both during World War II and later. But Irish insularity
and exceptionalism can be overdone. Wartime neutrality and partition complicated
Irish engagement with international organizations such as the UN and NATO, but
nonetheless Ireland was a founder member of the OEEC and European Payments
Union, the two key organizations promoting European trade liberalization during the
early 1950s. When it came to quotas, Ireland was the second least protectionist
economy in the OEEC in 1950, behind only Switzerland.58 Ireland started trying to
attract foreign direct investment relatively early: the Industrial Development
Authority was established in 1949, while the Irish Export Board, soon rechristened
Córas Tráchtála, was established in 1950. Tax relief on export profits was as we have
seen introduced in 1956. Irish tariffs were however slow to fall, mirroring what was
happening elsewhere along the European periphery, and they remained relatively high
in the 1960s.59
6. 1958-85
In the late 1950s Ireland finally entered a period of economic growth that would
last for several years. Motor vehicle registrations, one plausible proxy for consumer
confidence, suggest widespread gloom between early 1956 and mid-1957; car sales then
began to rise, being two-fifths higher in 1960 than in 1959, and annual sales would
57
Carter, ‘Irish economy’, p. 137; Ó Gráda, Rocky Road, p. 27.
58
Eichengreen, ‘Institutions’, p. 59.
59
O’Rourke, ‘Independent Ireland’.
25You can also read