Mobile nation The economic and social impacts of mobile technology - Deloitte
←
→
Page content transcription
If your browser does not render page correctly, please read the page content below

Mobile nation The economic and social impacts of mobile technology

MOBILE NATION:
The economic and
social impacts of
mobile technology

February 2013

Limitation of our work
General use restriction
This report is prepared solely for the use of the Australian Mobile Telecommunications
Association. This report is not intended to and should not be used or relied upon by anyone
else and we accept no duty of care to any other person or entity. The report has been prepared
for the purpose of reviewing the economic and social contribution of the mobile
telecommunications industry in Australia. You should not refer to or use our name or the advice
for any other purpose.

Liability limited by a scheme approved under Professional Standards Legislation.

© 2013 Deloitte Access Economics Pty Ltd
The economic and social contribution of mobile telecommunications

Contents
Glossary ..................................................................................................................................... i
Executive summary .................................................................................................................. iii
1        Introduction .................................................................................................................. 11
         1.1       Project approach and objectives...................................................................................... 11
         1.2       Report structure ............................................................................................................. 12
2        Industry overview ......................................................................................................... 13
         2.1       The changing mobile industry.......................................................................................... 13
         2.2       Market participants......................................................................................................... 16
         2.3       Market size ..................................................................................................................... 17
         2.4       Regulation ...................................................................................................................... 18
         2.5       Mobile devices and the National Broadband Network ..................................................... 20
         2.6       Industry trends ............................................................................................................... 21
3        Economic contribution .................................................................................................. 26
         3.1       Direct contribution.......................................................................................................... 27
         3.2       Indirect contribution ....................................................................................................... 29
         3.3       Total contribution ........................................................................................................... 30
         3.4       Forecasts ........................................................................................................................ 31
         3.5       Mobile enabling productivity growth............................................................................... 33
4        Business impacts of mobile ........................................................................................... 44
         4.1       Customers ...................................................................................................................... 45
         4.2       Marketing mobilised ....................................................................................................... 45
         4.3       Sales and finance ............................................................................................................ 46
         4.4       Flexible HR, building engagement.................................................................................... 47
5        Social impacts of mobile................................................................................................ 51
         5.2       Personal.......................................................................................................................... 52
         5.3       Relationships .................................................................................................................. 53
         5.4       Work............................................................................................................................... 54
         5.5       Community ..................................................................................................................... 55
         5.6       National .......................................................................................................................... 56
6        Conclusions ................................................................................................................... 58
References .............................................................................................................................. 59
Appendix A : Economic contribution studies ........................................................................... 64
Appendix B DAE-RGEM ........................................................................................................... 68

Liability limited by a scheme approved under Professional Standards Legislation.

Deloitte refers to one or more of Deloitte Touche Tohmatsu Limited, a UK private company limited by guarantee, and its network
of member firms, each of which is a legally separate and independent entity.
Please see www.deloitte.com/au/about for a detailed description of the legal structure of Deloitte Touche Tohmatsu Limited and
its member firms.

© 2013 Deloitte Access Economics Pty Ltd
The economic and social contribution of mobile telecommunications

Charts
Chart 1.2 : Mobile broadband traffic growth, Australia............................................................. vi
Chart 2.1 : Market share of subscriptions by carrier ............................................................... 16
Chart 2.2 : Total mobile subscriptions ..................................................................................... 17
Chart 2.3 : Mobile as a share of total telecommunications industry revenue ........................... 18
Chart 3.1 : Mobile broadband traffic growth, Australia............................................................ 32
Chart A.1 : Economic activity accounting framework ............................................................... 65

Tables
Table 2.1 : Network coverage .................................................................................................. 17
Table 3.1 : Industry revenue and value-add, 2011-12 $m ........................................................ 27
Table 3.2 : Earnings to employees (2011-12 $m) ..................................................................... 28
Table 3.3 : Employees (FTE), by carriers and resellers .............................................................. 28
Table 3.4 : Industry payments to government, 2011-12........................................................... 29
Table 3.5 : Indirect contribution (2011-12 $m) ........................................................................ 30
Table 3.6 : Total contribution, 2011-12 $m .............................................................................. 30
Table 3.7 : Industry forecasts .................................................................................................. 32
Table 3.8 : ICT and mobile use ................................................................................................. 40
Table 3.9 : Productivity scenario ............................................................................................. 41
Table 3.10 : Mobile contribution to productivity ..................................................................... 41
Table 3.11 : Summary ............................................................................................................. 42

Figures
Figure 1.1 Emerging structure of the mobile Industry ............................................................... iv
Figure 1.2 : Productivity gains from mobile devices ................................................................. vii
Figure 1.3 : Going mobile ....................................................................................................... viii
Figure 1.1 : Framework for the analysis ................................................................................... 12
Figure 2.1 : Old structure of the Mobile Industry ..................................................................... 13
Figure 2.2 : Emerging structure of the mobile Industry ............................................................ 14
Figure 2.3 Online activities undertaken by access device during June ...................................... 23
Figure 2.4 : Use of location services on mobile phones by Australians ..................................... 25

Deloitte Access Economics
The economic and social contribution of mobile telecommunications

Figure 3.1 : Total value added contribution ............................................................................. 31
Figure 3.2 : Total employment contribution ............................................................................ 31
Figure 3.3 : Productivity gains from mobile devices ................................................................. 34
Figure 3.4 : Productivity applications made available on the corporate network for mobiles,
smartphones and tablets ........................................................................................................ 35
Figure 3.5 : Productivity improvements from collaboration through social technologies ......... 36
Figure 4.1 : Going mobile ........................................................................................................ 44
Figure 4.2 : Mobile technologies and the cloud ....................................................................... 49
Figure 5.1 Mobiles affecting all aspects of society ................................................................... 51
Figure 5.2 : Work-life balance and mobile devices ................................................................... 55
Figure 5.3 : Parallel media usage in Australia, %, 2012............................................................. 57
Figure B.1 : Key components of DAE-RGEM ............................................................................. 68

Deloitte Access Economics

The economic and social contribution of mobile telecommunications

        Glossary
       2G                   Second Generation

       3G                   Third Generation

       4G                   Fourth Generation

       ABS                  Australian Bureau of Statistics

       ACCC                 Australian Competition and Consumer Commission

       ACO                  Australian Chamber Orchestra

       ACMA                 Australian Communications and Media Authority

       AMTA                 Australian Mobile Telecommunications Association

       Apps                 Application software

       BYOD                 Bring your own device

       DAE-GEM              Deloitte Access Economics’ Computable General Equilibrium Model

       ENG                  Electronic news gathering

       FTE                  Full-time equivalent

       GDP                  Gross Domestic Product

       GHz                  Gigahertz

       GPRS                 General Packet Radio Service

       GSM                  Global System for Mobiles

       HSDPA                High Speed Downlink Packet Access

       IMT                  Information, media and telecommunications industry

       LTE                  Long-Term Evolution

       M2M                  Machine-to-machine

       Mbps                 Megabits per second

       MDM                  Mobile device management

       MFP                  Multifactor productivity
Deloitte Access Economics                                                                     i
The economic and social contribution of mobile telecommunications

       MHz                  Megahertz

       MVNO                 Mobile Virtual Network Operator

       NBN                  National Broadband Network

       NFC                  Near-field communication

       PDA                  Personal Digital Assistant

       PSTN                 Public Switched Telephone Network

       RAV                  Relationships Australia Victoria

       TIO                  Telecommunications Industry Ombudsman

       VHA                  Vodafone Hutchison Australia

       WAP                  Wireless Application Protocol

       WiMax                Worldwide Interoperability for Microwave Access

Deloitte Access Economics                                                                    ii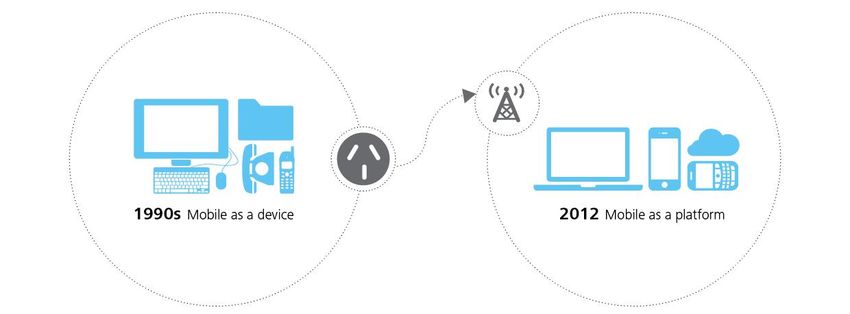
The economic and social contribution of mobile telecommunications
Executive summary
Recent years have witnessed a dramatic transformation in the mobile industry. The mobile
has become the dominant form of telecommunications technology; mobile broadband has
dramatically increased; smartphones and tablets have driven a trend towards convergence;
mobile has become critical in the digital strategies of business; and changing
telecommunications and media has been one of the dominant influences on society in our
time in history.
And yet, we may only be at the dawn of a new era in mobile technology. Growing
investments in 4G networks, along with the rollout and transition to the NBN, promise to
drive mobile even more deeply through our economy and society. M-commerce is in its
infancy. The most innovative apps and location-based services have probably not been
invented yet. It is against this background that the Australian Mobile Telecommunications
Association (AMTA) commissioned Deloitte Access Economics to report on the economic,
business and social impacts of the Australian mobile telecommunications industry.
Key points
The structure of the mobile industry is changing from a simple supply chain
to an emerging ecosystem of mobile businesses that encompasses mobile
web, apps, m-commerce and more.
To maximise the benefits of mobility in the digital economy, spectrum
policy must allow for the staged expansion of spectrum resources to
mobile broadband.
Convergence in devices will be complemented by increased integration
between networks, with mobile and fixed networks, including the NBN
being complementary and increasingly interdependent.
Mobile telecommunications industry revenue was $22.0 billion in 2011-12,
down 1.5% on the 2010-11 total, in contrast to the historic trend of high
growth in industry revenue.
The mobile industry is forecast to be stagnant in 2012-13. After a modest
recovery, it will grow to $25.9 billion by 2016-17 (by 18%). The total
economic contribution of the industry was $14.1 billion in 2011-12,
supporting 56,970 FTE employees.
Deloitte Access Economics iiiThe economic and social contribution of mobile telecommunications
The current wave of mobile technology is driving labour efficiency with
‘productivity apps’ and use of ‘down time’; it is also increasing capital
productivity: with estimated economic productivity benefits of $11.8
billion over the next decade.
Mobile is moving from a device for individuals to a platform for all of
business’ ICT needs: email, software, cloud, big data, and m-commerce.
Driven by customers and employees, it has significantly changed how
marketing, HR and IT functions operate.
Mobile technology is driving significant changes in society – influencing
individual identity, relationships, work-life balance, communities and
national media – with the full impacts not yet known.
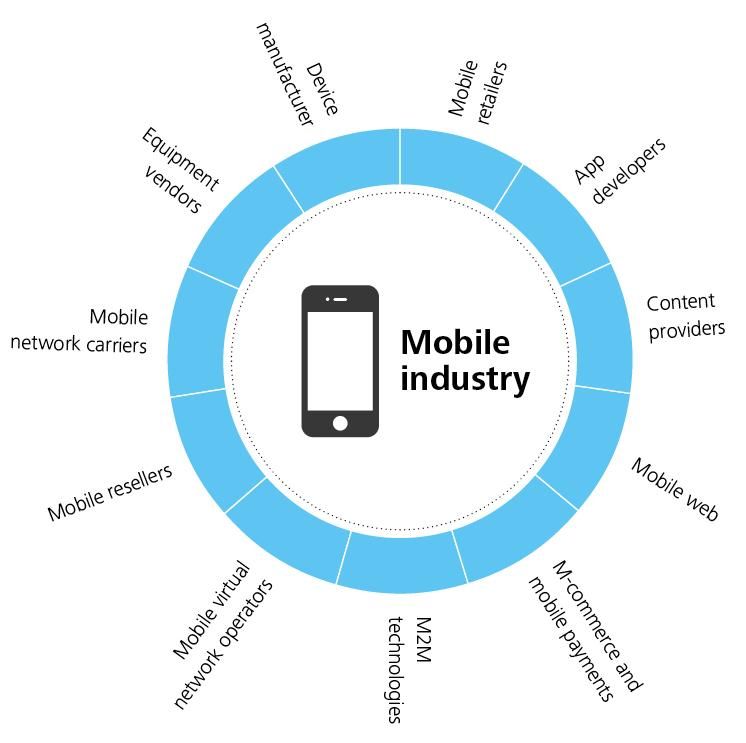
The mobile industry: an emerging ecosystem
A key finding is that the industry is changing from what was once a relatively simple supply
chain from hardware manufacturers to final customers to an emerging ecosystem of mobile
technologies driving economic change and economic productivity growth.
Figure 1.1 Emerging structure of the mobile Industry
Source: DAE
Deloitte Access Economics ivThe economic and social contribution of mobile telecommunications
Spectrum
The most critical issue for the mobile sector is policy and regulation with regard to
spectrum allocation and licensing. Significant investments in spectrum and other
infrastructure required to support the deployment of mobile networks have delivered
significant economic productivity to Australia.
Demand for spectrum is increasing as significant investments in mobile networks have
enabled the full capabilities of the new mobile devices to materialise.
To maximise the benefits of mobility in the digital economy, spectrum policy settings must
be reviewed and allow for the staged expansion of spectrum resources to mobile
broadband.
Convergence
Convergence of communications and media is where a user can access a range of
multimedia services using varied devices and network connections.
The recent Australian Government ‘Convergence Review’ examined the policy and
regulatory frameworks that apply to the converged media and communications landscape
in Australia.
The Review focussed on media ownership laws, content standards, production and
distribution of Australian local content, and spectrum allocation.
This is an important area where government action will be required to address existing and
emerging problems in the current legal and regulatory framework.
Economic contribution
One measure of the size of the mobile telecommunications industry is output, which was
$22.0 billion in 2011-12, down 1.5% on the 2010-11 total. Recent mixed results among
carriers have come after a strong period of growth over the past decade.
Subscription numbers have largely driven the increases in revenue over the past five years,
however, this has begun to slow as the market reaches saturation point with a mobile
penetration rate of well over 100% (more than 30 million mobile services) according to the
ACMA’s 2011-12 Communications Report. In 2011-12, conditions also reflected other
factors such as mobile repayment options, service to equipment ratios, mobile termination
rates, changes to plans and user behaviour, market share changes, and generally slower
growth in non-handset mobile growth.
For 2011-12, the total value added by the industry was $14.1 billion, with $7.6 billion direct
contribution and $6.5 billion indirect activity in related sectors and across the economy.
Total employment supported by the industry is 56,970 full-time equivalent employees, with
22,340 direct FTE employees.
Deloitte Access Economics vThe economic and social contribution of mobile telecommunications
Forecasts for growth
After years of strong growth, weaker conditions in the mobile telecommunications sector
have seen forecasts for revenue revised down. After contraction in 2011-12 and stagnation
(in real terms in 2012-13), the industry will experience a modest recovery in 2013-14.
The medium term outlook for the industry is unusually uncertain. On the one hand, strong
growth in demand for data and the increased capability of 4G networks will support
growth. Some factors that have weighed on growth recently will have passed. On the other
hand, recent weaker conditions could reflect structural change in the industry. Strong
competition, especially from over-the-top (OTT) operators using mobile apps could change
industry dynamics. How fast machine to machine technologies grow also contributes to
uncertainty.
With this uncertainty in mind, industry revenue is expected to have grown to $25.9 billion
by 2016-17 (2011-12 terms) – an 18% increase compared with 2011-12. Total value add is
expected to grow to $16.6 billion (18%). By 2016-17, total employment by the industry
(direct and indirect) will have grown by 8% to over 61,280 FTE jobs.
While there have been mixed revenue outcomes for the industry, the growth of Australians’
use of mobile technology is much clearer: it is expected to grow strongly. This means
carriers will invest more in infrastructure to support data usage growth but not receive as
high revenue growth.
Australian mobile broadband traffic growth is expected to grow strongly over coming years.
In 2011, an average of 8.8 petabytes per month were used, with this anticipated to grow to
119.3 petabytes per month by 2016 (Cisco, 2012) – a 14 fold increase.
Chart 1.2: Mobile broadband traffic growth, Australia
Source: Cisco (2012)
Productivity benefits
The productivity benefits of mobile devices have been assessed by considering the growth
in the economy’s multifactor productivity across all industries from ICT. Our central result
is that the current wave of mobile technologies will result in a productivity benefit to the
Deloitte Access Economics viThe economic and social contribution of mobile telecommunications
Australian economy of $11.8 billion over the period to 2025. In the year 2011 alone, this
contribution to the Australian economy is estimated to be $495 million. These productivity
benefits are expected to grow over time – to $1.3 billion by 2016 and to $1.8 billion in
2025.
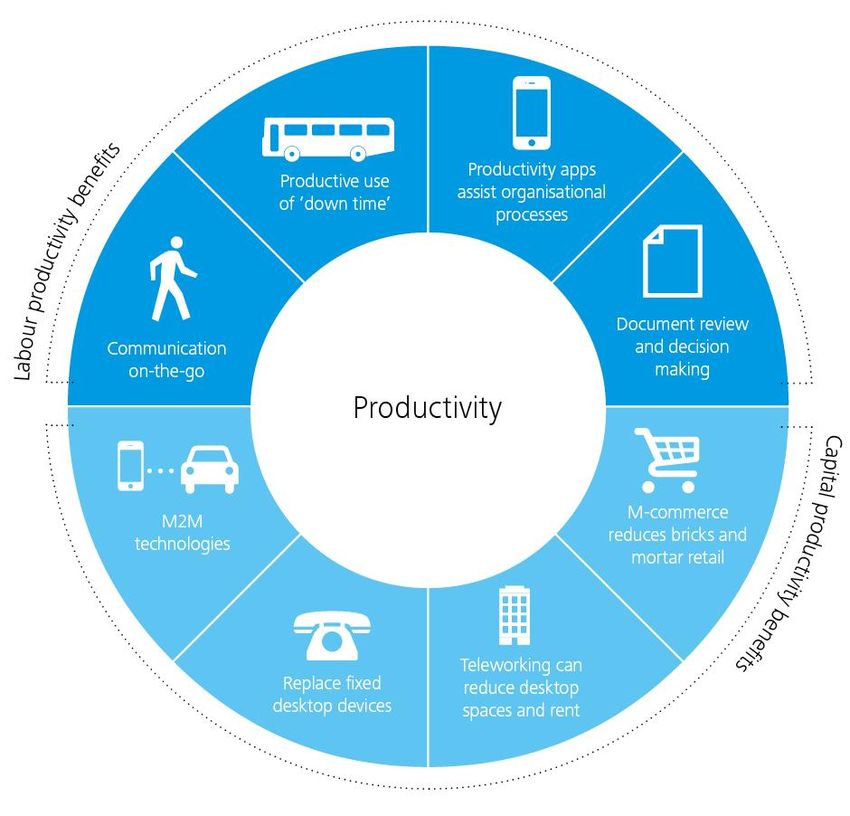
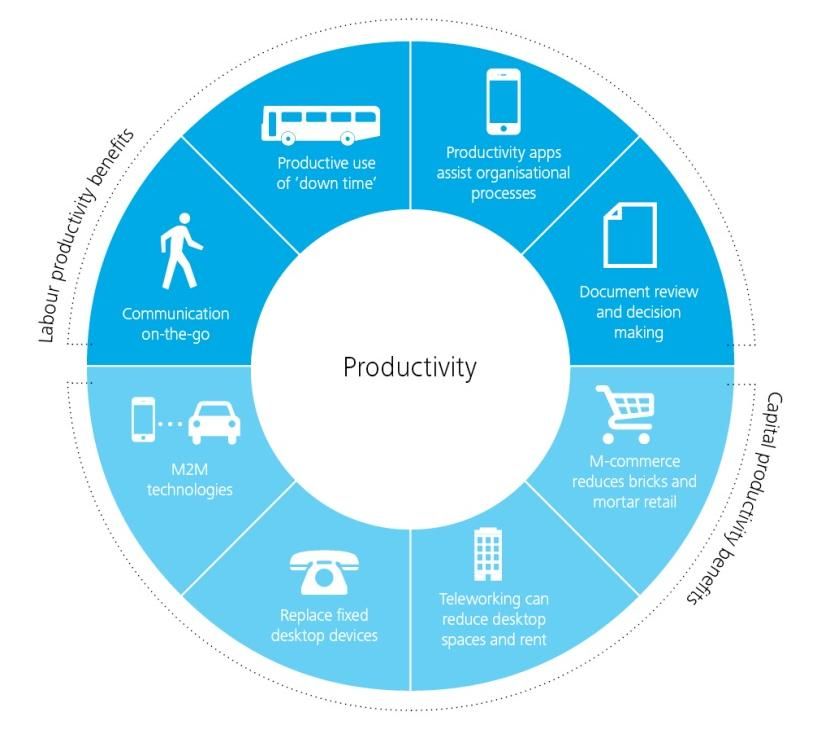
There are many ways mobile technologies contribute to productivity for an individual
business – for labour or capital (including land).
Figure 1.2: Productivity gains from mobile devices
Enabling Productivity in the Australian Economy
Mobile’s contribution to productivity growth is also important in the context of Australia’s
overall productivity performance. Productivity is important because it the long term, it
represents technical progress that contributes to economic growth and improved living
standards (ABS, 2011).
In the most recent productivity cycle (from 2003-04 to 2007-08), Australia’s ‘multifactor’
productivity growth (MFP), which measures output per unit of labour or capital input, was 0.0%
a year. That compares with 1.2% in 1998-99 to 2003-04 and a massive 2.5% in 1993-94 to 1998-
98.
With the capacity to enable more productivity growth, technology developments in the mobile
sector and their diffusion throughout the economy has the potential to reverse Australia’s
declining productivity performance.
Deloitte Access Economics viiThe economic and social contribution of mobile telecommunications
Business impacts
Mobile telecommunications is becoming a deeply integrated part of an organisation’s
digital strategy. While mobile phones have been an important business tool for at least 15
years, they have previously stood separate from other digital technologies. Now,
everything digital is also going mobile: computers, software, the internet, cloud and social
media.
Figure 1.3: Going mobile
Source: DAE
A key feature of the latest wave in mobile innovation is that it is being driven by people – by
consumers and by employees. This reverses the trend of previous decades when
technological developments came from government research agencies and the IT
departments of large businesses. With the simple motivation for more convenient and easy
to use devices, individuals are dramatically changing how business operates.
Mobile is changing interactions with customers – it is a source of sales / revenue, and a
marketing and engagement opportunity, with new behavioural and geo-locational targeting
strategies. For some businesses it is a service delivery channel. Many businesses are
expected to adopt point of sale technologies, such as virtual wallets, in coming years.
Mobile is also changing business operations. The trend towards bring your own device
(BYOD) is an opportunity to build engagement with employees, and possibly achieve
greater retention and loyalty. Increased communications and applications can mean better
use of down time, and present administrative and organisational opportunities. Machine to
machine technologies have the potential to transform capital use.
Cloud based services allow device and location independence; users are able to access
systems using a web browser regardless of their location or what device they are using. As
infrastructure is off-site and accessed via the Internet, users can connect from anywhere.
Deloitte Access Economics viiiThe economic and social contribution of mobile telecommunications
E.1: Industry views
Perspective Who said it?
“Being able to communicate with workers who are not in the Malcolm Parker,
office and being able to send files and photos using smartphones Wyndham Vacation
increases productivity.” Resorts
“Productivity gains arise from the ability for employees to utilise Denise Carson, UXC
downtime, as well as the use of integrated mobile technologies Ltd.
to digitise manual processes.”
“In the days before digital, the tools of the trade for the Ken McSwain,
Australian Chamber Orchestra (ACO) were cellos and music Systems and
stands. Now, mobile devices are equally important – allowing Technology
musicians to share new musical ideas and amend the notes for Manager, Australian
concerts while on the go.” Chamber Orchestra
“We believe that the proliferation of mobile devices and the need NBN Co.
to service those devices will be one of the key areas driving
demand for the NBN.”
“Voice calls make up only a quarter of the time people spend on Ericsson
their mobile devices. This means that customer expectations for
network performance, including lower latency and high-speed
download and upload performance, have increased dramatically.
Infrastructure providers are now working on how mobile network
architectures as well as end-user service pricing structures can be
better managed to cope with surging demands.”
“Data-hungry devices and user service expectations have created Alcatel Lucent
a looming crisis of user satisfaction. Part of the solution may be
to use small cells, bringing wireless access points closer to users
to address network coverage, congestion and energy efficiency.”
Deloitte Access Economics ixThe economic and social contribution of mobile telecommunications
Social impacts
Mobile technologies are changing the way we experience and engage with everyday life.
Beyond the transformative impact of mobile phone calls; mobile technology now has
mobile web, apps, smartphones and mobile broadband to influence every sphere of
society.
For individuals, mobile devices are not just for communication. They offer rich digital
experiences on the go. Photos, music, games, location-based services, maps, the internet
and the millions of features offered by apps can all fit in your pocket.
There are mixed effects of mobile phones on work-life balance. The shift to data-enabled
devices makes it even easier for employees to work from home without being tied to the
office desk. Previous research has found mobile phones a positive for work life balance. Of
course, some consider that increased mobility facilitates more work at home and can make
people feel “always on” and affect the quality of leisure time.
On a national level, mobile devices are changing the nature of the media: with the ease of
capturing and distributing user-generated content allowing every individual to become a
broadcaster. Crowd-sourced ‘on the spot’ reporting has been used for everything from
traffic updates to monitoring bushfires.
E.1: Industry views
Perspective Who said it?
“You have this sense of continuous connection; it’s like Hugh Mackay, Social
being in a strand of a web which is continuously Researcher
vibrating. Part of this feeling of being in a ‘cyber tribe’ is
illusory, but some of it is real; it is important to note
that some of this tribalism is purely cyber…The big
emotional benefit of this revolution is paradoxical. If
you’re contacting people using a mobile device, you are
further away from them; the richness of interpersonal
encounters is largely lost if you rely on a mobile
connection…We’re treating the exchange of data as if it
is the same thing as communication. In doing so, we
lose something quite precious in the richness of our
encounters.”
“You used to hear people say ‘I’m not a doctor or a Yvonne Adele, formerly Ms
nuclear scientist. Why do I need to be contactable all Megabyte
the time?’ Now the same people find mobile phones
compelling and useful; they feel like they couldn’t do
without them.”
Deloitte Access Economics
Deloitte Access Economics x1 Introduction The mobile telephone has become the dominant form of telecommunications technology in Australia over recent years, with more than twice as many mobile handset subscriptions in Australia than subscriptions to any other telecommunications service. The use of mobile telecommunications has been a key enabler of productivity benefits for businesses. Over recent years, the rapid development and diversification of mobile broadband has been the driving force of industry activity. It wasn’t long ago that use of mobile data was largely limited to email on mobile handsets, today a wide range of applications and uses for mobile handsets are stimulating adoption and use of the technology. The use of mobile broadband across a wider range of devices – in particular laptops and tablets – has seen a rapid increase in the number of subscriptions as well as the volume of traffic. The industry has undergone consolidation in recent years, with the four network carriers reduced to three with the merger of Vodafone and Hutchison into Vodafone Hutchison Australia (VHA). At the same time, the number of mobile resellers has declined, as has the market share of resellers, as these much smaller firms merge either with one another or with a major carrier. The industry has progressed investment in 4G networks to meet the growth in demand for mobile broadband in a market that has experienced weaker revenue growth. The “Digital Dividend” auction will see the release of new spectrum that will help meet strong growth in demand for mobile broadband. According to industry, it is also important to progress planning to define the quantity and timing of the release of future spectrum resources for mobile broadband post the “Digital Dividend” and the need for a comprehensive policy review about how efficiently spectrum is allocated and managed. It is against this background that the Australian Mobile Telecommunications Association (AMTA) commissioned Deloitte Access Economics to report on the economic significance and contribution of the Australian mobile telecommunications industry. As well as the economic value, the task involves review of the importance of the technology in business use as well as the social value of mobile telecommunications. 1.1 Project approach and objectives This is the fifth in a series of reviews of the economic importance of the mobile telecommunications industry undertaken by Deloitte Access Economics and its predecessor. However, this study goes beyond a mere update of the previous iterations. The rapid growth in the uptake and use of mobile broadband and the diversification of its applications mean that the previous approach – with a strong voice focus – has become somewhat dated. As a result the methodology has been revised to better consider the role of mobile broadband.
This report analyses the mobile sector. For the contribution to the Australian economy, we
focus on mobile telecommunications industry: activity generated by mobile network
operators. This part of our analysis does not include treatment of Wi-Fi, a popular
technology that links mobile devices with fixed telecommunications.
However, when we look more broadly at how mobile technologies are driving productivity
growth and changing business, we are indirectly taking into account their convenient
features and therefore their compatibility with Wi-Fi. We also discuss how mobiles are one
of the main factors driving changes in Australian society. Figure 1.1 outlines Deloitte Access
Economics’ framework for the analysis.
Figure 1.1: Framework for the analysis
Source: DAE
1.2 Report structure
The report is organised as follows:
Chapter 2 provides a snapshot of the Australian mobile telecommunications industry.
Chapter 3 reviews the direct and indirect economic contributions of the industry,
including the productivity gains that mobile telecommunications have enabled.
Chapter 4 considers the business impacts of mobile telecommunications.
Chapter 5 reviews the social impacts of the industry.
The report finishes with some concluding remarks and observations.
Deloitte Access Economics 122 Industry overview
2.1 The changing mobile industry
Recent years have witnessed a dramatic transformation in the mobile industry. In what
was once a relatively simple supply chain from hardware manufacturers to final customers,
there is now a developing ecosystem of mobile technologies changing the economy. This
ecosystem involves active and not just passive infrastructure, which has the potential to
transform other industries which utilise mobile technologies.
It will be some time before these trends are fully understood, but already, the changed
structure of the sector is beginning to take shape.
Figure 2.1: Old structure of the Mobile Industry
Content
Suppliers &
Aggregators
Carriage Service Providers
Mobile Network Carriers
Customers
Hardware Retailers
Pre-paid
Providers
Resellers
Post-paid
Mobile
Virtual
Operators
Deloitte Access Economics 13Figure 2.2: Emerging structure of the mobile Industry
Source: DAE
The mobile industry requires several entities to work together. Some firms operate across
multiple sectors of the industry while others have only some activities related to mobile
technologies.
Commercial/market terms
Devices manufacturers are responsible for manufacturing and supplying handsets and
associated equipment to end-users. A large proportion of this is undertaken overseas,
with most handsets shipped to Australia ready to sell.
Equipment vendors are responsible for building and maintaining the extensive
telecommunications network (including base stations, switching equipment, antennas
and towers).
Mobile retailers offer mobile services to end users on behalf of carriage service
providers. Most carriage service providers have their own retail shops where customers
can purchase hardware, particularly handsets and USB dongles, and enter into
contracts with the provider to access services. There are also ‘non-branded’ specialty
telecommunications retailers and other retail outlets. There are also other retail outlets
that offer hardware and services, such as supermarkets and Australia Post.
Deloitte Access Economics 14 App developers are a range of agencies, dedicated app developers and brands that
produce mobile applications for sale, to facilitate customer or business interactions or
to build brand for a company.
Content providers deliver information and entertainment services, which are sourced
and purchased from a variety of channels before being structured and bundled for
distribution over mobile networks.
Mobile web refers to the use of internet-connected applications, or browser-based
access to the internet from a mobile device – such as a smartphone or tablet PC –
connected to a telecommunications network.
M-commerce refers to the conduct of commerce using a mobile device, such as a
mobile phone, a tablet or other emerging mobile equipment. An associated and
emerging concept is mobile payment or ‘mobile wallet’ which refers to payment
services performed from or via a mobile device.
M2M is machine-to-machine technologies, denoting technologies designed to facilitate
communication between appliances using mobile technology. For example, M2M
technology has been used to let the developers of products know when certain
products need to be taken in for maintenance and for what. Another application is the
monitoring of systems such as utility meters. M2M has the potential to benefit many
industries, including health, transport and logistics, and education, driving productivity,
labour savings and operational efficiency improvements in these sectors.
Legislative terms
Carriage service providers provide telecommunications services to households and
businesses using carrier network infrastructure. There are several levels of these.
• Mobile network carriers are primarily engaged in operating and maintaining
switching and transmission facilities that provide direct communication via
airwaves.
• Mobile resellers provide telecommunications services by use of a network
owned by a third party (i.e. a mobile network carrier) but bill customers in
their own names.
• Mobile virtual network operators (MVNOs) are value adding entities that use
an existing network to sell a service, usually one linked to other branded
services. Unlike mobile resellers, MVNOs purchase wholesale mobile capacity
from network carriers.
Content service providers are defined under section 97 of the Telecommunications Act
1997 as a person who uses or proposes to use a listed carriage service (a carriage
service between points inside and/or outside Australia) to supply a content service to
the public.
Content service is defined under section 15 of the Telecommunications Act 1997 as:
• a broadcasting service (as defined in the Broadcasting Services Act 1992 (for
example, television and radio services))
• an on-line service (including those for information and entertainment) and
• a service specified in a written determination made by the Minister.
Carriers are holders of carrier licences, that is, one granted under section 56 of the
Telecommunications Act 1997.
Deloitte Access Economics 152.2 Market participants
There are three mobile network carriers in Australia.
Telstra is the former government provider of telecommunications services in Australia.
Now a fully privatised publicly listed company, it provides a wide range of
telecommunications services and in 2011-12 accounted for 46% of carrier-owned
mobile subscriptions in Australia.
Optus was the first full service competitor to Telstra. In 2011-12, it accounted for 31%
of carrier mobile subscriptions in 2011-12.
The 2009 merger of Vodafone and Hutchison to form Vodafone Hutchison Australia
(VHA) means that the market is now contested by three major participants that are
much closer in size than previously. In 2011-12 the merged company accounted for
23% of carrier mobile subscriptions.
As well as the major carriers a number of smaller mobile resellers, without their own
physical infrastructure network, provide retail services to consumers. The role of resellers
has declined in recent years, with many of the larger providers merging with carriers. At
the same time, the shift towards 3G and data usage seems to have favoured the carriers in
terms of subscription activity.
Chart 2.1: Market share of subscriptions by carrier
Source: ACMA 2012
Deloitte Access Economics 16Table 2.1: Network coverage
Carrier Population coverage Frequencies and networks
(aggregate)
Telstra 99% 1800MHz (4G LTE)
850MHz (NextG 3G)
2100Mhz (3G)
900 MHz and 1800 MHz (2G)
Optus 97% 2100MHz (national 3G)
900MHz (national 3G and 2G)
1800MHz (metro 2G and 4G
selected markets)
VHA 94% 2100MHz (urban 3G)
900MHz (regional 3G)
850MHz (new 3G data
network)
900MHz and 1800 MHz (2G)
Source: ACMA 2011, IBISWorld 2012, industry figures
Coverage of 3G mobile networks now effectively matches that of older, 2G networks. More
than 99% of Australia’s population receives coverage from at least one of the three carriers,
although there remain some coverage blackspots where reception is poor or network
congestion issues exist. The highly urbanised nature of Australia’s population also means
that, while the majority of the population receives coverage, large unpopulated parts of the
country mean that the land mass coverage is substantially lower.
2.3 Market size
At June 2012 total mobile subscriptions in Australia reached 30.2 million, well more than
one per person. Of these, 24.3 million are mobile phone handset subscriptions (9% growth)
and 5.9 million are mobile broadband (ACMA, 2012).
Chart 2.2: Total mobile subscriptions
Source: ACMA 2010, ACMA 2012
Deloitte Access Economics 17There are now 16.2 million mobile handset internet subscribers – and in 2012 the ABS
stopped collecting separate data on the proportion with dedicated data subscriptions (ABS
2012). Volumes are increasing as well, with 25.3 terabytes on mobile broadband in the
quarter ending June 2012 and 6,610TB on mobile handsets (ABS, 2012).
Overall, mobile telecommunications is making up a greater share of industry revenue,
compared with fixed telecommunications.
Chart 2.3: Mobile as a share of total telecommunications industry revenue
60%
Share of industry revenue
50%
40%
30%
20%
10%
0%
2005-06 2006-07 2007-08 2008-09 2009-10 2010-11
Mobile 0.36 0.38 0.41 0.44 0.47 0.5
Source: ACMA 2011
2.4 Regulation
The main regulatory body is the Australian Communications and Media Authority (the
ACMA). The specific responsibilities of the ACMA include regulating compliance with
legislation, licence conditions and the like; reporting on matters relating to the
communications industry, including its performance; and issuing telecommunications
licences and allocating and licensing radiofrequency spectrum.
Under the Telecommunications Act 1997 (Cth), the telecommunications industry has broad
scope for self-regulation. The industry has developed a range of industry codes, primarily
via the Communications Alliance industry group (CA). The ACMA registers
telecommunications codes developed primarily by CA. The ACMA may act in response to a
complaint of a breach of one of these codes as well as more formal regulation.
The Telecommunications Industry Ombudsman (TIO), which carriers and carriage services
providers are obliged to join, may also be responsible for responding to breaches of these
codes. The TIO is funded by members, and is a dispute resolution body for residential and
small business customers and their service providers.
The Telecommunications Consumer Protection (TCP) Code was registered by the ACMA on
1 September 2012, replacing the 2007 Industry Code. It applies to all Carriage Service
Deloitte Access Economics 18Providers in Australia and is a code of conduct providing community safeguards related to
areas such as sales, service and contracts, billing and complaint handling.
Convergence
Convergence of communications and media is where a user can access a range of
multimedia services using varied devices and network connections. In a converged world
there is less of a distinction between transmission channels – you can now watch television
on your mobile or computer.
Developments in technology have led to significant changes in the communications and
broadcasting landscape. Existing legislation has become dated in a converged world. This
market change prompts a rethink and review of Australia’s existing policy and regulatory
framework to ensure opportunities and potential threats are appropriately managed in this
environment.
The Australian Government’s Convergence Review was completed on 30 March 2012, and
examined the policy and regulatory frameworks that apply to the converged media and
communications landscape in Australia. The Review focussed on media ownership laws,
content standards, production and distribution of Australian local content, and spectrum
allocation.
In November 2012, there was an initial Australian Government response, but a complete
reform agenda could take several years. This is an important area where government
action will be required to address existing and emerging problems in the current legal and
regulatory framework.
Spectrum
The critical issue for the sector is policy and regulation with regard to spectrum allocation
and licensing. Significant investment in spectrum and other infrastructure required to
support the deployment of mobile networks have contributed to delivering mobile services
that enable the economic productivity benefits derived through mobile as a platform.
Spectrum is regulated in accordance with the Radiocommunications Act 1992, with the
ACMA the independent statutory authority responsible. Demand for spectrum is increasing
due to substantial growth in the number and capabilities of mobile devices. Cisco estimates
that between 2012 and 2016, Australia is forecast to experience a seven-fold increase in
mobile traffic volume.
From a policy perspective, the Australian Government’s focus has been on providing
certainty to licence holders in retaining existing spectrum holdings and providing
opportunities to acquire new capacity.
Spectrum licence reissue
The recent conclusion of the spectrum licence reissue process will see a broad range of
spectrum used to deliver current and next generation mobile broadband services offered
for reissue in the public interest to existing licensees, including, Telstra, Optus and
Vodafone Hutchison Australia.
Deloitte Access Economics 19Key stakeholders have flagged the importance of a review of the legislative process that
governs licence reissue to provide a greater certainty to licencees and a more efficient and
streamlined process as part of a broader reform of spectrum allocation under the
Radiocommunications Act 1992.
Digital Dividend Auction
The Digital Dividend auction will allocate spectrum in the 700MHz band – previously used
to transmit analogue television services – and 2.5GHz band – used for outdoor broadcasts
by free to air and subscription television broadcasters.
The auction will be managed by the Australian Communications and Media Authority.
Beyond the Digital Dividend
The Australian Government has started its consideration of how future demand for mobile
broadband will be met with ACMA issuing its “Towards 2020 – Future spectrum
requirements for mobile broadband” paper in 2011.
This paper estimates that an additional 300MHz of spectrum is required by 2020 to meet
future demand for mobile broadband. This will need to be obtained through new
allocations, improved efficiency of use and accessing under-utilised spectrum.
It is possible that the estimated 300MHz of spectrum will not be sufficient to meet future
demand and that there would be merit in further industry engagement.
Increased constraints on mobile network infrastructure will reduce the capacity of the
industry to meet the growing demand for mobile broadband from customers. To maximise
the benefits of mobility in the digital economy, spectrum policy settings must be reviewed
and allow for the staged expansion of spectrum resources to mobile broadband.
2.5 Mobile devices and the National Broadband
Network
Alongside the growth of smartphones and the shift to 4G networks, the other big
development in digital technologies is the enhancement of fixed networks: the National
Broadband Network. Recent developments suggest that mobile and fixed technologies are
complementary means of network access – that is, people are using both networks. In
addition, the traditional boundaries between services are becoming blurred.
The NBN aims to increase broadband capabilities across the nation with a mixture of optical
fibre, fixed wireless and satellite technologies. As currently designed, it will be a national
wholesale-only, open-access data network; the biggest infrastructure project ever
undertaken by the Australian Government. While it is a fixed service, the NBN will also
benefit from mobile trends.
Convergence means that devices are no longer mobile phones using mobile networks.
These devices, including smartphones and tablets, can now easily switch between 3G/4G
mobile networks and Wi-Fi/fixed networks. Consumers can get the flexibility of mobile and
Deloitte Access Economics 20capacity of fixed without having to ‘plug in’ to a network or manually switch between
networks. These devices are now being talked of as the ‘first screen’ for media consumers.
According to a 2011 Google survey, one in two people use smartphones while watching TV,
while Ericsson research (2012) showed that 62% of people visited social networking sites
while watching TV. Further, it is estimated that users are in range of a Wi-fi hot spot 70% of
the time (ACG Research, 2012).
We note a projection by Cisco (2012) that by 2016, Wi-Fi fixed traffic will increase as a
proportion of total fixed traffic from 65% to 70%.
Mobile devices can be used with both mobile and fixed networks – they are complementary
means of access to data. The growth of mobile devices is likely to be a significant driver of
demand on the NBN.
“We believe that the proliferation of mobile devices and the need to service those devices will be
one of the key areas driving demand for the NBN.” NBN Co
In addition, traditional distinctions between mobile and fixed infrastructure networks are
becoming blurred:
Mobile networks are more dependent on fibre backhaul to cope with surging demand
for capacity (although the NBN is not proposing any mobile-specific infrastructure);
Fixed networks are becoming more flexible at their termination points, including Wi-Fi
in the home and the potential for this capacity to be offered publicly.
Wi-Fi offload and Fon
Wi-Fi offload moves mobile traffic from mobile to fixed line networks and improves performance.
According to one study, 65% of a typical smartphone user’s data traffic can be off-loaded to Wi-Fi
(Lee et al, 2010).
In the United Kingdom, BT Fon is a network of 7 million Wi-Fi hotspot locations. When households
agree to provide some of their fixed home broadband to other BT Fon members via Wi-FI they can
also access the same from other people.
Wi-Fi offload and initiatives like BT Fon have the potential improve mobile services, mobile network
performance and increase the uses of fixed networks.
2.6 Industry trends
2.6.1 Mobile data
The growth in the use of mobile data has been the key trend in the industry over recent
years. Growing from close to zero just five years ago, mobile broadband accounted for 47%
of all internet subscriptions at December 2011 (ABS 8153.0). A wide range of devices now
utilise mobile broadband services, leading to rapid growth in uptake as well as use of these
services.
Deloitte Access Economics 21According to Ericsson, a supplier of mobile telecommunications network infrastructure, voice calls
make up only a quarter of the time people spend on their mobile devices. This means that customer
expectations for network performance, including lower latency and high-speed download and
upload performance, have increased dramatically.
Infrastructure providers are now working on how mobile networks and pricing structures can be
better managed to cope with surging demands. See, for example, Ericsson ConsumerLab’s Smart
Mobile Broadband (Ericsson, 2012).
The ACMA (2011) nominates several factors driving the increasing uptake of mobile
broadband.
Improvements in 3G technology, network coverage and capacity, in particular faster
download and upload speeds.
The increasing functionality of mobile phone handsets, including features such as touch
screens and on screen keyboards that make them more readily amenable to higher
volume use than older numeral keypads.
Developments in tablet computer technology – devices such as the iPad and Samsung
Galaxy tab have made highly capable portable computing far more portable since 2010,
with an associated spike in usage.
Providers competing on price and payment options to attract this growing segment of
the market, with a large share of the growth in mobile revenue coming from the data
space.
A wider range of applications and services – from productivity enhancers like online
mobile banking through to games and social applications, the range of data-based
activities that can be undertaken on a mobile device have led to a substantial increase
in the use of mobile broadband.
According to Alcatel Lucent, the combination of more data-hungry devices and higher user service
expectations has created a ‘perfect storm’ for mobile broadband providers, and a looming crisis of
user satisfaction. Businesses are already aware that part of the solution may be to use small cells,
bringing wireless access points closer to users to address network coverage and congestion issues,
while also improving energy efficiency.
While accounting for almost half of internet subscriptions, mobile technologies only
account for 7% of total data downloaded (ABS 8153.0). This indicates that mobile
broadband is still viewed by many as a complementary technology. So while many are
taking advantage of the ability to use mobile broadband while on the move, fixed
broadband services – which still provide higher average speeds – remain the main internet
connection used.
Accessing the internet using mobile handsets has increased dramatically in recent years. In
June 2009, just 9% of people used the internet via a handset; in June 2012, that figure was
32%. For many areas of internet use, mobile devices are ‘catching’ the computer in usage
levels. For example, in June 2012, 38% of people were mobile banking compared with 67%
online banking; this compares with 28% and 68% a year earlier.
Deloitte Access Economics 22Figure 2.3 Online activities undertaken by access device during June
90
% of internet users aged 14 years and over
80
70
60
50
40
30
20
10
0
communication research and banking and entertainment
(email/IM/VoIP) information finance and amusement
Computer (June 2011) Mobile phone (June 2011)
Computer (June 2012) Mobile phone (June 2012)
Source: Roy Morgan Single Source, June 2012, cited in ACMA 2012
New network investments
Carriage service providers are investing in network mobile network infrastructure to cope with
surging demand.
VHA has made a billion dollar investment in the 850MHz network, rolling out alongside existing 3G
networks to improve network capacity and reliability. It is also preparing for 4G.
Since 2009 (FY10), Optus has invested more than $1.8 billion in its mobile network, doubling network
capacity in metro areas with its 2100MHz and 900MHz networks operating together to strengthen
in-building coverage. It will also continue its rollout of an LTE network in 2013.
Further, Optus is investing in femto cell technology, allowing users to have personalized and
dedicated mobile coverage in the home. It is also likely to expand this to enterprise users (Optus,
2011).
Telstra has launched LTE 4G services in major CBDs, including some airports, with capable devices
operating on a dual band so they switch between the 4G and Next G networks based upon
availability. For FY2013, Telstra has announced it would invest a further $1.2 billion on its mobile
network.
2.6.2 Mobile commerce
E-commerce has grown rapidly in Australia in recent years. This might reflect lower prices,
reduced search costs and the greater range available online.
Mobile internet (i.e. via smartphones) appears to be playing an increasing role in
e-commerce. Communications Day (Issue No. 3845, September 2010) reported that
research commissioned by eBay and conducted by Pure Profile shows that around one in
Deloitte Access Economics 23four Australian mobile phone owners use their device to make an online purchase,
including more than 80,000 on eBay alone in June 2010.
Around 43% spent between A$50 and A$250 a month shopping via their
mobiles, with 17% spending over the A$250 mark monthly. In January 2010,
less than 98,000 items were purchased on eBay via mobile, at a total value of
under A$7 million; these numbers shot up to 220,000 and over A$13 million
respectively for July 2010.
In addition to using the internet to make actual purchases, many Australian consumers use
the internet for research. According to Sands and Ferraro (2010), up to 50% of Australians
search online for information about products prior to purchasing them in-store. A wide
range of online resources are utilised in this research process, including company websites,
social networking sites, online reviews both formal and informal, and ratings and consumer
information websites.
2.6.3 Location-based services
Location-based services are generally different to mobile commerce because they are more
likely to relevant to an individual’s location and often do not involve charges. Mostly,
location-based services are based on using individual information for marketing or other
business purposes.
According to ACMA (2012), 37% of Australian adults had access a location service on a
mobile phone in the six months prior to May 2012. Some location-based services simply
provide information, such as getting directions. Others have a service related to social
media. Finally, others tag the user to their location and link it to something else.
Deloitte Access Economics 24You can also read