FASSET SECTOR SKILLS PLAN 2021/22 UPDATE - August 2020
←
→
Page content transcription
If your browser does not render page correctly, please read the page content below

SSP 2021/22 Update
                             August 2020

       FASSET
SECTOR SKILLS
  PLAN 2021/22
      UPDATE
        August 2020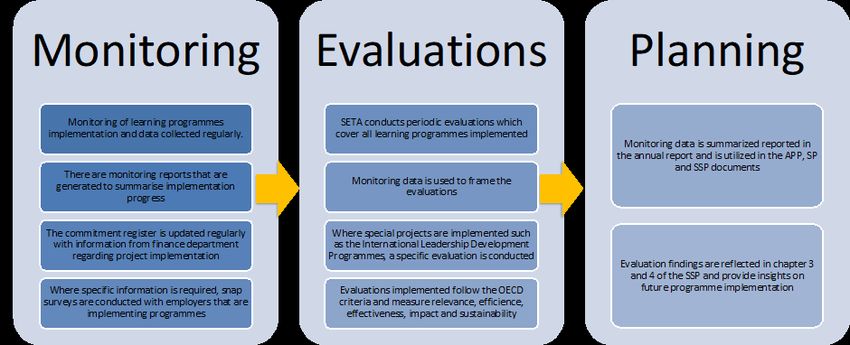
SSP 2021/22 Update
                                                                                                     August 2020

FOREWORD
As we face this pandemic which is having such significant consequences for not only the health of the
populace, but also the economy of nations across the world, this annual Sector Skills Plan (SSP) update
provides essential knowledge for the SETA Board to make decisions concerning the allocation of funding
and interventions needed to meet both sectoral and national priorities.

This SSP update identifies skills priority areas both immediate and in the medium term, by investigating the
economic and labour market performance of the sector and the extent of skills mismatches within it, thus
allowing the identification of the scarce skills required which are presented in the Sectoral Priority Occupa-
tions and Interventions (SPO) list, which was previously called the PIVOTAL list.

The allocation of funding for interventions required to address the SPO skills list has been decided by the
FASSET Board during its engagements in quarter 2 of 2020. This includes discretionary grants and projects
that will be utilised to address scarce and SPO skills.

FASSET has in its five- year SSP (2020-2025) identified the following four strategic focus priorities for which
relevant projects are to be implemented:

    The need for a long-term and holistic view of the skills pipeline;
    Ensuring that new entrants to the sector reach professional status in the sector;
    Strengthening the capacity of the Technical Vocational Education and Training (TVET) colleges and im-
    proving the absorption of TVET learners in the labour market; and
    Supporting population group transformation of the sector.

The above four priority areas link intrinsically to the FASSET strategic impact statement:
         Facilitating the timeous and relevant upskilling of the FASSET sector

This SSP annual update will be of value to stakeholders such as employers, professional institutes, learners
and education and training institutions in the sector, in that it identifies the latest skills required for the
sector and can guide planning and implementation.

I am confident that FASSET will continue to conduct valuable research relevant to skills development in the
sector, allowing for the implementation of appropriate interventions to meet the scarce skills, and educa-
tion and training demands of the sector as we navigate these new challenges presented to us.

Thanking you,

____________________________
Ms. Lynette Ntuli
FASSET Chairperson

                                                    Page | i
SSP 2021/22 Update
August 2020
ABBREVIATIONS AND ACRONYMS
4IR Fourth Industrial Revolution
AAT (SA) Association of Accounting Technicians
ACCA Association of Chartered Certified Accountants
ACFESA Association of Certified Fraud Examiners South Africa
AGSA Auditor General of South Africa
ATR Annual Training Report
B-BBEE Broad-Based Black Economic Empowerment
CA(SA) Chartered Accountant (South Africa)
CESM Classification of Educational Subject Matter
CFE Certified Fraud Examiner
CIMA Chartered Institute of Management Accountants
CPD Continuous Professional Development
CSS Customer Satisfaction Survey
CSSA Chartered Secretaries Southern Africa
CTA Certificate in the Theory of Accounting
DHET Department of Higher Education and Training
DPSA Department of Public Service and Administration
EEA Employment Equity Act No. 55 of 1998
EMIS Education Management Information System
ETQA Education and Training Quality Assurance Body
FAS Finance and Accounting Services
FASSET Finance and Accounting Services Sector Education and Training Authority
FET Further Education and Training
FETMIS Further Education and Training Management Information System
FSB Financial Services Board
FSCA Financial Services Conduct Authority
GDP Gross Domestic Product
HEI Higher Education Institution
HEMIS Higher Education Management Information System
HET Higher Education and Training
IACSA Institute of Accounting and Commerce
ICB Institute of Certified Bookkeepers
ICBA Institute of Certified Bookkeepers and Accountants
ICM Institute of Credit Management
IDC Industrial Development Corporation
IIASA Institute of Internal Auditors of South Africa
IMFO Institute of Municipal Finance Officers
IRBA Independent Regulatory Board for Auditors
MoU Memorandum of Understanding
NATED National Accredited Technical Education Diploma
NCV National Certificate (Vocational)
NDP National Development Plan
NLRG National Student Financial Aid Scheme Loan Repayment Grant
NQF National Qualifications Framework
NSA National Skills Authority
NSC National Senior Certificate
NSDP National Skills Development Plan
NSF National Skills Fund
NSFAS National Student Financial Aid Scheme
OFO Organising Framework for Occupations
OHF Organisational Huge File
Page | iiSSP 2021/22 Update
August 2020
PAO Professional Accountancy Organizations
PFMA Public Finance Management Act
PIVOTAL Professional Vocational Technical and Academic
PSET Post School Education and Training
QAP Quality Assurance Partner
QCTO Quality Council for Trades and Occupations
RA Registered Auditor
SAIBA Southern African Institute for Business Accountants
SAICA South African Institute of Chartered Accountants
SAIGA Southern African Institute of Government Auditors
SAIPA South African Institute of Professional Accountants
SAIT South African Institute of Tax Professionals
SARB South African Reserve Bank
SARS South African Revenue Service
SDL Skills Development Levy
SETA Sector Education and Training Authority
SIC Standard Industrial Classification
SMMEs Small, Medium and Micro Enterprises
SSP Sector Skills Plan
StatsSA Statistics South Africa
TVET Technical and Vocational Education and Training
VAT Value Added Tax
WIL Work Integrated Learning
WSP Workplace Skills Plan
Page | iiiSSP 2021/22 Update
August 2020
CONTENTS
FOREWORD ....................................................................................................................... i
ABBREVIATIONS AND ACRONYMS .................................................................................... ii
TABLES ............................................................................................................................. v
FIGURES .......................................................................................................................... vi
EXECUTIVE SUMMARY .................................................................................................... vii
RESEARCH PROCESS AND METHODS ................................................................................. x
CHAPTER 1: SECTOR PROFILE ....................................................................................... 1
1.1 Introduction................................................................................................................. 1
1.2 Scope of Coverage ....................................................................................................... 1
1.3 Key Role Players in the Sector ..................................................................................... 2
1.4 Economic Performance of the Sector ......................................................................... 4
1.5 Employer Profile .......................................................................................................... 7
1.6 Labour Market Profile ................................................................................................. 9
1.7 Sub-sector Distribution of Employees......................................................................... 9
1.8 Employee profile ....................................................................................................... 11
1.9 Conclusion ................................................................................................................. 15
CHAPTER 2: KEY SKILLS CHANGE DRIVERS .................................................................. 16
2.1 Introduction............................................................................................................... 16
2.2 Change Drivers in the Sector ..................................................................................... 16
2.3 Implications of change drivers for skills planning ..................................................... 18
2.4 Policy Frameworks affecting skills demand and supply ............................................ 19
2.5 Conclusion ................................................................................................................. 20
CHAPTER 3: OCCUPATIONAL SHORTAGES AND SKILLS GAPS ....................................... 21
3.1 Introduction............................................................................................................... 21
3.2 Sectoral Occupational Demand................................................................................. 21
3.3 Extent and Nature of Supply ..................................................................................... 27
3.4 Sectoral Priority Occupations and Interventions List ................................................ 34
3.5 Conclusion ................................................................................................................. 38
CHAPTER 4: SECTOR PARTNERSHIPS .......................................................................... 39
4.1 Introduction............................................................................................................... 39
4.2 Existing Partnerships ................................................................................................. 39
4.3 PLANNED Partnerships .............................................................................................. 42
4.4 Conclusion ................................................................................................................. 43
CHAPTER 5: MONITORING AND EVALUATION ............................................................ 44
5.1 Introduction............................................................................................................... 44
Page | ivSSP 2021/22 Update
August 2020
5.2 Approach to Monitoring and Evaluation................................................................... 44
5.3 Sector Skills Planning ................................................................................................. 45
5.4 Plan of Action ............................................................................................................ 47
5.5 Conclusion ................................................................................................................. 47
CHAPTER 6: SETA STRATEGIC SKILLS PRIORITY ACTIONS .......................................... 48
6.1 Introduction............................................................................................................... 48
6.2 Findings from previous chapters ............................................................................... 48
6.3 Skills priority Actions ................................................................................................. 51
6.4 Conclusion ................................................................................................................. 52
REFERENCES ................................................................................................................... 53
TABLES
Table 1: Research conducted in preparing FASSET’s 2021/22 Update .................................... xi
Table 2 WSP/ATR submissions by employer size 2020 submissions ....................................... xii
Table 3: SIC and Sub-sector Descriptions .................................................................................. 1
Table 4 Key role players in the FAS sector ................................................................................. 2
Table 5: Sub-sector Distribution of Employers, 2020 ................................................................ 8
Table 6: Sub-sector Distribution of Employees: 2017 – 2019 ................................................. 10
Table 7: Provincial Distribution of Employees: 2017 – 2019 ................................................... 10
Table 8: Employees according to Major OFO Group and population, 2020 ........................... 12
Table 9: Gender of Employees, 2020 ....................................................................................... 13
Table 10: Workers living with disability according to Occupation Group, 2020 ..................... 14
Table 11: Five key change drivers in the sector, 2020 ............................................................. 16
Table 12: Key skills issues and implications of change drivers for skills planning ................... 18
Table 13: Implications of guiding policies on FASSET's skills planning .................................... 19
Table 14: Occupational shortages in the FAS sector, 2020 ..................................................... 22
Table 15: Common critical skills gaps across broad occupational levels ................................. 26
Table 16: Grade 12 statistics: 2015-2019 ................................................................................ 28
Table 17: Enrolment in TVET colleges: 2011 – 2018 ................................................................ 29
Table 18: Learnerships at TVET level ....................................................................................... 29
Table 19: Key challenges in skills formation in FASSET’s sector .............................................. 32
Table 20: Sectoral Priority Occupations and Interventions list, 2020 ..................................... 36
Table 21: Existing Partnerships Matrix .................................................................................... 39
Table 22: Success and Challenges Matrix ................................................................................ 41
Table 23: Planned partnerships ............................................................................................... 42
Table 24: Link between programmes, strategic objectives and strategic goals ...................... 46
Table 25: Skills development priorities (aligned to NSDP objectives) to increase the flow of
new entrants to the labour market ......................................................................... 52
Page | vSSP 2021/22 Update
August 2020
FIGURES
Figure 1: Annual growth rates in industry value added and GDP (constant 2010 prices,
seasonally adjusted and annualised): 2013-2019 ..................................................... 4
Figure 2: Economic performance by growth rate of the different sectors Q4, 2019 ................ 5
Figure 3: SA GDP growth rate (year-on-year) ............................................................................ 5
Figure 4: Provincial Distribution of FASSET Employers, 2020 .................................................... 8
Figure 5: Estimates of Total Employment* in the FASSET Sector: 2010 – 2019........................ 9
Figure 6: Age of employees in the sector, 2020 ...................................................................... 13
Figure 7: Percentage of qualifications by NQF level of FAS workforce (reported by medium
and large organisations and government departments), 2020 .............................. 14
Figure 8: Dominant occupations in the sector in (reported by medium and large organisations
and government departments), 2020 ..................................................................... 15
Page | viSSP 2021/22 Update
August 2020
EXECUTIVE SUMMARY
The SSP is a coherent framework for sector analysis and interpretation to enable credible skills
planning for the financial and accounting services sector. In working towards the 2021/22
update, the SSP report was guided by the Department of Higher Education and Training’s SSP
guidelines and requirements framework. The Finance and Accounting Services Sector Educa-
tion and Training Authority (FASSET) has been promulgated as a Sector Education and Training
Authority (SETA) for the Finance and Accounting (FAS) sector and is made up of 17 Standard
Industrial Classification (SIC) codes. Most of these categories fall within the main group “Fi-
nance, Real Estate and Business Services”. In the 2019/20 financial year, out of 32 951 iden-
tified employers in the sector, an average of 8 426 (26%) organisations paid the Skills Devel-
opment Levy (SDL) to FASSET. Most organisations in the sector are SMME entities, which are
not required to pay the SDL.
In 2019, the Finance, Real Estate, and Business services sector achieved a growth rate of 2.3%
(compared to 1.8% achieved in 2018) and contributed 0.6 of a percentage point to the Gross
Domestic Product (GDP) (0.4% in 2018). The sub-sectors recorded to have performed well
include financial intermediation, auxiliary activities, real estate activities and business ser-
vices. Most organisations in the Finance and Accounting Services (FAS) sector are small sized
companies employing fewer than 50 people. The largest percentage (35%) of organisations
belong to the sub-sector Accounting, Bookkeeping, Auditing and Tax Services.
While global growth was forecasted to increase to 3.3% from 2.9% in 2019, the global out-
break of the Coronavirus (COVID-19) has severely impacted this outlook. Global growth pro-
spects are now turning downward, and another financial recession is expected. The global
outbreak of the Coronavirus (COVID-19) pandemic has overshadowed a lot of the economic
activity in South Africa since March 2020. The economic impact of the pandemic is trouble-
some for the South African economy as it was already in a weak state before the outbreak.
At the end of the 2019 calendar year, the South African economy faced serious challenges
due to, among others, power outages through load shedding; structural obstacles; increased
demand on public expenditure; and failing state-owned enterprises (SOEs). Only three sec-
tors, Mining (1.8%), Personal Services (0.7%), and the Finance, Real Estate, and Business Ser-
vices (2.7%), showed positive growth in Q4 of 2019. In 2020, the current global health pan-
demic will further amplify unfavourable domestic growth, trade, business confidence and in-
vestment. Rating agencies predict the economy will contract by 4.5% in 2020, and per capita
GDP will shrink for the sixth consecutive year, according to the South African Reserve Bank.
Lack of economic growth impacts on sectoral performance, growth and opportunities for em-
ployment. The additional health crisis will show its true impact in the financial quarters to
follow. Economists are expecting major contractions with continuing negative growth rates
for most of the year. The high levels of unemployment are already increasing further.
The financial services sector, although not as directly impacted as manufacturing, education,
tourism, hospitality and consumer services industries, will be affected by long-term knock-on
effects due to economic downturn, government decision-making and loss of consumerism.
According to initial reports on the pandemic’s influence on the economy, in terms of income
components of GDP at factor cost, financial and insurance services are experiencing a mild
economic decline; real estate, legal and accounting services are experiencing a moderate de-
cline; while ‘other business services’ are experiencing a large decline (Arndt et al., 2020).
Page | viiSSP 2021/22 Update
August 2020
Chapter 1 reflects the key statistics with respect to business impact as a result of the pan-
demic and government enforced lockdown measures. Key statistics reveal that there will be
higher unemployment rates in the economy; reduced workforces for many industries; and
many small and medium sized businesses are less likely to survive, which means an overall
reduced pool of businesses in the sector. Chapters 1-3 addresses concerns around recent de-
velopments.
According to estimates based on the Workplace Skills Plan and Annual Training Report
(WSP/ATR) data submitted by employers in the sector, and as shown in Chapter 1, the current
FAS workforce consists of approximately 165 053 employees. The Accounting, Bookkeeping,
Auditing and Tax services sub-sector recorded the largest proportion of workers in the sector
with 37%, followed by the Business and Management consulting services sub-sector with a
share of 21% of employees. Demographically, the FAS workforce comprises 42% Black African,
12% Coloured, 9% Indian, and 35% White. The sector comprises a majority of 56% women.
About 57% of workers are in the youth category (35 and younger).
Chapter 2 demonstrates that developments in information and communication technology
have had and continue to have a profound impact on the work of professionals in the FAS
sector and drives the need for information technology specialists in the sector. The advent of
the Fourth Industrial Revolution (4IR) and the changes in the way of work brought on by the
pandemic means that the new skills sets, productivity measures and infrastructure will be-
come the norm in 2020 and beyond. This is true for the finance and accounting services (FAS)
sector and all other industries in South Africa, as well as globally.
FASSET’s skills planning continues to be influenced largely by national policies and strategies.
Key among them, is the National Development Plan (NDP); the White Paper for Post-School
Education and Training (WP-PSET); the National Skills Development Plan (NSDP); the Strategic
Integrated Projects (SIPs); and the Employment Equity Act and Broad-Based Black Economic
Empowerment (B-BBEE) legislation.
Moreover, the FAS sector is a highly regulated sector and changes in legislation and in the
regulatory environment affect the skills needs in the sector. This is amplified by changes as a
result of the pandemic, its economic implications, the advent of the 4IR and globalisation. In
some instances, regulations will have to be relaxed to accommodate a changing working en-
vironment and education, learning and training system. In other instances, regulations and
governance will become stricter as cyber security issues arise and risks increase in business
operations and client interactions, which at the time of writing, is predominantly virtual and
online.
The following skills issues will continue to be key to FASSET, however, the achievement of
these skills issues will be affected due to the impact of COVID-19 on the economy and the
skills planning landscape:
The need to retain a long-term and holistic view of the skills pipeline and to address
the key challenges that occur in the pipeline;
Ensuring that, where necessary, new entrants reach professional status;
Strengthening the capacity of the Technical Vocational Education and Training (TVET)
colleges and improving the absorption of TVET learners in the labour market; and
Supporting the transformation of the sector.
Page | viiiSSP 2021/22 Update
August 2020
These skills issues, as highlighted in the FASSET’s 2020 APP, provide the framework in which
FASSET’s performance is measured, and underscores which performance indicators are mon-
itored and evaluated. The research and analysis in the 2021/22 SSP Update indicate that the
demand of skills in the sector will drastically change in the short- to medium-term, particularly
in terms of technology and 4IR facing occupations and skills. The supply of the required skills
and occupations following the pandemic will likely be in shortfall, which will result in pressure
on the labour force to upskill, re-skill and acquire entirely new skills sets to be employable.
The skills development environment will need to adapt to the demands and changes that are
imminent. Chapters 2, 3 and 6 explores these emerging demands and changes in-depth.
There are challenges that are persistent in the sector in terms of occupational shortages; mis-
matches in skills supply and demand; and related issues such as scarce skills and gaps. A key
aspect is the skills fed into the sector at various points of education and training. This includes
the number of learners who obtain the National Senior Certificate (NSC) with Maths and Ac-
counting as subjects. Output from the TVET colleges is still relatively small and pass rates con-
tinue to be low. In recent years there has been a recorded increase in the number of gradu-
ates with National Qualifications Framework (NQF) Level 8 qualifications in Accounting – es-
pecially female graduates. Chapter 3 provides a summary of the challenges experienced at
key points in the education and training pipeline.
FASSET attempts to address the full spectrum of the skills development pipeline to varying
extents. Emphasis is placed on overcoming the challenges at every point in the skills formation
pipeline. The three broad areas covered by the skills development priorities are:
Increasing the flow of new finance and accounting entrants into employment;
Developing and growing the skills required in the sector; and
Facilitating transformation of the Finance and Accounting Services Sector.
Specific priorities and targets were set by FASSET for each of these broad priority areas, as
described in the Strategic Plan, and outlined in Chapter 5 of this report.
Chapter 4 addresses FASSET’s long-standing partnerships with professional bodies and higher
education institutions. These partnerships have become a crucial component of the SETA’s
interventions in the skills pipeline. Individual projects are monitored throughout and FASSET
adapts its criteria for funding from time to time in order to give preference to the most suc-
cessful intervention types. Placement in further education programmes and in employment
remains a very important criterion for all these projects.
Professional bodies also perform certain functions in terms of the promotion, administration
and quality assurance of their own qualifications and learnerships. This arrangement has en-
abled FASSET to remain an effective organisation.
Ms. Ayanda Mafuleka
CEO
Signature: _______________________
Date: 28 August 2020
Page | ixSSP 2021/22 Update
August 2020
RESEARCH PROCESS AND METHODS
The SSP is a coherent framework for sector analysis and interpretation to enable credible skills
planning for the financial and accounting services sector. In working towards the 2021/22
update, the SSP report was guided by the Department of Higher Education and Training’s SSP
guidelines and requirements framework. The intention is that the SSP is informed by evi-
dence-based research, consultation with stakeholders, systematic analysis of sub-sector
needs, and strategic engagement at the level of the Board.
The research that informs the FASSET SSP comprises quantitative and qualitative methodolo-
gies, consisting of document reviews, data analysis and stakeholder consultations. This sec-
tion outlines how the research methods were applied to each chapter, including details
around research tools, sampling, data sources and data analysis techniques.
The SSP Research Process
FASSET’s SSP is aimed at providing a comprehensive and up-to-date picture of the skills situ-
ation in the Finance and Accounting Services Sector. The topics included in the research are
prescribed in the SSP Guidelines issued by the DHET and include: a profile of the sector; key
skills issues faced by the sector and the SETA; occupational shortages and skills gaps and part-
nerships of the SET; and the monitoring and evaluation adopted by the SETA. The research
culminates in the skills development priorities set by FASSET.
Qualitative and quantitative data used in the SSP development was sought systematically –
mainly through the interrogation of research reports and through internet searches. Statisti-
cal information on the profile of the sector and on occupational shortages was obtained from
the WSP/ATRs submitted to FASSET in May 2020. Some of the key secondary data sources
interrogated for the purposes of this SSP update include:
1. Government’s strategic plans and legislation;
2. Statistics South Africa;
3. FASSET sector Workplace Skills Plans and Annual Training Reports (WSP/ATR) data;
4. FASSET Organisation Huge File (OHF) data;
5. Higher Education Management Information System (HEMIS) data;
6. Higher Education and Training Information System (HETIS) data;
7. FASSET survey, sector trends, transformation, and other publications;
8. Sector-related literature; and
9. COVID-19 literature.
FASSET also hosted stakeholder and internal staff workshops through virtual focus group ses-
sions. These sessions solicited further inputs from industry and professional bodies and veri-
fied existing information collected through desktop research.
Timeframe
The SSP research for the 2021/22 update was interrupted by the government-legislated lock-
down measures as a result of the COVID-19 pandemic. The first draft submission date was
postponed to mid-July.
Page | xSSP 2021/22 Update
August 2020
Table 1: Research conducted in preparing FASSET’s 1/22 Update
Nature of Data collection List of data sources and Time
Chapter Objectives of study Sample size and scope
the study tool datasets frame
Chapter 1: Quantitative - To provide an overview Desktop research Total number of employers that - Secondary literature March-
Sector Profile Qualitative of the financial and ac- and analysis submitted WSP/ATRs: 1 305 - Statistics SA data June
counting services (FAS) - WSP/ATR submission 2020
sector data
Chapter 2: Qualitative - To determine and vali- Desktop research A total of 7 sessions were held. A to- - Sub-sector representa- April-
Key Skills date key skills change and analysis tal of 35 sub-sector representatives tives June
Change drivers in the sector Virtual interviews participated, and an additional 7 - Skills development pro- 2020
Drivers - To determine the impli- and focus groups skills development providers partici- viders (one group of rep-
cations of identified pated in the sessions resentatives)
change drivers for skills
planning in the sector
Chapter 3: Quantitative - To identify and analyse Desktop research Total number of employers that - Secondary literature April-
Occupational Qualitative the hard-to-fill vacan- and analysis submitted WSP/ATRs: 1 305; - WSP/ATR submission June
Shortages cies and scarce skills in Virtual interviews A total of 35 sub-sector representa- data 2020
and Skills the sector and focus groups tives and 7 skills development pro- - Sub-sector representa-
Gaps - To determine the na- viders tives and skills develop-
ture of supply and de- ment providers
mand in the sector - HEMIS and HETIS data
- To determine sectoral - Secondary literature
priority occupations and
interventions (SPOI)
Chapter 4: Qualitative - To identify and analyse Desktop research A total of 8 sessions were held. A to- - Secondary literature May-
Sector Part- FASSET partnerships and analysis tal of 35 sub-sector representatives - FASSET representatives June
nerships - To assess effectiveness Virtual interviews participated, and an additional 7 2020
FASSET partnerships, and focus groups skills development providers partici-
identify challenges and pated in the sessions. A total of 4
areas of strengths FASSET representatives participated
in the session.
Page | xiSSP 2021/22 Update
August 2020
Nature of Data collection List of data sources and Time
Chapter Objectives of study Sample size and scope
the study tool datasets frame
Chapter 5: Qualitative - To determine FASSET’s Desktop research A total of 4 SETA staff employers par- - FASSET staff representa- May-
Monitoring M&E approach and analysis ticipated in an interview/focus group tives June
and Evalua- - To assess FASSET skills Virtual interviews session - Previous M&E reports 2020
tion development pro- and focus groups - FASSET Annual Reports
grammes/priorities for - Other FASSET supporting
the period under review documents
Table 2 WSP/ATR submissions by employer size 2020 submissions
Enterprises 2020 Submissions
Large Employers (150+ employees) 105
Medium Employers (50 – 149 employees) 157
Small Employers (1 – 49 employees) 1 043
Total 1 305
Source: FASSET data system
Page | xiiSSP 2021/22 Update
August 2020
CHAPTER 1: SECTOR PROFILE
1.1 INTRODUCTION
This chapter presents a broad overview of the Financial and Accounting Services (FAS) Sector.
The chapter elaborates on the scope of coverage of the sector, key role players, economic
performance and the profile of employers and employees. The labour market profile pre-
sented in this section provides insight on trends in employment in the FAS sector, employees’
age, race and gender distribution and information on employees living with disabilities. The
labour market profile also details the sub-sectors in which people work within the sector and
how employment has changed over the past few years. The analysis in this chapter is in-
formed by data extracted from various sources including Statistics South Africa, South African
Revenue Services (SARS), FASSET data systems, and primary data gathered through stake-
holder engagement.
1.2 SCOPE OF COVERAGE
The FAS sector in the context of the South African (SA) skills development landscape is defined
by the demarcation of Standard Industrial Classification (SIC) codes to different Sector Educa-
tion and Training Authorities (SETAs) by the Minister of Higher Education and Training
(MHET). The Establishment of Sector Education and Training Authorities (SETAs) government
notice R1055 in government gazette 33756 of 11 November 2010 allocated 17 SIC codes to
the FAS sector. Except for organs of state falling under the sector, the rest of the SIC codes
allocated to the sector fall within the broader ‘Finance, Real Estate and Business Services’
sector, as defined by Statistics South Africa. In order to facilitate engagement and service de-
livery, organisations belonging to the sector have been clustered into seven sub-sectors. The
SIC codes and the sub-sectors to which each belongs are indicated in Table 3.
Table 3: SIC and Sub-sector Descriptions
SIC Code SIC Description Sub-sector
81904 Investment Entities & Trusts Investment Entities & Trusts &
88103 Company Secretary Services Company Secretary Services
83110 Administration of Financial Markets
83120 Security-dealing Activities
Stockbroking & Financial Markets
83121 Stockbroking
88102 Asset Portfolio Management
83180 Development Corporations & Organisations Development Organisations
88101 Tax Services
88120 Accounting, Bookkeeping & Auditing Activities
88121 Tax Consultancy Activities of Accountants & Auditors
registered in terms of the Public Accountants & Accounting, Bookkeeping, Auditing &
Auditors Act Tax Services
88122 Activities of Cost & Management Accountants
88123 Bookkeeping Activities, including Relevant Data
Processing & Tabulating Activities
Page 1SSP 2021/22 Update
August 2020
SIC Code SIC Description Sub-sector
83190 Activities Auxiliary to Financial Intermediation Activities Auxiliary to Financial
Intermediation
88140 Business & Management Consulting Services Business & Management Consulting
Services
91108 South African Revenue Service (SARS)
9110E National Treasury SARS & Government Departments
Provincial Treasuries
The sub-sector descriptions are generally self-explanatory. However, it should be noted that
the development organisations belonging to the sector include only those that provide finan-
cial assistance and (in some instances) business advice, such as the Industrial Development
Corporation (IDC) and other development finance institutions which do not fall under the
banking sector. Similarly, business and management consulting services encompass a wide
range of activities and may also fall under other SETAs. Only those organisations that choose
to describe their main functions in terms of SIC code 88140 or 88142 are included in this sub-
sector. Some of the accounting and auditing firms also provide business and management
consulting services but, because accounting and auditing is their main business, they are clas-
sified in the sub-sector ‘Accounting, Bookkeeping, Auditing and Tax Services’.
The sub-sector ‘Activities Auxiliary to Financial Intermediation’ includes statutory bodies such
as the Financial Sector Conduct Authority (FSCA) - formerly known as Financial Services Board
(FSB) - and the Independent Regulatory Board for Auditors (IRBA), professional associations,
as well as services not included in any of the other sub-sectors. Debt collection is an example
of such a service.
1.3 KEY ROLE PLAYERS IN THE SECTOR
The Table below lists the various types of key role players in the financial and accounting
services (FAS) sector as well as a description of their respective roles.
Table 4 Key role players in the FAS sector
KEY ROLE PLAYERS ROLES
PROFESSIONAL BODIES
Some of the key professional bodies in the sector: The professional bodies set standards for professions
Association of Accounting Technicians (AAT) and occupations, set and maintain ethical codes and
Association of Chartered Certified Accountants standards for professional conduct, investigate and
(ACCA) deal with complaints of unprofessional conduct
Chartered Institute of Management Accountants against their members, hold disciplinary enquiries
(CIMA) and impose sanctions against practitioners who con-
Chartered Secretaries Southern Africa (CSSA) travene the codes of professional conduct. They are
Institute of Certified Bookkeepers (ICB) also consulted on the quality assurance of most qual-
Institute of Internal Auditors of South Africa ifications that are required in the sector.
(IIASA) Professional bodies work in support of the first four
South African Institute of Professional Account- outcomes of the National Skills Development Plan
ants (SAIPA) (NSDP). They play a crucial role in the development
of learnerships for the FAS sector and for the broader
Page 2SSP 2021/22 Update
August 2020
KEY ROLE PLAYERS ROLES
South African Institute of Chartered Accountants economy. Professional Bodies also act as the Assur-
(SAICA) ance Quality Partner (AQP) for most qualifications
that are re-quired in the sector.
POST SCHOOL EDUCATION AND TRAINING (PSET) INSTITUTIONS
26 public universities As individuals seek to obtain relevant qualifications
50 public TVET colleges and their numerous cam- in this field, institutions of higher learning are key
puses players on the skills supply side. TVET colleges pro-
Private higher education institutions (HEIs) vide National Accredited Technical Education Di-
Private TVET colleges ploma (NATED) programmes (N1-6), which include
Plethora of FASSET or QCTO accredited private bookkeeping and other business administration
training providers, much of which are in-house skills; while universities offer commerce diplomas
accredited training functions and degrees.
Employers and professional bodies frequently play
their part in providing workplace exposure and work
integrated learning opportunities.
INDUSTRY BODIES AND ASSOCIATIONS
Investment Analysts Society of South Africa Employer bodies in the sector play a very important
Association of Black Securities and Investment role in advancing sector interests, including skills de-
Professionals velopment, ethical behaviour, services quality im-
Association for the Advancement of Black Ac- provement, etc. Industry bodies and associations
countants in SA have a role to play in achieving all the outcomes of
Black Brokers Council of South Africa the NSDP.
Southern African Accounting Association
African Women Chartered Accountants
CFO South Africa
REGULATORS
South African Revenue Service (SARS) is the reg- Regulators monitor, review and oversee how busi-
ulator of tax practitioners ness is conducted within the sector. They set stand-
The Independent Regulatory Board for Auditors ards, ensure transparency and promote good corpo-
(IRBA) is the regulatory body for auditors rate governance. Regulators work closely with volun-
The Financial Sector Conduct Authority (FSCA) is tary professional bodies and they play an important
responsible for the regulation of financial service role in the setting of educational standards, stand-
providers ards of professional conduct and CPD requirements.
These are in line with outcomes 3 and 4 of the NSDP.
TRADE UNIONS
National Education Health and Allied Workers Trade unions play an important role in bargaining
Union (NEHAWU), and councils, training committees, and on SETA struc-
Public Servant Association (PSA) are dominant in tures. They also have a role to play in attainment of
the FAS Sector, especially amongst public serv- all outcomes of the NSDP.
ants
Other unions such as Solidarity and the South Af-
rican Society of Bank Officials (SASBO) and Asso-
ciation of Mineworkers and Construction Union
(AMCU) also have some membership in the sec-
tor
Page 3SSP 2021/22 Update
August 2020
1.4 ECONOMIC PERFORMANCE OF THE SECTOR
The Finance, Real Estate, and Business services sector as the broader sector (in which the FAS
sector fits) has remained the strongest sector in the South African economy over the past few
years. The sector outperformed all other sectors, including agriculture, and is a major driver
of growth, achieving a growth rate of 2.3% in 2019 (See Figure 1 below).
Figure 1: Annual growth rates in industry value added and GDP (constant 2010 prices, sea-
sonally adjusted and annualised): 2013-2019
Finance, Real Estate & Business Services
2,6
2,7 National GDP at Market Prices
2,5
2,3
Percentage change
2,1 2,1
1,9
1,8 1,8
1,4
1,2
0,8
0,4
0,2
2013 2014 2015 2016 2017 2018 2019
Source: Statistics South Africa (StatsSA), PO4414.
The Finance, Real Estate, and Business Services sector contributed 0.6 (0.4% in 2018) of a
percentage point to the Gross Domestic Product (GDP) of South Africa (SA) in 2019, based on
Q4 growth rate of 2.7%. In terms of nominal GDP growth, the Finance, Real Estate, and Busi-
ness Services sector contributed a value of 20% to the GDP growth of SA in Q4 of 2019.
The Finance, Real Estate, and Business Services recorded a growth rate of 1.1% in the first
quarter (Q1) of 2019 but recovered to 4.1% in the second quarter (Q2). The sector contracted
again in quarter three (Q3) to a growth rate of 1.6% but ended the year with a sound 2.7% of
growth in the fourth quarter (Q4). The sub-sectors recorded to perform well include financial
intermediation, auxiliary activities, real estate activities and business services.
The sector’s performance at the end of the year was the strongest out of all the sectors, as is
shown in the Figure below.
Page 4SSP 2021/22 Update
August 2020
Figure 2: Economic performance by growth rate of the different sectors Q4, 2019
FINANCE 2,7
MINING 1,8
PERSONAL SERVICES 0,7
GOVERNMENT -0,4
MANUFACTURING -1,8
TRADE -3,8
ELECTRICITY, GAS AND WATER -4,0
CONSTRUCTION -5,9
TRANSPORT AND COMMUNICATION -7,2
AGRICULTURE -7,6
-10,0 -8,0 -6,0 -4,0 -2,0 0,0 2,0 4,0
% Growth rate
Source: StatsSA, PO4414, Fourth Quarter 2019 (seasonally adjusted and annualised).
While global growth was forecasted to increase to 3.3% from 2.9% in 2019, the global out-
break of the Coronavirus (COVID-19) has severely impacted this outlook. Global growth pro-
spects are now turning downward, and another financial recession is expected. This is trou-
blesome for the South African economy. Only three sectors, Mining (1.8%), Personal Services
(0.7%), and the Finance, Real Estate, and Business Services sector (2.7%), showed growth in
Q4 of 2019.
Despite its strong performance against other sectors of the economy in Q4 of 2019, the sec-
tor’s performance was weaker than its own performance in Q2.
Overall, the sector had the same growth rate of 2.7% in Q4 of 2019 as it did in 2018. The
current South African economy is in a technical recession, with two successive quarters of
negative growth recorded in 2019. South Africa’s actual GDP for Q4 of 2019 decreased by
1.4% and 7 of the 10 sectors contracted in Q4. The positive performance of the Finance, Real
Estate, and Business Services sector therefore indicates that the sector can sustain relative
growth, even in a weak economy.
Figure 3: SA GDP growth rate (year-on-year)
5,6% 5,4%
3,2% 3,3%
3,0%
2,5%
2,2%
1,8%
1,2% 1,4%
0,4% 0,8% 0,2%
2006 2007 2008 2009 2010 2011 2012 2013 2014 2015 2016 2017 2018 2019
-1,5%
Source: StatsSA, PO4414, Fourth Quarter 2019.
Page 5SSP 2021/22 Update
August 2020
The Figure above shows that the economy recorded the lowest GDP growth in 2019 since
2009, which was during the global financial crisis. GDP growth recovered strongly following
2009 but started to decline steadily from 2014. Since 2014 the economy has failed to recover
economically, falling below 1% of growth in two successive years.
In 2020, the economy continues to face a bleak future, due to, amongst others, power out-
ages as a result of load shedding; structural obstacles; increased demand on public expendi-
ture; and failing state-owned enterprises (SOEs). In addition, the current global health pan-
demic will not be favourable for domestic growth, trade, or business confidence and invest-
ment. Lack of economic growth impacts sectoral performance, growth and opportunities for
employment. The addition of the health crisis, which hit the country in March (end of Q1),
will show its true impact in the financial quarters to follow. Economists are expecting major
contractions with continuing negative growth rates for most of the year. The already high
level of unemployment is expected to grow.
The financial services sector is highly regulated and is affected by changes in legislation and
in the regulatory environment. The Coronavirus, which has tested global interdependence,
global governance, and the response of national governments, is likely to reveal existing vul-
nerabilities in the current economic order, and so does the Fourth Industrial Revolution (4IR),
which will be accelerated by COVID-19. It will also put to test the FAS sector’s compliance with
regulations and the adoption of changing regulations. Another determining factor following
the pandemic, will be that of business continuity in the sector in the event of modern global
risks and disruptions, particularly where small and medium sized companies are involved.
The financial services sector, although not as directly impacted as manufacturing, education,
tourism, hospitality and consumer services industries, will be affected by long-term knock-on
effects due to economic downturn, government decision-making and loss of consumerism.
According to initial reports on the pandemic’s influence on the economy, in terms of income
components of GDP at factor cost, financial and insurance services are experiencing a mild
economic decline; real estate, legal and accounting services are experiencing a moderate de-
cline; while ‘other business services’ are experiencing a large decline. Manufacturing, accom-
modation services, construction and recreation services experience severe decline (Arndt et
al., 2020).
Despite its continued positive economic growth throughout the years, the sector will have to
demonstrate resilience following the major disruption caused by the COVID-19 pandemic.
Impact of COVID-19 pandemic on the economy
In addition to the overall economic disruption brought on by the pandemic, the South African
government, in compliance with global health regulations, legislated a national lockdown on
27 March 2020. The lockdown followed a phased approached, with the initial phase of Level 5
halting nearly all business and economic activities in the country. Subsequently, plans and
revisions were put in place to ensure the economy was cushioned against a complete col-
lapse. Some of the major changes businesses, with the consideration of the FAS sector, faced
because of lockdown measures include:
The cessation of businesses not providing essential services;
Forced reduction in operations and restrictions on non-essential business operation;
Less consumerism and decreased business confidence;
Page 6SSP 2021/22 Update
August 2020
Rising unemployment;
The provision of, and access to, goods and services;
Changes to workforce capacity, productivity, stability; and
Uncertainty on business investment (Pillay et al., 2020; Arndt et al., 2020).
Due to the listed changes, a March-April Stats SA survey on business impact conducted on
2 182 tax-paying businesses across all economic industries revealed that majority of business
(over (85%) had a below normal turnover in Level 5 lockdown. Nearly 37% of businesses ex-
pected to lay off staff in the short-term, while over 45% expected a reduction in workforce
(Pillay et al., 2020). Most businesses in Real Estate & Other Business Services indicated they
were able to trade only partially, while many have temporarily closed or paused trading (Pillay
et al., 2020).
These statistics reveal that the country can expect higher unemployment rates; reduced
workforces for many industries; and many small and medium sized businesses are less likely
to survive, which means an overall reduced pool of businesses in the sector.
In terms of government relief schemes, organisations were given a four-month (May to Au-
gust 2020) tax relief on the skills development levy (SDL) to alleviate financial stress for busi-
nesses (SA government, 2020; SARS, 2020). On 4 June, the Minister of Higher Education, Sci-
ence and Technology Blade Nzimande stated that the tax relief is a deferral which companies
must apply for and will be required to pay back (Curson, 2020). The consequences of the SDL
payment holiday will be seen in skills planning efforts in the short- to medium term. Stake-
holder engagements revealed that organisations should ideally continue to spend on skills
development despite the levy payment holiday because of the importance of updating skills
during this time. This is further discussed in Section 2.2.
The full-scale impact will only be clearer in hindsight. Currently, perceptions are largely reac-
tionary and based on assumptions and the suddenness of the crisis (Rasool, 2020). The impact
on the pool size of businesses, the workforce and the labour market can only be objectively
determined after the virus is mostly contained and lockdown measures have ceased. Skills
planning for the sector will also likely change drastically in the coming months as new skills
requirements are revealed during the lockdown. Industry inputs obtained through stake-
holder engagements that provide further insights into the possible future of skills in the FAS
sector are discussed in Chapter two.
1.5 EMPLOYER PROFILE
According to the FASSET Organisational Huge File (OHF) generated by SARS, there are just
under 33 000 employers operating within the FASSET scope of coverage. Of these employers,
8 426 (26%) paid skills development levies during the 2019/20 financial year. The next section
provides an overview of the sectoral and provincial distribution of employers in the sector.
1.5.1 SUB-SECTOR DISTRIBUTION
The majority (98%) of employers operating in the sector are small businesses (0-49 employ-
ees). Out of 32 951 employers in the sector, only 310 are medium size companies (50-149
employees), while 191 are large (150+ employees). The largest proportion (34.2%) of employ-
ers are operating within the Accounting, Bookkeeping, Auditing and Tax services sub-sector,
Page 7SSP 2021/22 Update
August 2020
followed by Investment Entities & Trusts & Company Secretary Services (22.9%) and the Busi-
ness and Management Consulting sub-sector (20.8%). The Stockbroking and Financial Mar-
kets sub-sector comprises a 12.3% share of employers; 8.1% Activities Auxiliary to Financial
Intermediation; while Development Organisations and SARS and Government Departments
hold the smallest share with 1.3% (443 employers) and 0.3% (108 employers) respectively.
Table 5: Sub-sector Distribution of Employers, 2020
Large Medium Small (0- Total
Sub-sector
(150+) (50-149) 49)
Accounting, Bookkeeping, Auditing and Tax Services 40 101 11 133 11 274
Activities Auxiliary to Financial Intermediation 22 29 2 608 2 659
Business and Management Consulting Services 38 69 6 753 6 860
Development Organisations 5 3 435 443
Investment Entities and Trusts and Company Secretary 17 36 7 494 7 547
Services
SARS and Government Departments 10 1 97 108
Stockbroking and Financial Markets 59 71 3 930 4 060
Total 191 310 32 450 32 951
*Figures are estimations based on OHF and WSP/ATR submissions of 2020.
Source: FASSET data system 2020.
1.5.2 PROVINCIAL DISTRIBUTION
The largest concentration of employers is found in Gauteng (49%), with 19% located in the
Western Cape and 10% based in KwaZulu-Natal. The North West (2%) and Northern Cape (1%)
provinces host the lowest number of employers in the sector.
Figure 4: Provincial Distribution of FASSET Employers, 2020
Eastern Cape 5%
Western Cape 19%
Freestate 3%
Northern Cape 1%
North West 2%
Mpumalanga 4%
Limpopo 7%
Gauteng 49%
KwaZulu-Natal 10%
*Figures are estimations based on OHF and WSP/ATR submissions of 2020.
Source: FASSET data system 2020.
The Gauteng province is mostly dominated by employers operating within the Accounting,
Bookkeeping, Auditing and Tax services (33%); Business and Management Consulting Services
(24%); and Investment Entities and Trusts and Company Secretary services (21%) sub-sectors.
Page 8SSP 2021/22 Update
August 2020
The majority of employers (34%) in the Western Cape are also providing Accounting,
Bookkeeping, Auditing and Tax services, which is also the most dominant sub-sector in the
North West (46%). Most employers in Limpopo are operating within the Investment Entities,
Trusts and Company Secretary services sub-sector (45%). The Business and management con-
sulting services and Investment Entities & Trusts & Company Secretary Services are the most
dominant sub-sectors across the provinces after the Accounting, Bookkeeping, Auditing and
Tax services sub-sector.
1.6 LABOUR MARKET PROFILE
1.6.1 EMPLOYMENT TRENDS
The FAS sector reported a total of 165 053 employees for the 2019/20 financial period. The
increase of employment from 2018 to 2019 is marginal compared to trends in previous years.
The graph below shows the employment trends in the FAS sector over time.
Figure 5: Estimates of Total Employment* in the FASSET Sector: 2010 – 2019
180 000
160 000 163 503 165 053
140 000 140 960 144 772 140 240
135 191 135 060
Number of employees
130 710 129 408
120 000 119 300
100 000
80 000
60 000
40 000
20 000
0
2010 2011 2012 2013 2014 2015 2016 2017 2018 2019
*Weighted holistically for 2019/20 period.
***Figures are estimations based on OHF and WSP/ATR submissions of 2020. Source: FASSET data system 2020.
1.7 SUB-SECTOR DISTRIBUTION OF EMPLOYEES
In the 2019/20 financial period, the Accounting, Bookkeeping, Auditing and Tax services sub-
sector recorded the largest proportion of workers in the sector, contributing 37% to the sec-
tor’s employment. The number of employees in the Accounting, Bookkeeping, Auditing, and
Tax services sub-sector increased just over 9% from 55 523 in 2018 to 61 1000 in 2019 and
accounted for 37% of the total employment in the Finance and Accountancy sector, a 3%
larger contribution than in 2018. Business and Management Consulting Services is the second
largest sub-sector, accounting for approximately 21 of the sector’s workforce in 2019. The
Stockbroking and Financial Markets sub-sector is the third largest sector in terms of employ-
ment in the sector. Although its percentage share stayed the same between 2018 and 2019,
there is a slight increase the number of employees. The SARS and Government departments
sub-sector has a proportion of 9% of employees in the sector. The Development Organisations
sector accounts for the small share of employees in the FAS sector.
The table below shows the sub-sector distribution of employees between 2017 and 2019.
Page 9SSP 2021/22 Update
August 2020
Table 6: Sub-sector Distribution of Employees: 2017 – 2019
SUB-SECTOR 2017 2018 2019
N % N % N %
Investment Entities, Trusts & Com- 13 885 10 11 623 7 9 671 6
pany secretarial services
Stockbroking and Financial markets 18 389 13 24 189 15 24 380 15
Development Organizations 2 735 2 5 216 3 2 919 2
Accounting, Bookkeeping, Auditing 52 252 37 55 523 34 61 100 37
&Tax services
Activities Auxiliary to financial inter- 14 788 11 21 830 13 17 123 10
mediation
Business and Management consult- 21 010 15 27 034 17 34 437 21
ing
SARS & Government departments 16 684 12 17 443 11 15 055 9
Unknown - - - - 369 0
Total 140 240 100 163 503 100 165 053* 100
*Figures are estimations based on OHF and WSP/ATR submissions of 2020.
Source: FASSET data system 2020.
1.7.1 PROVINCIAL DISTRIBUTION OF EMPLOYEES
A significant number of employees in the sector are based in Gauteng. Gauteng consistently
comprised more than 50% of employment in the sector. In 2018 however, the number of
employees based in Gauteng declined moderately from 55% in 2017 reaching 51% in 2018
suggesting that employees are either finding other employment or relocating to other prov-
inces such as the Western Cape. The Western Cape has seen some increase in the number of
employees in the sector over the years. In 2014, only 19% of the employees were based in
the Western Cape compared to 29% in 2018, marking a 10% increase over the years. However,
the province recorded a decline to 22% in 2020. Only 7% of employees are based in the Kwa-
Zulu-Natal province. Relatively small percentages of employees were located in the remaining
six provinces.
Table 7: Provincial Distribution of Employees: 2017 – 2019
2017 2018 2019
Province
N % N % N %
Eastern Cape 5 271 4 6 540 4 6 562 4
Free State 2 825 2 3 270 2 3 274 2
Gauteng 77 588 55 83 386 51 97 744 59
KwaZulu-Natal 11 606 8 11 445 7 13 308 8
Limpopo 4 131 3 4 905 3 3 547 2
Mpumalanga 2 834 2 3 270 2 2 413 1
Northern Cape 2 510 2 1 635 1 1 497 1
North West 1 136 1 1 635 1 964 1
Western Cape 29 804 21 47 415 29 35 724 22
Unallocated 2 535 2 0 0 21 0
Total 140 240 100 163 503 100 165 053 100
*Figures are estimations based on OHF and WSP/ATR submissions of 2020.
Source: FASSET data system 2020.
Page 10You can also read