The power of zoom: Transforming government through location intelligence - A GovLab study - Deloitte
←
→
Page content transcription
If your browser does not render page correctly, please read the page content below
The power of zoom:
                 Transforming government
                 through location intelligence

A GovLab study
About GovLab
    GovLab is a think tank in the Federal practice of Deloitte Consulting LLP that focuses on innovation in the public
    sector. It works closely with senior government executives and thought leaders from across the globe. GovLab
    Fellows conduct research into key issues and emerging ideas shaping the public, private, and non-profit sectors.
    Through exploration and analysis of government’s most pressing challenges, GovLab seeks to develop innovative
    yet practical ways that governments can transform the way they deliver their services and prepare for the
    challenges ahead.

    As used in this document, “Deloitte” means Deloitte Consulting LLP, a subsidiary of Deloitte LLP. Please see
    www.deloitte.com/us/about for a detailed description of the legal structure of Deloitte LLP and its subsidiaries.
    Certain services may not be available to attest clients under the rules and regulations of public accounting.

2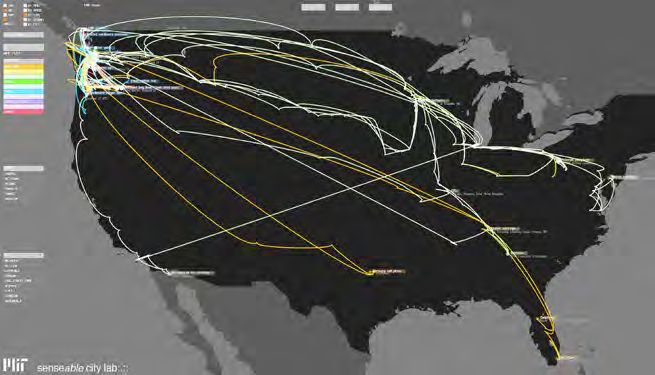
Contents

      Executive summary                                                                                                          3
      Introduction                                                                                                               4
      Seeing the big picture: Better policymaking with geospatial analytics                                                      6
      Finding a common focus: Improving program delivery with place-based collaboration                                         12
      Creating a new frame: New models of delivery using location-based data                                                    20
      Putting zoom into practice                                                                                                26
      Zooming ahead                                                                                                             29

                                                     The power of zoom: Transforming government through location intelligence    1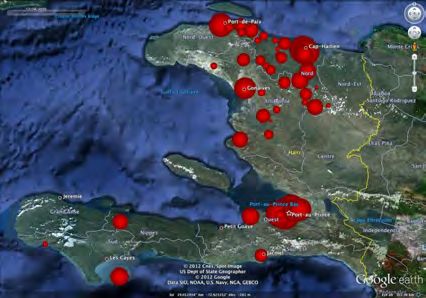
2
Executive summary

      The power of zoom represents an evolution in the way               agencies zoom in on the details that matter, or zoom
      government sees and interacts with the world. When                 out to add context. By harnessing place as a comparison
      location data is coupled with existing government data and         tool, policy makers can sift through the multiple
      expertise, every point on the map can provide historical and       plausible causes of a particular issue, like poor health
      predictive perspective to inform complex policy decisions.         outcomes, and better understand the challenges unique
      The map itself has been transformed from a static picture to       to a specific place.
      a living platform for shared decision making and real-time
      collaboration, focusing the energy of the crowd and             • Finding a common focus. The universal language
      empowering government and citizens to work together to            of location allows diverse stakeholders to share data,
      respond quickly to challenges at any scale.                       imagery, geo-coded SMS messages and traditional
                                                                        geographic information systems — in a way everyone
      Government is the original place-based thinker. The lives of      can understand. Through the common lens of
      citizens have always been tied to their location — where          location, government can become a platform for
      food was grown, how shared resources were managed,                information sharing across agencies, sectors and levels
      and what threats to health and safety had to be monitored         of government to focus policymaking and tap into the
      and addressed. Today, the nation is still divided into            power of the crowd.
      municipalities, cities and states, but it has grown to over
      300 million “mobile” citizens. Governments continue to          • Creating a new frame. In the commercial world,
      rely on traditional geopolitical borders to frame the way         industry leaders are racing to develop new products
      their agencies understand public policy problems and              that tailor information based on a user’s location and
      accordingly, how they deliver services. But borders don’t         context. Government, too, can use location intelligence
      always tell the complete story. How can government                to design new models for delivering services, translating
      agencies understand the challenges, tailor services, and          digital exhaust into value to simplify citizens’ interactions
      measure outcomes at such scale and complexity?                    with government services and improve the customer
                                                                        experience. Similarly, agencies can use data from
      Place is again the answer. With the convergence of                physical assets like vehicles, buildings and devices to
      emerging geospatial technologies and the increasing               increase operating efficiency and better track and
      wealth of location data provided daily by smartphones and         monitor performance.
      sensors embedded in everything from buildings to buses —
      the “digital exhaust” created as a byproduct of millions of     Government can start moving forward with the rapidly
      our daily lives — government can pursue new models for          evolving capabilities of location intelligence by assembling
      delivering public services, better understand the challenges    the geo-data already within agencies, and looking
      of diverse communities across the nation, and design more       beyond program or agency boundaries to the private
      effective solutions. There is an opportunity for citizens to    sector and citizens. Agencies can address issues of citizen
      share and receive information customized not only to who        and employee privacy by framing services around value,
      they are, but where they are — creating a new paradigm          adapting existing privacy frameworks to make sure that
      for how government can understand and serve the public.         protections are adequate, and ensuring the collection and
      This report describes how governments can apply the             use of location data is transparent.
      following principles of zoom to transform the way they
      solve problems:                                                 Place plays a significant role in defining who we are. The
                                                                      power of zoom helps government get back to basics,
      • Seeing the big picture. Geospatial analysis can be            empowering public servants and the community to work
        a powerful tool for policy makers, allowing them to           together to solve the most pressing problems at any scale
        interpret disparate and complex data through simple,          — from issues affecting local communities to those that
        effective visualizations. The context of place creates        transcend national borders.
        an instant connection among layers of data, helping

                                                       The power of zoom: Transforming government through location intelligence      3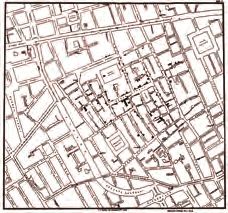
Introduction

                                 We live in an uncertain world, but for many people there’s      What are the implications for government when we can
                                 at least one constant — a hot cup of coffee to start the        use technology to see what was once invisible? When
                                 morning. At the corner diner, in the lobby of an office         sensors are so cheap, we can literally throw them away? For
                                 building or at a drive-thru window, that first cup gives us     the Trash Track participants, it meant that they could gather
                                 the boost we need to take on the day. And after that cup        and use data in a way few would have thought possible,
                                 is empty, we rarely give a second thought to where it’s         bringing attention to an issue many of us rarely think about
                                 headed afterward.                                               and crafting a compelling visual that couldn’t be ignored.

                                 Carlo Ratti, director of the MIT SENSEable City Lab, wanted     “As the location reports from the tracked objects started
                                 to find out. So his team of researchers asked — where           coming in, we were fascinated to see an invisible
                                 does our recycling go? How far does it travel? With several     infrastructure unfolding,” said Dietmar Offenhuber, Trash
                                 volunteers, the team launched the Trash Track project,          Track project leader. “The extent and complexity of the
                                 attaching location sensors to more than 3,000 pieces of         network of waste trajectories was quite unexpected.”4
                                 trash in Seattle. Then, they waited. And waited.
                                                                                                 The increasing wealth of data provided daily by
                                                                                                 smartphones, physical sensors and the Internet — the
                                                                                                 “digital exhaust” created as a byproduct of millions
                                                                                                 of our daily lives — has given rise to new models and
                                                                                                 opportunities for government to better understand its
                                                                                                 challenges and design more effective solutions.

                                                                                                 When location data is coupled with other online resources,
                                                                                                 every point on the map can provide valuable intelligence.
                                                                                                 Emerging geospatial technologies allow us to quickly
                                                                                                 visualize and find meaning in billions of transactions,
                                                                                                 tweets, check-ins and geotagged photos. When combined
                                                                                                 with existing government data and expertise, this
                                                                                                 intelligence can, in turn, help us redefine the way we see
                                                                                                 and understand the world, creating digital pictures of the
                                                                                                 ebb and flow of our societies. A place is no longer simply
MIT Trash Track Visualization2
                                                                                                 a point on a map or a political jurisdiction, but a living,
                                 As the weeks and months passed, an MIT server tracked           evolving hub of information, a convergence of digital
                                 each object’s path across the country. Interestingly, more      and physical worlds. For government, this new ability to
                                 than 75 percent of the objects reached a recycling facility,    visualize and understand trends at any location offers
                                 well above the national average of 34 percent.1 But for         a historical and predictive perspective for policymaking
                                 some, such as a printer cartridge that traveled almost 4,000    to inform complex decisions about the distribution of
                                 miles to its final resting place in Florida, the energy spent   resources or the design and delivery of public services.
                                 in transit probably exceeded the environmental benefit of
                                 recycling. “Trash disposal is one of today’s most pressing
                                 issues,” said Ratti. “Our objective with this project is to
                                 reveal the disposal process of everyday objects, as well as
                                 highlight potential inefficiencies in today’s recycling and
                                 sanitation systems.”3

4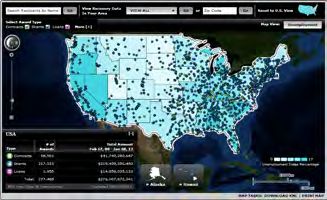
But the new technology of place can provide far more. The         events in our communities and zoom out for broader
                              map itself has been transformed from a static picture to a        context at the national and even global scale. By coupling
                              living platform for shared decision making and real-time          its responsibilities with advances in geospatial, sensor and
                              collaboration, adding a new dimension to the delivery             location-based technologies, government can use the
                              of public services. Location-based data can be used to            power of zoom to overcome a wide variety of challenges.
                              focus the energy of the crowd, empowering government              The report describes how governments can apply the
                              and citizens to work together to respond quickly to local         principles of zoom to transform the way they solve
                              disasters or tackle national problems.                            problems by:
                                                                                                • Seeing the big picture — using geospatial visualization
                                                                                                    and location analytics to inform better policymaking
Geospatial analytics: Statistical analysis of data elements that can be tied to a               • Finding a common focus — employing place-based
location on, above or below the earth’s surface                                                     analysis and geospatial collaboration tools to increase
                                                                                                    the effectiveness of shared assets and improve their
Location-based services: Programs or services (such as mobile apps) that deliver                    coordination
information concerning an individual’s specific location                                        • Creating a new frame — examining public- and
                                                                                                    private-sector approaches to the use of digital exhaust
Digital exhaust: Data generated by electronic devices (such as smartphones and                      to develop location intelligent services, greatly improving
credit card purchases) and physical sensors (such as digital wind and temperature                   the cost-effectiveness of traditional public services
gauges and traffic cameras) that include a location
                                                                                                We will also see how agencies can put zoom into practice
                                                                                                by tapping into ecosystems of innovators inside and outside
                              We call this the power of zoom, and it represents an              of government, considering the challenges of privacy and
                              evolution in the way government sees and interacts with           finding ways to deliver better value in exchange for public
                              the world. The convergence of traditional geospatial              participation.
                              technologies, once the province of computer scientists and
                              geographers, and location-based services, which allow
                              individuals to receive personalized information that is
                              relevant to their location at any given point in time on
                              their mobile devices, can allow us to visualize the choices
                              we make, the relationships we create and the impacts of
                              our actions.

                              As is often the case with new technologies, some find
                              these capabilities off-putting or even sinister. But they don’t
                              have to be. What some would describe impersonally as
                              “big data”, we see as just the opposite. Location-based
                              data can be used to create policy at a human scale,
                              allowing decision makers to “zoom” in to understand

                                                                                 The power of zoom: Transforming government through location intelligence    5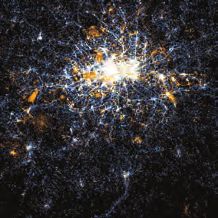
Seeing the big picture:
Better policymaking with
geospatial analytics

“When you start to relate activities and
people and places to each other, you see
patterns — and that’s one of the critical
things, so we can start to anticipate
problems before they arise, and have
more of a set of tools we can offer to
decision makers.”
— Keith Barber, Director of the National System for Geospatial Intelligence Expeditionary Architecture
Integrated Program Office, National Geospatial Intelligence Agency5

                                                                                                         John Snow’s map of Cholera deaths near the Broad Street Pump6

                                    In 1854, an outbreak of cholera swept through London’s
                                    Soho district, killing hundreds. An anesthesiologist
                                    named John Snow suspected contaminated water might
                                    be the cause of the disease, but in the absence of any
                                    understanding of germ theory, prevailing expertise blamed
                                    “bad air.” Looking for evidence, Snow literally mapped the
                                    location of individuals who died, and observed that they
                                    were mostly clustered around the intersection of Broad and
                                    Cambridge Streets, the site of the now-infamous Broad
                                    Street pump.

                                    Further investigation revealed that Broad Street’s water
                                    came from a stretch of the Thames contaminated with                  Google/Doctors Without Borders map of near real-time cholera
                                    sewage, which we now understand to be the principal                  cases in Haiti7

                                    means of cholera transmission. Snow’s arguments led to
                                    the removal of the pump handle — and a precipitous drop              According to Deputy Head of Mission in Haiti Ivan Gayton,
                                    in the rate of cholera infection.8                                   “Maps can be a powerful advocacy tool. You can convince
                                                                                                         policymakers to take action by showing them data in a
                                    Almost 160 years later, the international medical relief             visual, visceral way.”11
                                    organization Doctors Without Borders worked with
                                    Google’s Crisis Response team to address the spread of               Geospatial analysis is far more than dots on a map. It
                                    cholera among survivors of the massive earthquake in                 can be a powerful tool for policymakers, allowing them
                                    Haiti. By mapping the water system along with patients’              to interpret disparate and complex data through simple,
                                    neighborhood of origin, analysts visualized where outbreaks          effective visualizations. The context of place creates an
                                    were happening in near real-time, allowing Doctors                   instant connection among layers of data, prompting users
                                    Without Borders to persuade response coordinators to                 to dig deeper and come up with questions they might have
                                    prioritize repair areas where outbreaks were occurring.9,10          never thought to ask.

6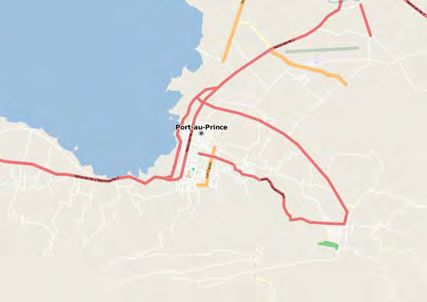
Public policy problems often involve multiple layers of        environmental factors. Such information can help property
                          complexity. What causes banks to fail in one region and not    managers and private owners share resources among
                          in another? Where should we send police officers to stop       buildings or blocks, and enable city leaders to target the
                          a wave of gang violence? Why is a certain group of people      best locations for different types of alternative energy
                          afflicted with a disease, while only a few miles away no one   generation.
                          is sick?

                          Geospatial visualization and analytics move policy               Elements of place-based comparison
                          analysis out of spreadsheets and onto the map, allowing          • Demographics: Age, gender, income
                          government to zoom in and out, seeing multiple factors           • Infrastructure: Transit, land use
                          at a single glance, and better understanding how different       • Geography: Natural resources, threats
                          characteristics relate to one other — and to place.              • Public assets: Government facilities, resources
                                                                                           • Administration: Regulations, tax code
                          1. Harness place as a comparison tool
Four uses for             As with the London cholera outbreak, prevailing wisdom
geospatial analytics:     doesn’t always reveal the root cause of a problem.             Highlight differences to drive innovation. Place-based
1. Harness place as a     Geospatial visualization helps us sift through multiple,       comparisons are particularly useful to showcase the
   comparative tool       plausible causes of some of the toughest public policy         variance in factors such as availability, cost and the quality
2. Drive accountability   problems, seeing surprising and unexpected correlations        of services. Healthcare is ripe for this kind of analysis. Our
3. Move from              among different information.                                   access to affordable health care, treatment outcomes
   prescription to                                                                       and even patterns of disease vary widely by geographic
   prediction             If some characteristics are held constant, such as             location, even across relatively similar regions.
4. Rethink boundaries     demographics, per capita funding and regulatory
                          structures, place can provide a strong base for comparison.    The Dartmouth Atlas Project displays health data across
                          Policymakers can zoom in to see why some programs and          306 U.S. hospital referral regions on factors involving
                          projects thrive in one place and fail elsewhere. Consider      costs and quality, allowing users to question and explore
                          basic environmental issues; we live under the same clean       geographic variations in health statistics.14 For example,
                          air and water laws, yet environmental protection obviously     what drives regional variations in the cost of prescription
                          is not uniformly effective across the nation. Policymakers     drugs purchased through Medicare? Geographic analysis
                          can use geospatial tools to identify and mitigate              indicates that these variations are due primarily to
                          disproportionately adverse environmental impacts on            regional restrictions on the use of generic drugs. By
                          minority and low-income populations.12                         easing restrictions on generic drugs in high-cost areas,
                                                                                         policy makers can reduce overall Medicare costs.15
                          Create immediate context. Maps provide a powerful way
                          to organize massive amounts of data around a common            Find mismatches faster. The misalignment of the
                          attribute or location, and provide a starting point for        supply and demand for government services is perhaps
                          conversation about many tough decisions with citizens          inevitable, given competing priorities, political mandates
                          and other government stakeholders. In New York City,           and population shifts.16 But such misalignment isn’t always
                          the Mayor’s Office and Columbia University partnered to        readily apparent, and what begins as a small problem
                          develop a digital model that shows how practically every       may not be noticed until a major investment is required
                          building in the city consumes energy, distinguishing among     to fix it. A study of local health departments in several
                          heating, lighting and other purposes.13                        states found that low-cost, publicly available geographic
                                                                                         information systems (GIS) data could allow their staff to
                          Seeing the relationship between energy use and                 compare population distributions with the location of
                          community design can help policymakers and the public          health facilities, identifying gaps between programs and
                          alike understand how energy usage relates to social and        community health needs.17

                                                                          The power of zoom: Transforming government through location intelligence        7
The platform not only helped inform the public, but also
                                                                                                   created an expectation of accountability for the ultimate
“Climate change poses an enormous threat                                                           recipients of ARRA funds. Grantees knew their information

to the livelihoods of millions of Africans.                                                        would be published as soon as it was collected, giving
                                                                                                   them an incentive to provide more precise data in a
The level of risk, however, is not evenly                                                          timely fashion.

spread and certainly doesn’t respect                                                               White House Chief Administrator of ARRA Ed DeSeve

national boundaries. To ask critical                                                               noted, “Through this platform we were able to bring
                                                                                                   together data from 200 business units in 40 agencies across
questions about how development                                                                    50 states, and present it in a way that speaks to people
                                                                                                   interested in a specific geographic area. It was also helpful
assistance can reduce vulnerability, you                                                           for a defensive posture — we were able to respond to

need hyperlocal data on climate and                                                                critics, minimize fraud and geo-audit recipients.”

also on aid-funded interventions. This
is what the new CCAPS mapping tool
shows in a digestible, interactive way.”
— Jean-Louis Sarbib, CEO, Development Gateway19

                                 See the big picture to monitor change. Some policy
                                 challenges require us to zoom out and consider regional
                                 or environmental problems. For example, researchers from
                                 the Climate Change and African Political Stability Program
                                 (CCAPS) at the University of Texas at Austin are using
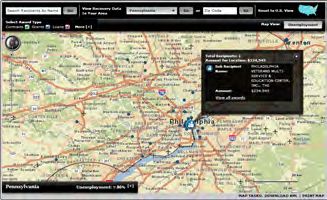
                                 geospatial analysis to identify and possibly mitigate political   Using recovery.gov to identify and compare funding for job training
                                 instability that may result from climate change. By layering      programs by states with the highest unemployment rates21
                                 climate, population, conflict and foreign aid data on a map,
                                 policymakers can better predict the regions most vulnerable       3. Move from prescription to prediction
                                 to climate change, and understand how to target aid               One of the most fascinating aspects of location-based data
                                 more effectively.18                                               is the stability and predictability of patterns that can be
                                                                                                   mined from seemingly unrelated data. A cluster of random
                                 2. Drive accountability                                           dots on a map can represent a daily transportation route,
                                 The open data movement is fostering more accountability           the most popular dating spots or the neighborhoods
                                 in government at all levels, by enabling citizens to              with the highest concentration of gang violence. These
                                 ask informed questions about decision making and                  patterns, analyzed over time and in large numbers, begin
                                 performance. Geospatial platforms are especially useful           to allow for informed predictions of behaviors and events.
                                 in this arena, highlighting “who and where” impacts to            For government, this analytical capability enables better
                                 defend or oppose current policy — or expose waste or              resource allocation and more effective outcomes.22
                                 political favoritism. One example of this is Recovery.gov, an
                                 online public platform that tracks where money from the
                                 2009 American Recovery and Reinvestment Act (ARRA) was
                                 distributed in a simple visual format.20

8
Chicago’s Chief Data Officer Brett Goldstein is attempting Understanding how people move, where they interact
to prevent violent crimes in the city before they happen. and what services they need allows government to rethink
Goldstein’s predictive analytics unit runs spatial algorithms several basic dimensions of its role:
on 911 call data to identify where and when violent crimes • Resource allocation — where to deploy assets,
or robberies are most likely to happen. As Goldstein puts personnel or funding for health, transport and economic
it, “Different parts of the city behave in predictable ways development
— beyond a city of neighborhoods, Chicago is a city of • Communication — how to reach a target demographic
blocks, and these blocks are part of an ecosystem. We can concerning a particular issue such as obesity, or in the
create mathematical models with this ecosystem that are event of an emergency
statistically significant, and give us leading indicators for • Coordination — when to combine resources with other
when an expected level of a given behavior is likely agencies or private or nonprofit entities to aid a specific
to happen.”23 population
Advances in predictive analytics using location-based In the commercial world, particularly for retailers, this
data are emerging across several frontiers. Researchers at sort of analysis is critical. The ideal site for a new store
Carnegie Mellon University are developing a statistical tool relies far more on purchasing power, customer drive times
that combines electronic health records, tweets and other and consumer preferences than political boundaries. It
information with spatial analysis, to translate large amounts also broadens the frame of reference from traditional
of social data into patterns that could identify epidemics demographic characteristics such as gender, age and
or other health trends.24 Similarly, a UK team found that income to consider “tribes” that share common behaviors
by cross-referencing an individual’s location data with that and decision patterns.
of their friends, the team was able to predict where that
person would be 24 hours later, within 20 meters.25 Understand shared characteristics. The practice of
identifying groups with shared characteristics based on
4. Rethink boundaries their location is a technique called micro-segmentation,
Governments must look beyond traditional jurisdiction lines which breaks down 70,000+ U.S. Census tracts into
to address some of today’s most complex policy challenges. several consumer segments. Esri, one company with such
Environmental effects, for instance, pay no attention to data, defines these segments with catchy names such as
political boundaries. Transportation networks cross state “wealthy seaboard suburbs,” “rustbelt retirees,” and “city
lines, and many people may live in one congressional strivers.”26 Such designations help retailers target their core
district yet work in another. Our social networks are even customers and ensure that their target demographic finds
less constrained, with Facebook and YouTube connecting their locations and products. For example, Internet giant
individuals around the world to act upon a single issue. eBay has divided its Australian market into 15 “geoTribes”
to target its online advertising.27
Geospatial analysis not only helps us examine issues within
traditional, geopolitical boundaries, but also those that blur See the social connections. Researchers at Carnegie
the lines, encouraging decision makers to consider social Mellon have added social media to the mix, mining
as well as political characteristics and rethink the role of data from 18 million foursquare check-ins to redraw
boundaries in policymaking. neighborhoods in several cities based on check-in
patterns.28 Branding these areas as “livehoods,” the team
hopes its information can be used to improve city planning,
transportation services and public health surveillance.29
The power of zoom: Transforming government through location intelligence 9Problems addressed with geospatial analytics:
• Make sense of scale and complexity. In the last 30 years, the U.S. population has risen by more than 40
percent to more than 300 million people, straining policies and infrastructure.30 Geospatial analytics can help
government to understand the complex relationships underlying policy issues, and use place as a comparative
tool to gain understanding from disparate data sources.
• Support more open and accountable government. Americans’ trust in government to solve big problems
is at an all-time low, due in part to a lack of evidence as to whether current policies are working.31 By using
geospatial platforms to share government data, agencies can connect with the public in a more transparent
manner.
• Move beyond assumptions and generalizations. Agencies’ missions have been stretched by shifting priorities,
as governments struggle to get in front of key challenges. With place-based thinking, organizations can use the
predictive power of spatial data to overcome emerging challenges.
• Look beyond “borders” to increase collaboration. Today’s complex challenges are not neatly contained
within county or state lines. Geospatial analysis can help government to better visualize mismatches between
the supply of public services and citizen demand, and to rethink borders to create a richer context for designing
policy interventions.32
10Then and now: The impact of location intelligence and
the power of zoom
1854 John snow mapped the London cholera
outbreak to find the water pump at the TODAY Snow’s task could be easier with
the power of zoom. Health experts
source of the contamination, for which he’s become can combine the digital exhaust from mobile devices
known as the “father of epidemiology.” But his work and physical sensors with geospatial technology to
was limited by the technology of the time: respond faster and more effectively:
John Snow’s map of cholera A 2011 map of London made up of geotagged
deaths in London,1854 33 tweets and photos 35
LONDON
Snow’s work Researchers
depended on can visualize
mapping deaths leading indicators
after the fact, and of an outbreak by
Capturing
correlating that insight from tapping
information with
the pump where
geospatial data into the600
5
billion+ geotagged
they got their water. daily transactions,36 million
such as increased medication sales. daily Foursquare
2
Snow walked through the Soho check-ins 37
neighborhood of London to collect Drawing a Geotagged social data
information, interviewing the new map with provides health experts billion
social data
families of those who succumbed with information
directly from users. monthly location-
to the disease.
tagged Facebook actions 38
50
Since Snow predated scientific With environmental
understanding of bacterial diseases, he sensors in the air and
Tapping into
had to convince city officials that the environmental water, health officials could
pump was the source of the data measure contamination
billion
contamination. Prevailing wisdom of public water sources
blamed the city’s “bad air.” in real-time. connections to the web by 2020 39
Working with only a single Health experts can use a mobile
app to customize information
74%
companion, Reverend Henry Harnessing
Whitehead, Snow had to place-based based on location.
collaboration
rely on his own efforts and of U.S. smartphone owners
expertise to solve the outbreak.34 use location-based services 40
The power of zoom: Transforming government through location intelligence 11Finding a common focus:
Improving program delivery
with place-based collaboration
Many are familiar with Ushahidi, the online mapping
platform that crowdsources information, and its role in
“Place-based management promotes the response to the 2010 earthquake in Haiti. What is
decision making that isn’t bound by unique about this case, however, is that it demonstrates
how crowdsourced mapping platforms have permanently
programs, or funding streams, or changed the way in which governments and people can
interact in times of crisis.
departmental structures, but brings all
of those together in the same room to Within days of the earthquake, and with little assistance
from any government, a text message from a survivor could
embrace context and leverage the be geo-located, translated from Haitian Creole, put on
the map via the Ushahidi crisis-mapping team, and routed
resources available across the board.” to first responders in less than 10 minutes.43 Within the
first week the team received more than 20,000 messages
— Raphael Bostic, former Deputy Administrator, U.S. Department of Housing and Urban Development41
that were filtered and mapped along with the locations of
makeshift hospitals, shelters and potable water sources.
Ten days after the earthquake, U.S. Federal Emergency
Management Agency (FEMA) Administrator Craig Fugate
tweeted that Ushahidi’s map was the most comprehensive
and up-to-date information available to the humanitarian
community.44
At the same time, other volunteers used before-and-after
satellite imagery freely provided by commercial vendors to
make hundreds of edits to OpenStreetMap, a free and open
wiki-style mapping platform, literally putting Port-au-Prince
on the map (see inset).45 In a matter of hours, the city was
transformed from a couple of highways to a thicket of
narrow streets and communities, creating the baseline layer
for sharing the Ushahidi information.46 By the time urban
Port-au-Prince on OpenStreetMap before the earthquake42 search and rescue teams arrived from the United States,
one responder from Fairfax County, Virginia commented
that he only wished he had a way to express how valuable
this data is for responders.47
The Haiti response demonstrated the power of place-based
information. The Ushahidi map was developed quickly,
outside the administrative barriers of government, and
took advantage of the skills and passion of volunteers. The
universal language of location allowed diverse stakeholders
to share data, imagery, geo-coded SMS messages and
traditional GIS — in a way everyone could understand.
Perhaps even more significantly, Ushahidi allowed the
survivors to use their mobile devices to fill in the gaps and
define the areas of greatest need across a large geographic
Port-au-Prince on OpenStreetMap after the earthquake42 area, not just a couple of blocks. Geospatial data also made
12crowdsourced information easier to validate; if several voices The federal government has taken steps towards creating
called for help in a specific area and reported the same a shared platform for geospatial data. In the wake of the
details, there probably was a significant need there. In fact, 2010 Deepwater Horizon disaster in the Gulf of Mexico,
Ushahidi data since has become part of the United Nations’ federal, state and local agencies learned how difficult it
official situational reports.48 was to share geospatial data across their servers and maps.
To enable such collaboration, the Federal Geographic Data
The usefulness of these technologies, however, extends Committee (FGDC) is working to create a one-stop portal
well beyond crisis scenarios. The intersection of sensor for mapping efforts offering a Web-based interface that
technology, imagery, data mining and Web-based platforms allows users to share maps and data layers with one other,
creates new opportunities for government to share place- as well as with the public.52
based information among agencies and with the public
and other stakeholders across a wide range of policy Encourage external innovators to build on government
issues.49 At this intersection lies tremendous opportunity geo-data. Private citizens and organizations should
for collaboration where government itself can be used as a be encouraged to add details or build useful apps for
platform and its employees are perpetually location-aware. government geo-platforms. Consider foursquare’s new
Connected Apps framework, which helps third parties add
Four uses for place- 1. Use government as a platform50 information on top of check-in data. For example, if you
based collaboration: Though many government agencies may take longer to check-in at a restaurant, a diet-related app might suggest
1. Use government as adapt to new technologies or opportunities, they are appropriate meals, while a social app could tell you if
a platform uniquely poised to marshal and coordinate significant any of your friends have eaten there, and if they left any
2. Focus the power of amounts of data, resources and expertise. The ubiquity comments.53 The parallel for government is obvious;
the crowd of mobile devices means that maps and contextual data many apps have already been built with government
3. Allocate resources will become a fundamental unit for information sharing.51 data, from health service locators to navigational aids for
with location data To accelerate the delivery of smarter, faster (and possibly national parks.54
4. Use location cheaper) services, government should become a platform
intelligence in for information sharing between internal and external The city of Chicago, for instance, added detail to the U.S.
daily operations stakeholders, with geospatial data as the centerpiece. Department of Agriculture’s Food Desert Locator map,
which shows areas with limited access to healthy foods.
Reduce barriers with a “geo-cloud.” Effective platforms By layering city level data down to the block level, policy
provide data to many audiences and are scalable to makers can pinpoint specific underserved neighborhoods
accommodate new information and technologies. and use the data to negotiate with grocery stores regarding
Geospatial data stored in the cloud can allow government site selection, or strategically locate farmers’ markets in
agencies to better understand what their counterparts areas that need them most.55
are doing for a specific population or target area, and can
help pave the way for better coordination of programs
and services. Cloud-based storage also can incorporate
non-governmental data sets; for example, a health and
human services agency could combine its own historical
health-related data with housing statistics from another
agency, and then layer in geotagged social media data and
news reports to pinpoint where the next round of flu is
most likely to emerge.
The power of zoom: Transforming government through location intelligence 132. Focus the power of the crowd FEMA has begun embedding executives from large retailers
While geospatial analysis may have once been the province like Target and Walmart into its national operations and
of internal experts within government, agencies can focus response center for 90-day periods, to facilitate information
on building and sustaining a community of developers and sharing.58 For example, retailers can share what stores are
contributors outside government’s walls. open or closed during a disaster, or show inventory levels of
certain products such as plywood in advance of a hurricane
Engage the “geo crowd.” One way to build such a to understand how people are preparing, or what needs
community is to launch a competition or challenge that is will be greatest after the event. FEMA hopes eventually to
fun for participants while furthering a larger public policy develop a map of major retailers’ status across the country,
goal. Policymakers may be surprised by how willing citizens and share this information with state and local response
are to lend their time to mapping projects, if the process teams during disasters.
is enjoyable.
Empower the most vulnerable. The crowd can make
For example, the U.S. Agency for International huge impacts with geospatial analysis, without expensive
Development (USAID) recently turned to the crowd to technology. Tandale is a slum of between 50,000 and
geocode international loan guarantee information. A group 70,000 people crammed into less than one square mile
of volunteers from the online mapping community rose on the periphery of Dar es Salaam, Tanzania. Until very
to the challenge, resulting in the release of data on more recently, it literally wasn’t even on the map. Over the
than 117,000 loan records at no additional cost to the course of two months, a team from the World Bank trained
agency.56 Motivated by passion for USAID’s mission and community members to use inexpensive, global positioning
a desire to make the data available for public use, these system (GPS)-enabled phones to photograph and geotag
individuals turned their private time into public value. NASA places of interest for the community (such as public toilets,
also recently experimented with crowdsourcing, using water sources, medical bases and the elementary school)
“gamification” to reward participants with points or badges and upload the data to OpenStreetMap.59
for identifying scientifically relevant content on maps of
the sea floor, a process that might be used in the future Equipped with this infrastructure data, residents of Tandale
to quickly map features of asteroids or planets, including are currently in conversations with their local government
our own.57 to garner additional public services. In addition, the
community set up a Ushahidi-based site, Ramani Tandale,
Such challenges reveal the power of place to engage the which allows residents to report flooding, broken street
public. Connection to the agency’s mission, a particular lamps and other issues.60
geographic area or a specific population can turn activities
that are fun and fulfilling for citizens into meaningful
contributions for government.
Use commercial partners. The private sector can play a
valuable role as a data provider, and as a partner in solving
public sector challenges. The employee and store location
networks of the nation’s largest corporations represent a
wealth of potential sensor data, as does the sophisticated
asset intelligence that informs modern supply-chain
operations and logistics.
143. Allocate resources with location data
A more traditional role for geospatial analysis in
government has been in deciding where to locate fixed
resources such as transportation systems, hospitals or public
spaces like parks and playgrounds. Much of our current
infrastructure, however, is located based on decisions made
decades ago. Today, we can take advantage of geospatial
analysis to make smarter decisions about where and how
to invest scarce resources in ways that are sustainable and
supported by the public.
Use complex technologies to enable simple analyses.
New geospatial tools allow for more sophisticated analyses,
using multiple layers of data to compare potential scenarios
and make decisions that consider the impact to diverse
stakeholders and constituencies.
One example is Azavea, a geospatial software firm that
develops collaborative, open-source applications to help
decision makers and the public visualize and understand
the impact of public policy decisions.61 From collaborative
political redistricting to targeting the optimal location for
new urban street trees, these types of emerging geospatial
solutions can quickly crunch thousands of variables in a way
that many stakeholders can understand. Citizens and policy
makers are empowered to “drag and drop” each new idea
to assess the impact, making resource allocation decisions
more collaborative and data-driven than ever before.
The power of zoom: Transforming government through location intelligence 154. Use location intelligence in daily operations
The usefulness of location intelligence isn’t limited to
strategic decision making. Place-based information can be “[S]ensors, smartphones, tablets and
incorporated into daily government operations to improve
the delivery of programs and services. Take the case of a collaboration platforms will be as
safety inspector:
• Contextual data — Via her smartphone or tablet,
transformative of business in the 2010s as
the inspector is prepared for her daily site visits with the Internet and the Web browser were in
directions, overview information and related community
statistics. For each site, she has profiles of the individuals the 1990s. To cite two far-reaching
she will meet, verified by whether they have checked
into work that morning.
examples, electronic medical records are
• Location-based notation — Upon arrival, push changing the way hospitals conduct
notifications provide notes from previous inspections
about particular problem areas at each site, including healthcare, while smart meters are
pictures and resulting action items assigned to the
facility.
transforming the way that utilities track
• Augmented reality and internal navigation — and manage demand for electricity.”
As she walks through a site, her device alerts her to
— Forrester report, “Smart Computing Connects CIOs With The Business,” March 28, 201262
areas tagged as problems in the past, indicates that
this particular site seems to lack necessary supplies and
offers data about conditions in similar facilities to help
start conversations with individuals at the site.
This scenario isn’t at all far from reality. The U.S.
Department of Veterans Affairs is in the process of installing
a real-time location system for its hospital assets ranging
from surgical instruments to patients’ beds, designed to
improve efficiency and patient safety. Through the use of
radio frequency identification (RFID) tags and barcodes,
employees can locate equipment in real-time, monitor
inventory levels, and ensure sensitive equipment is being
housed within the right temperature and humidity ranges.63
16Problems addressed with place-based collaboration
• Use location data to address duplication and overlap. Today’s challenges require governments to
coordinate and connect services across jurisdictional lines.64 Without such coordination, service delivery can
be disjointed, inconsistent and ineffective. The U.S. Government Accountability Office (GAO) reports often
highlight fragmented service delivery due to a lack of common goals or formal data sharing and collaboration
agreements.65 Place-based coordination and analysis within a geospatial platform can improve government
coordination and make service delivery more efficient and effective.
• Fill in “blind spots” for better decision making. The United States includes more than 3,100 counties and
19,000 municipalities, each with its own unique issues.66 Large federal initiatives may not account for local or
regional facts on the ground. Governments can create more effective policies by sharing information through a
cloud-based platform, and looking to public and private partners to help fill in the “blind spots” in their analyses.
• Accelerate the collection of useful information. Important decisions should be based on the best available
data. Despite the explosion in digital exhaust from the worldwide spread of smartphones, official information
can be outdated or take too long to collect and deliver to decision makers. Consider, for instance, that the data
used to measure progress toward the UN’s Millennium Development Goals is from 2008 or before, and thus fail
to account for the impacts of the global financial crisis. Meaningful geotagged data, assembled by government
workers or the affected populations themselves, can accelerate the collection of information needed to support
decision making.67
• Move past big data as a buzzword. Data is constantly generated via interactions between government and
citizens — filling out forms, completing transactions, and conducting site visits are just a few examples. The
potential of big data lies in tying all of this information together in a useful way. Because each interaction
possesses location metadata (such as addresses and coordinates), place becomes the lens through which
employees can access contextualized real-time information, translating big data from zeros and ones into better
quality services.
The power of zoom: Transforming government through location intelligence 17The landscape of Satellite imagery
location-based data:
Opportunities for government
to collect digital exhaust
101
010 0
10 10
1 Smart dev
10
101
010 0
10 10
1
Soil sensor 10
IPv6 tech
Expanding th
unique addre
Tra
Livestock sensors Pho
road
Traffic sensors
Public works
Technologies accelerating the use of location intelligence
Accelerator ‘Smart’ devices Sensors Cloud storage Ma
Impact Mobile devices that can detect Sensors provide constant data Cloud-based storage allows for the By ‘learnin
location, direction and movement, collection about our physical and collection, scaling and processing of data, comp
enabling context-based interaction natural infrastructure, offering a vast amounts of location data, and new data t
between government and citizens vibrant picture of trends across a enables geo-data sharing patterns th
range of data sources
Today Geotagged tweets and text messages Cities can monitor and track air Agencies share geo-data on a Law enforc
are used to connect with citizens quality to inform better regulations common platform predictive
Tomorrow Government uses geofencing to Government can trace contaminated Real-time data from millions of Unstructur
push information to individuals food to its source immediately, and sources are securely available instant ins
based on location even predict an outbreak anywhere, anytime
18COFFEE SHOP
Water quality sensors
HOSPITAL
vices
Machine learning Health &
location data
POLICE Predictive
policing
hnology Indoor navigation
he number of
ess connections
ansportation sensors Cloud-based sharing
one sensors transmit
d problems
Mass transit
achine learning Remote imagery BIM/CAD/GIS integration IPv6 technology
ng’ from historical spatial A blend of commercial and govern- The integration of Building Informa- Internet Protocol Version 6 will
puter algorithms can scan ment satellites, planes and drones tion Modeling, Computer Aided expand the number of unique
to identify anomalies and provide a near real-time picture of Design and Geographic Information addresses on the Internet,
hat yield predictive insight the changing conditions on the Systems enables analysis inside and improving geolocation
Earth’s surface outside of structures
rcement can create Imagery provides awareness about Site planners and inspectors use Road signs, utilities and other
models for violent crimes events like natural disasters, migra- GIS and building specifications to infrastructure are connected to
tion patterns and foreign conflicts perform more uniform evaluations the Internet
red social data becomes More granular imagery allows for Directions continue seamlessly from Emergency managers rapidly assess
sight for policy makers remote monitoring of public outdoors to inside buildings damage using data points from
infrastructure to predict future needs thousands of inanimate objects
The power of zoom: Transforming government through location intelligence 19Creating a new frame:
New models of delivery
using location-based data
While official reports took days or weeks, this information
could have been available almost immediately.70 “Official
“It’s not only infrastructure and case reports have to get verified by hospitals, so it often
centralized sensing networks — the takes a couple of weeks for that information to be posted
and available to health workers,” said Dr. Rumi Chunara,
greatest sensor network out there is the the study’s author and a research fellow at Harvard Medical
School. “Informal sources like Twitter are obviously much
people themselves. It’s some kind of more real-time.”71
ambient sensing, the wisdom of the Similarly, another research team tracked the position of
crowd. You don’t need to call 311, you 1.9 million cell phones owned by people living in Port-au-
Prince, and compared their location 42 days before the
just have to complain about it.” quake to 158 days after. The analysis showed that 630,000
people fled, more than 20 percent of the population,
— John Tolva, Chief Technology Officer, City of Chicago68
closely matching numbers from an official UN survey.72
Through a real-time study during the cholera outbreak, the
team was able to show updated population movements
Previously, we observed how digital exhaust assisted within 12 hours. Such data could be used to find survivors
recovery efforts in Haiti, both through visualization and and direct resources to where they are needed, and to
collaboration. But there is a third aspect to this example — model how populations react in emergency situations for
the power of digital signals as a force multiplier, to make future responses to humanitarian crises.
big impacts even with relatively small amounts of data.
Location intelligence can help government understand
Several months after the cholera outbreak that followed problems in new ways, and design new models for
the Haitian earthquake, a team of health researchers mined delivering services that rely on these insights. To take
Twitter traffic and news stories from the first 100 days advantage of these capabilities, we must identify and
after the outbreak to search for correlations with official collect new types of spatial data and translate them into
reports.69 After collecting almost 200,000 tweets and useful information. In the commercial world, several
close to 5,000 news reports mentioning cholera in English, industry leaders — Google, Apple, Amazon — are already
French or Spanish, the team found a strong connection competing in a location-based “arms race” to develop
between geolocated chatter about cholera and the actual products tailored to users’ location and context (see
times and locations of outbreaks. inset box).
The location-based “arms race”
The commercial battle for location-based service supremacy is heating up. Earth with 3D imagery of major cities that Google collected with its own
Apple recently announced its own mapping application for the iPhone fleet of planes.
and iPad, complete with turn-by-turn navigation from TomTom, replacing Both giants are primed to invest significant resources in location-based
a service provided by Google since the release of the first iPhone. There services. By some estimates, Google already spends between $500
is a strong business case for Apple; other products like Siri would benefit million and $1 billion annually on map-related services, up to a fifth of
from learning users’ locations, destinations and local search habits, data its total R&D budget.73 Other players also are getting involved. Microsoft
currently valued by Google to target advertising. Google responded by incorporates mapping and navigation powered by Navteq in its new
releasing its own set of new mapping features, including Google Now, devices, while Amazon recently acquired a small mapping company for
which uses location tracking to anticipate what users might search for possible inclusion on future Amazon-branded mobile devices.74,75
(such as transit routes or local dining options), and an updated Google
20The public sector can benefit as well. Armed with this from government employees as the task is happening.
additional data, governments can better accomplish their For example, postal delivery drivers can record the
missions, create new models for service delivery and use most efficient routes or indicate when a property
the power of the public to develop solutions. appears vacant.
1. Translate signals into value Each of these forms of data collection is possible today, and
Four ways location- The challenge involved in using digital exhaust is to find new technologies offer the potential for even more detailed
based data can value within the terabytes of datasets produced every hour. reporting. One example is Geoloqi, a platform that blends
power new models: Location analytics offer a means of viewing current trends geofencing, location analytics and other services to create
1. Translate signals in real-time, in a way that keeps the public in focus, reports of consumer behavior.80 By framing services around
into value allows agencies to ask new questions and begins to yield this level of “hyperdetail,” founder Amber Case envisions
2. Gather asset new insights. an easier, more efficient world where the “smartphone
intelligence becomes a remote control for reality.”81
3. Design This will become increasingly important as government
geo-intelligent agencies attempt to “app-ify” their services. For example, Consider, for instance, a citizen walking into a post office
programs the White House’s new Digital Government Strategy or approaching an airport security checkpoint and receiving
4. Use place-based directs agencies to optimize certain customer-facing helpful information, such as hours of operation or current
thinking to redefine services within six months, and many of them will take wait times, pushed to his or her mobile device without
“public” services the form of mobile apps.76,77 prompting. Through mobile apps and other opt-in services,
individuals could receive personally tailored information
Create a mechanism to collect meta-data. To get the simply because they’ve entered a ‘geofence’ set up by
right data into the hands of the public requires government an agency. Simpler interactions, customized data —
to understand what information it wants and needs. Data these services have the potential to greatly improve the
sources that public agencies can use include: individual’s customer experience with government.
• Direct citizen data — Many agency websites already
collect Web analytics indicating what users are searching
for.78 User analytics go a step further to capture Location analytics terminology
where people are located while searching, whether • User analytics: Correlating location metadata with an
on a computer or mobile device or at a public kiosk. individual’s current activity
By correlating search data with particular locations, • Geofence: A digital boundary for grouping location-
agencies can tailor search results to improve access to based data
their information or services. • Dwell time: Amount of time a user spends in a
• Indirect citizen data — Data from public sources such particular location
as social media are publicly available, and in many cases • Social sharing: Amount of social data the user is
already geolocated. Chicago is looking to Twitter to generating (tweets, posts) in a place
reinvent the way it identifies problems involving city
services. By establishing a “geofence” around parts of
the city to focus the intake of social media, analysts 2. Gather asset intelligence
can collect data, anonymize identity and classify Agencies also can use signals from fixed resources including
the information for action by the appropriate city vehicles, buildings and other devices and infrastructure
department. For example, a tweet stating that “on the to increase operating efficiency and better monitor
bus from loop 2 Wrigley and AC has totally died” could performance. Advances in RFID and GPS technology have
trigger a service request to assess and repair the bus’s increased resolution to millimeter-level positioning, creating
air conditioning.79 new opportunities for innovation.82 The era of “GPS
• Employee interaction — Government can reduce everywhere” allows agencies to visualize relationships and
the administrative “friction” of manually entering collect information in previously unimagined ways.
performance data by capturing geotagged reports
The power of zoom: Transforming government through location intelligence 21You can also read


