2017 The Sustainable Development Goals Report - UNSD
←
→
Page content transcription
If your browser does not render page correctly, please read the page content below
The Sustainable Development Goals Report
                                  2017

United Nations
Contents

2    Foreword

3    Overview

14   Harnessing the power of data

16   Goal 1: No poverty

18   Goal 2: Zero hunger

20   Goal 3: Good health and well-being

24   Goal 4: Quality education

26   Goal 5: Gender equality

30   Goal 6: Clean water and sanitation

32   Goal 7: Affordable and clean energy

34   Goal 8: Decent work and economic growth

36   Goal 9: Industry, innovation and infrastructure

38   Goal 10: Reduced inequalities

40   Goal 11: Sustainable cities and communities

42   Goal 12: Responsible consumption and production

44   Goal 13: Climate action

46   Goal 14: Life below water

48   Goal 15: Life on land

50   Goal 16: Peace, justice and strong institutions

54   Goal 17: Partnerships for the Goals

58   A note to the reader

59   Regional groupings
The Sustainable
                 Development
                 Goals Report
                 2017

United Nations
New York, 2017
Foreword

In adopting the 2030 Agenda for Sustainable Development, world               Sustainable development also depends fundamentally on upholding
leaders resolved to free humanity from poverty, secure a healthy             human rights and ensuring peace and security. Leaving no one
planet for future generations, and build peaceful, inclusive societies       behind also means reducing inequalities within and among countries,
as a foundation for ensuring lives of dignity for all.                       reaching those most at risk, and strengthening our resolve to prevent
                                                                             conflict and sustain peace.
This collective journey has at its heart a promise to leave no one behind.
The 2030 Agenda is deliberately ambitious and transformational, with         This report provides a snapshot of our efforts to date. It stresses that
a set of 17 integrated and indivisible Sustainable Development Goals         high-level political leadership and new partnerships will be essential
and targets to guide us. Crucially, it is a universal agenda, applying to    for sustaining momentum. It also underscores the need for reliable,
all countries; even the richest have yet to fully ensure women’s rights,     timely, accessible and disaggregated data to measure progress, inform
conquer inequality or safeguard the environment.                             decision-making and ensure that everyone is counted.

Implementation has begun, but the clock is ticking. This report shows        The 2030 Agenda for Sustainable Development aims to improve the
that the rate of progress in many areas is far slower than needed to         lives and future prospects of everyone, everywhere. Along with the
meet the targets by 2030.                                                    “Sustaining Peace” resolutions adopted by the General Assembly
                                                                             and Security Council, the world now has, in its hands, roadmaps
Focused actions are needed to lift the 767 million people who still          for reducing vulnerability, increasing resilience and averting armed
live on less than 1.90 US dollars a day, and to ensure food security         conflict. Indeed, sustainable and inclusive development is both a goal
for the 793 million people who routinely confront hunger. We need            in its own right and the world’s best form of prevention.
to double the rate at which we are reducing maternal deaths. We
need more determined progress towards sustainable energy, and                Our challenge now is to mobilize action that will bring these
greater investments in sustainable infrastructure. And we need to            agendas meaningfully and tangibly to life. I call on Governments and
bring quality education within reach of all; if all children in low-income   stakeholders to recognize the gaps that have been identified in this
countries completed upper secondary school by 2030, per capita               report—in implementation, financing and political will—and to now
income would increase by 75 per cent by 2050 and we could                    join hands to fulfil this vision and keep this promise. For my part, I will
advance the fight to eliminate poverty by a full decade.                     do my utmost to make the United Nations itself more effective and
                                                                             efficient so that it can deliver coherent support on the ground, on one
Gender inequality is still deeply entrenched, as manifested in the slow      agenda. Together, we can make the full, transformative ambition of the
progress in women’s representation in political life, in decision-making     2030 Agenda a reality for all.
within their own households, and in the violence, most often with
impunity, that women and girls face in all societies. Young people
continue to face alarmingly high rates of unemployment, and their
voices are yet to be sufficiently included in the deliberations affecting
their lives and futures.

More than 2 billion people are living in countries with excess water
                                                                             António Guterres
stress. Nine out of 10 city dwellers are living in cities where air
                                                                             Secretary-General, United Nations
pollution is a health hazard. Planetary warming continues unabated,
setting a new record of about 1.1 degrees Celsius above the pre-
industrial period and contributing to an increased frequency of
extreme weather events.

   2        The Sustainable Development Goals Report 2017
Overview

The Sustainable Development Goals Report 2017 reviews progress          While considerable progress has been made over the past decade
made towards the 17 Goals in the second year of implementation          across all areas of development, the pace of progress observed
of the 2030 Agenda for Sustainable Development. The report              in previous years is insufficient to fully meet the Sustainable
is based on the latest available data. It highlights both gains         Development Goals (SDGs) and targets by 2030. Time is therefore
and challenges as the international community moves towards             of the essence. Moreover, as the following pages show, progress
full realization of the ambitions and principles espoused in the        has not always been equitable. Advancements have been uneven
2030 Agenda.                                                            across regions, between the sexes, and among people of different
                                                                        ages, wealth and locales, including urban and rural dwellers. Faster
                                                                        and more inclusive progress is needed to accomplish the bold
                                                                        vision articulated in the 2030 Agenda.

  Goal 1:      End poverty in all its forms everywhere

Giving people in every part of the world the support they need to lift themselves out of           Number of people living in extreme poverty
poverty in all its manifestations is the very essence of sustainable development. Goal 1                       fell significantly
focuses on ending poverty through interrelated strategies, including the promotion of                    1.7 billion      767 million
social protection systems, decent employment and building the resilience of the poor.
 f estimated 767 million people lived below the extreme poverty line in 2013,
fAn
 down from 1.7 billion people in 1999. This represents a reduction in the global
 rate of extreme poverty from 28 per cent in 1999 to 11 per cent in 2013.                                                    2013

 f
fAlmost  10 per cent of the employed population worldwide lived with their families
 on less than 1.90 US dollars per person per day in 2016. Vulnerability was much                           1999
 higher for younger workers: 9 per cent of adult workers and their families lived in
 extreme poverty compared to 15 per cent of youth workers.
                                                                                                     Proportion of vulnerable populations
 f 2016, only 22 per cent of the unemployed worldwide received unemployment
fIn                                                                                                  covered by social protection systems
                                                                                                                  is still low
 benefits, 28 per cent of people with severe disabilities collected a disability pension,
 35 per cent of children were covered by social protection, 41 per cent of women giving                                     68%
 birth received maternity benefits, and 68 per cent of people above retirement age
 collected a pension.                                                                                             41%

 f
fEconomic   losses from natural hazards are now reaching an average of 250 billion to                         35%
 300 billion US dollars a year, with a disproportionate impact on small and vulnerable
 countries.                                                                                               28%

                                                                                                        22%

                                                                                                                                         3
Goal 2: End hunger, achieve food security and improved nutrition and promote
            sustainable agriculture

                                                             Goal 2 addresses a fundamental human need—access to nutritious, healthy food, and
  Almost two thirds suffering from hunger
live in sub-Saharan Africa and Southern Asia                 the means by which it can be sustainably secured for everyone. Tackling hunger cannot
                                                             be addressed by increasing food production alone. Well-functioning markets, increased
                                                             incomes for smallholder farmers, equal access to technology and land, and additional
                                                             investments all play a role in creating a vibrant and productive agricultural sector that
                                                             builds food security.
                                           63%
                                                              f
                                                             fThe proportion of undernourished people worldwide declined from 15 per cent in
                                                              2000-2002 to about 11 per cent in 2014-2016. Globally, about 793 million people
                                                              were undernourished in 2014-2016, down from 930 million in 2000-2002.
                 Stunting
                                                              f
                                                             fSouthern Asia and sub-Saharan Africa accounted for 63 per cent of undernourished
       198            155                                     people worldwide in 2014-2016.
      million        million             Stunting in
                                         children under       f 2016, an estimated 155 million children under age 5 were stunted (low height for their
                                                             fIn
      2000              2016             age 5 fell from      age), 52 million were suffering from wasting (low weight for their height), and 41 million
                                         2000 to 2016,
                                         while overweight     were overweight. Globally, the stunting rate fell from 33 per cent in 2000 to 23 per cent
                                         children under       in 2016.
                 Overweight              age 5 increased
                                                              f
                                                             fThe share of aid to agriculture in sector-allocable aid from member countries of the
       30             41                                      Development Assistance Committee of the Organisation for Economic Co-operation
      million       million
                                                              and Development fell from nearly 20 per cent in the mid-1980s to 7 per cent in 2015.
      2000          2016

   Goal 3:                 Ensure healthy lives and promote well-being for all at all ages

Maternal deaths per                                          Goal 3 addresses all major health priorities and calls for improving reproductive, maternal
100,000 live births
                                                             and child health; ending communicable diseases; reducing non-communicable diseases
350
        341
                                                             and other health hazards; and ensuring universal access to safe, effective, quality and
                                     Global maternal         affordable medicines and vaccines as well as health coverage.
                                     mortality ratio
200
                        216          fell by 37 per cent      f
                                                             fBetween  2000 and 2015, the global maternal mortality ratio declined by 37 per cent,
                                     from 2000 to 2015
                                                              and the under-5 mortality rate fell by 44 per cent. However, 303,000 women died
                                                              during pregnancy or childbirth and 5.9 million children under age 5 died worldwide
 50
       2000             2015                                  in 2015. Most of these deaths were from preventable causes.

                                                              f
                                                             fThe  period between 2000 and 2015 saw a 46 per cent reduction in HIV incidence;
                                                              a 17 per cent decline in the incidence of tuberculosis; a 41 per cent decrease in the
                               17%
                                                              incidence of malaria; and a 21 per cent drop in people requiring mass or individual
                                                              treatment and care for neglected tropical diseases.
                               Tuberculosis incidence
                               dropped 17 per cent            f
                                                             fThe risk of dying between the ages of 30 and 70 from one of four main
                               from 2000 to 2015
                                                              non‑communicable diseases (NCDs)—cardiovascular disease, cancer, diabetes or
 2000            2015                                         chronic respiratory disease—fell from 23 per cent to 19 per cent between 2000 and
                                                              2015, not rapidly enough to meet the 2030 target.

                                                              f
                                                             fNearly  800,000 suicides occurred worldwide in 2015, with men about twice as likely
 Risk of dying between ages of 30 and 70                      to die by suicide as women.
       from one of these four NCDs
          fell from 2000 to 2015                              f 2013, around 1.25 million people died from road traffic injuries, an increase of
                                                             fIn
                                                              13 per cent since 2000.
                                                       23%
                                                              f
                                                             fGlobally in 2012, household air pollution from cooking with unclean fuels and inefficient
                                                              technologies led to an estimated 4.3 million deaths; another 3 million deaths were
Cardiovascular    Cancer      Diabetes     Chronic
   disease                               respiratory
                                           disease
                                                       19%    attributed to ambient air pollution from traffic, industrial sources, waste burning and
                                                              residential fuel combustion.

   4              The Sustainable Development Goals Report 2017
Goal 4: Ensure inclusive and equitable quality education and promote lifelong
           learning opportunities for all

Goal 4 aims to ensure that all people have access to quality education and the opportunity
for lifelong learning. The Goal goes beyond school enrolment and looks at proficiency
                                                                                                                     Proportion of
levels, the availability of trained teachers and adequate school facilities, and disparities                         primary school age
in education outcomes.                                                                                               children out of school
                                                                                                                     has stagnated at
 f 2014, 2 out of 3 children worldwide participated in pre-primary or primary
fIn                                                                                                                  about 9 per cent
                                                                                                 9%          9%      since 2008
 education in the year prior to the official entrance age for primary school, compared
 to only 4 in 10 children in the poorest countries.                                             2008         2014

 f
fDespite   considerable gains in primary school enrolment between 2000 and 2014,
 9 per cent of primary-school-aged children worldwide were out of school in 2014,
 with little progress since 2008.                                                              In 2011, only around one quarter of schools
                                                                                                   in sub-Saharan Africa had electricity
 f
fSurveys  undertaken between 2007 and 2015 in selected countries show that children                    and less than half had access
                                                                                                          to basic drinking water
 and adolescents from the richest 20 per cent of households achieved greater proficiency
 in reading than those from the poorest 20 per cent of households, and urban children
 scored higher in reading than rural children.

 f
fData  for 2011 indicate that only about one quarter of schools in sub-Saharan Africa had
 electricity, less than half had access to drinking water, and only 69 per cent had toilets
 (with many lacking separate sanitation facilities for girls and boys).                                  25%                48%

  Goal 5:       Achieve gender equality and empower all women and girls

Gender inequality persists worldwide, depriving women and girls of their basic rights            1 in 5 ever-partnered women and girls
and opportunities. Achieving gender equality and the empowerment of women and girls             were subjected to physical and/or sexual
will require more vigorous efforts, including legal frameworks, to counter deeply rooted             violence by an intimate partner

gender-based discrimination often resulting from patriarchal attitudes and related social
norms.

 f
fOne  in five girls and women (aged 15 to 49) who have ever been married or in union
 reported they had been subjected to physical and/or sexual violence by an intimate
 partner in the previous 12 months, according to surveys undertaken between 2005
 and 2016 in 87 countries.
                                                                                                                          1 in 4 women
 f
fAround   2000, nearly one in three women between 20 and 24 years of age reported                                         aged 20-24
 that they were married before age 18; around 2015, the ratio had declined to roughly                                     were married
 one in four.                                                                                                             before age 18
                                                                                                                          in 2015
 f
fAccording  to surveys undertaken around 2015 in 30 countries where the practice of
 female genital mutilation is concentrated, over a third (35 per cent) of girls between
 the ages of 15 and 19 had been subjected to the procedure.
                                                                                                 Fewer than 1 in 3 senior- and middle-
 f average, women spent almost triple the amount of time on unpaid domestic and
fOn                                                                                                management positions were held
 care work as men, based on data from 2000 to 2016.                                            by women in the majority of 67 countries

 f
fWomen’s  participation in single or lower houses of national parliaments worldwide
 reached only 23.4 per cent in 2017. In the majority of the 67 countries with data from
 2009 to 2015, fewer than a third of senior- and middle-management positions were
 held by women.

                                                                                                                    Overview          5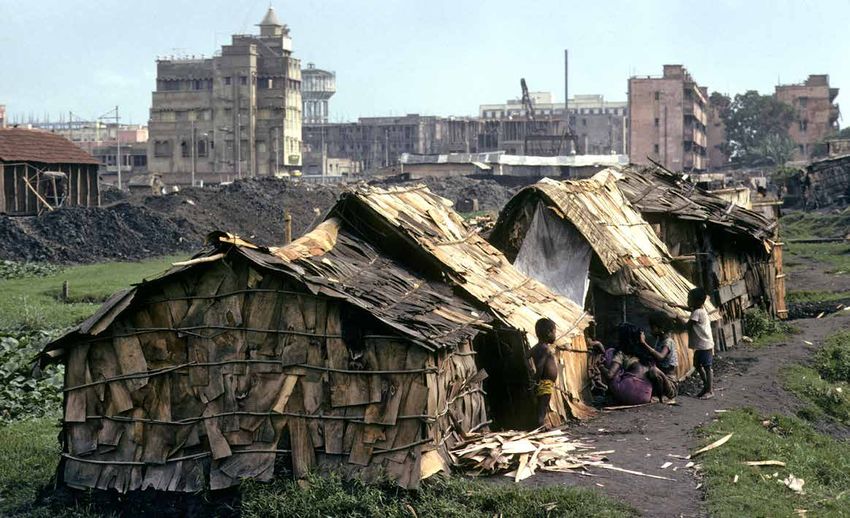
Goal 6: Ensure availability and sustainable management of water and sanitation for all

                                             Goal 6 aims to tackle challenges related to drinking water, sanitation and hygiene for
                   5.2 billion people used   populations, as well as to water-related ecosystems. Without quality, sustainable water
                   a “safely managed”        resources and sanitation, progress in many other areas across the SDGs, including health,
                   drinking water service
                   in 2015
                                             education and poverty reduction, will also be held back.

                                              f 2015, 5.2 billion people (71 per cent of the global population) used a “safely managed”
                                             fIn
                                              drinking water service—an improved source located on premises, available when needed
                   2.9 billion people used    and free from contamination.
                   a “safely managed”
                   sanitation service
                   in 2015                    f 2015, 2.9 billion people (39 per cent of the global population) used a “safely managed”
                                             fIn
                                              sanitation service—a basic facility that safely disposed of human waste.

                   892 million people         f
                                             fOpen  defecation, practised by 892 million people (12 per cent of the global population)
                   still practised open       in 2015, continues to pose serious health risks.
                   defecation in 2015
                                              f
                                             fMore  than 2 billion people globally are living in countries with excess water stress.
                                              Northern Africa and Western Asia, as well as Central and Southern Asia, experience
                                              water stress levels above 60 per cent, indicating the strong probability of future water
                   More than                  scarcity.
                   2 billion people
                   are affected
                   by water stress

Goal 7:           Ensure access to affordable, reliable, sustainable and modern energy for all

    Electricity access in rural areas        Universal access to affordable, reliable and sustainable energy services requires expanding
      is lower than in urban areas           access to electricity and clean cooking fuels and technologies, as well as improving
                                             energy efficiency and increasing the use of renewable energy. To achieve this Goal, bolder
                                             financing and policies will be needed, along with the willingness of countries to embrace
                                             new technologies on a much more ambitious scale.
            96%             73%
                                              f 2014, 85.3 per cent of the global population had access to electricity, up from
                                             fIn
                                              77.6 per cent in 2000. However, 1.06 billion people still lived without this basic service.

    Urban                      Rural          f
                                             fWhile 96 per cent of urban residents could access electricity in 2014, the share was
                                              only 73 per cent in rural areas.

                                              f
                                             fAccess   to clean fuels and technologies for cooking climbed to 57 per cent in 2014, up
                                              from 50 per cent in 2000. Still, more than 3 billion people, most of them in Asia and
                                              sub-Saharan Africa, lack access to clean cooking fuels and technologies and are exposed
                        More than             to high levels of household air pollution.
                        3 billion people
                        still lack access     f
                                             fThe share of renewable energy in final energy consumption grew modestly from 2010 to
                        to clean cooking      2014—from 17.5 to 18.3 per cent. Water, solar and wind power generation accounted for
                        fuels and             most of the increase.
                        technologies
                                              f
                                             fGlobally, primary energy intensity improved by 2.1 per cent a year from 2012 to
                                              2014. However, this pace is insufficient to double the global rate of energy efficiency
                                              improvements as called for in the target.

6           The Sustainable Development Goals Report 2017
Goal 8: Promote sustained, inclusive and sustainable economic growth, full
           and productive employment and decent work for all

Economic growth is a principal driver of sustainable development. When this growth is       2.0

sustained and inclusive, more people can escape poverty as opportunities for full and                             1.6%
                                                                                                                             Annual global
                                                                                                                             GDP growth
productive employment expand. To allow future generations to benefit from today’s           1.5
                                                                                                                             per capita
economic growth, such growth should be environmentally sound and not the result of                                           expanded
                                                                                            1.0                              between
unsustainable exploitation of resources.                                                                                     2005-2009
                                                                                                  0.9%                       and 2010-2015
 f
fThe average annual growth rate of real gross domestic product (GDP) per capita             0.5
                                                                                                   2005-      2010-
 expanded from 0.9 per cent over the period 2005-2009 to 1.6 per cent in 2010-2015.                2009       2015
 Real GDP growth in the least developed countries (LDCs) averaged 4.9 per cent in
 2010-2015, short of the target of at least 7 per cent annually.

 f
fGrowth  in labour productivity—measured by GDP per worker—slowed sharply after the
 financial crisis of 2008-2009. It grew at an average annual rate of 1.9 per cent between
                                                                                            Around 1 in 10 children worldwide were
 2009 and 2016, compared to 2.9 per cent between 2000 and 2008.                                 engaged in child labour in 2012

 f
fThe  global unemployment rate fell from 6.1 per cent in 2010 to 5.7 per cent in 2016.
 Despite progress overall, youth (aged 15 to 24 years) were nearly three times more
 likely than adults to be without a job, with unemployment rates of 12.8 per cent and
 4.4 per cent, respectively.

 f
fThe  number of children aged 5 to 17 engaged in child labour declined from 246 million
 in 2000 to 168 million in 2012. Still, around 1 in 10 children worldwide were engaged
 in child labour in 2012; more than half of them (85 million) were exposed to hazardous
 forms of work.

  Goal 9: Build resilient infrastructure, promote inclusive and sustainable
           industrialization and foster innovation

Infrastructure, industrialization and innovation are three drivers of economic growth.
When inclusivity, resilience and sustainability are factored into the implementation of                                  LDCs, LLDCs and
                                                                                                                         SIDS each accounted
these driving forces, economic growth can support sustainable development.
                                                                                                                         for 1 to 2.7 per cent
 f 2015, the economic impact of air transport was 2.7 trillion US dollars (3.5 per cent
fIn                                                                                                                      of global air travel
                                                                                                                         and freight volumes
 of global GDP). The least developed countries (LDCs), landlocked developing countries
 (LLDCs) and small island developing States (SIDS) accounted for limited air travel and
 freight volumes—each country group comprised only a small fraction (1 to 2.7 per cent)
 of the global total.

 f
fBetween 2005 and 2016, manufacturing value added (MVA) per capita increased by
 almost 59 per cent in LDCs, yet was still only about 2 per cent of that in Europe and
                                                                                                                    4.5%
 Northern America.                                                                                                  annually

 f
fBetween   2000 and 2014, steady reductions were observed in carbon dioxide (CO2)                                   Global investment
                                                                                                                    in R&D increased
 emissions from manufacturing per unit of MVA in most regions of the world and in all 10                            at an average annual
 of the largest manufacturing countries.                                                                            rate of 4.5 per cent
                                                                                                                    between 2000 and 2014
 f
fGlobal  investment in research and development increased at an average annual rate
                                                                                            2000           2014
 of 4.5 per cent between 2000 and 2014. It reached 1.8 trillion US dollars (purchasing
 power parity) in 2014—1.7 per cent of global GDP.

 f
fCoverage  by a mobile cellular signal has become almost universal. In 2016, 95 per cent
 of the world’s population was in range of at least a second-generation (2G) signal and
 84 per cent received at least a third-generation (3G) signal.

                                                                                                                         Overview         7
Goal 10: Reduce inequality within and among countries

70                                               Goal 10 calls for reducing inequality within and among countries, ensuring safe,
                    65%
                          Proportion of tariff   orderly and regular migration, and strengthening the voices of developing countries
60                        lines for exports      in international economic and financial decision-making.
                          from LDCs with
          ZERO TARIFF     zero tariffs            f 49 of 83 countries with data for the period 2011-2015, the per capita incomes of the
                                                 fIn
50
                          increased from          poorest 40 per cent of the population grew more rapidly than the national average,
     49%
                          2005 to 2015
40
                                                  leading to a reduction in income inequality.
     2005         2015
                                                  f
                                                 fReforms  at the International Monetary Fund have led to increased voting shares
                                                  for developing countries, yet in many international organizations their voting shares
                                                  remain far below their overall membership levels.

                                                  f
                                                 fThe  international trade community continues to grant more favourable access
     Global cost of sending remittances
         averaged above 7 per cent                conditions to LDCs: the proportion of tariff lines for exports from LDCs with zero
                                                  tariffs increased from 49 per cent in 2005 to 65 per cent in 2015.

                                                  f average, the cost of sending remittances home is above 7 per cent of the amount
                                                 fOn
                         7%                       remitted, significantly higher than the 3 per cent target. New and improved technologies,
                                                  such as prepaid cards and mobile operators, helped reduce these fees to between
                                                  2 per cent and 4 per cent, but are not yet widely available or used in many remittance
                                                  corridors.

     Goal 11:       Make cities and human settlements inclusive, safe, resilient and sustainable

           9 in 10 living in urban areas         The pace of urban growth has been unprecedented. More than half the world’s population,
          breathed air that did not meet         or nearly 4 billion people, lived in cities in 2015. However, while cities are incubators
         WHO air quality guidelines in 2014      of innovation and help foster increased employment and economic growth, rapid
                                                 urbanization has brought with it enormous challenges, including inadequate housing,
                                                 increased air pollution, and lack of access to basic services and infrastructure.

                                                  f
                                                 fThe  proportion of the urban population living in slums worldwide fell from 28 per cent
                                                  in 2000 to 23 per cent in 2014. However, in sub-Saharan Africa, more than half
                                                  (56 per cent) of urban dwellers lived in slum conditions.

                                                  f
                                                 fFrom 2000 to 2015, in all regions of the world, the expansion of urban land outpaced the
                                                  growth of urban populations, resulting in urban sprawl.

                                                  f
                                                 fAccording to data from cities in 101 countries from 2009 to 2013, approximately
                              Coverage of
                                                  65 per cent of the population was served by municipal waste collection.
                              municipal waste     f 2014, 9 in 10 people living in urban areas breathed air that did not meet the World
                                                 fIn
                              collection was
                              65 per cent         Health Organization’s air quality guidelines value for particulate matter (PM 2.5).
                              in cities in
                                                  f of May 2017, 149 countries had fully or partially implemented national-level urban
                                                 fAs
                              101 countries
                                                  policies, most of which are aligned with priority areas identified in the SDGs.

     8         The Sustainable Development Goals Report 2017
Goal 12: Ensure sustainable consumption and production patterns
Sustainable consumption and production patterns enable efficient resource use and
can reduce the impact of economic activities on the environment. To that end, this Goal 80
focuses on decoupling economic growth from resource use, and ensuring that hazardous
60 Global
chemicals and wastes are managed in a way that minimizes their impact on human lives material
and the environment. 69.3 footprint
40
48.5 billion increased
billion metric from 2000
f
fGlobally, the material footprint of human beings increased from 48.5 billion metric tons metric tons
20 to 2010
in 2000 to 69.3 billion metric tons in 2010. The material footprint per capita increased tons
from 8 metric tons per person to 10 metric tons per person over the same period. 0
2000 2010
f 2010, Australia and New Zealand had the highest material footprint per capita
fIn
(35 metric tons per person), followed by Europe and Northern America (20 metric tons
per person); sub-Saharan Africa had the lowest (2.5 metric tons per person).
Eastern and South-Eastern Asia accounted
for 42 per cent of global DMC in 2010
f
fEastern and South-Eastern Asia accounted for 42 per cent of global domestic material
consumption (DMC), reflecting rapid industrialization in the region.
f
fAlmost all United Nations Member States are party to at least one global environmental
agreement on chemicals and hazardous waste. However, between 2010 and 2014, only 42%
51 per cent of Parties to the Stockholm Convention, 57 per cent of Parties to the Basel
Convention, and 71 per cent of Parties to the Rotterdam Convention fully met their
reporting commitments under these agreements.
Goal 13: Take urgent action to combat climate change and its impacts
Planetary warming continued in 2016, setting a record of about 1.1 degrees Celsius above
the pre-industrial period. The extent of global sea ice fell to 4.14 million square kilometres Global sea ice fell
in 2016, the second lowest on record. Mitigating climate change and its impacts will in 2016 to its
require building on the momentum achieved by the Paris Agreement on Climate Change. second lowest
extent on record
Stronger efforts are also needed to build resilience and limit climate-related hazards and
natural disasters.
f
fThe Paris Agreement entered into force on 4 November 2016, marking a shift in focus
towards implementation of action for the climate and sustainable development.
f of 7 June 2017, 148 Parties had ratified the Paris Agreement; of these, 142 Parties
fAs Record was set in 2016 for warming
at 1.1 degrees Celsius above
(141 countries and the European Commission) had communicated their first nationally pre-industrial period
determined contributions to the United Nations Framework Convention on Climate
Change Secretariat.
f
fThe number of deaths attributed to natural hazards continues to rise, despite progress
in implementing disaster risk reduction strategies. From 1990 to 2015, more than
1.6 million people died in internationally reported natural hazards.
f
fMany countries have begun implementing national and local disaster risk reduction
strategies. In 2014-2015, most reporting countries indicated that environmental impact
assessments, legislation on protected areas, climate change adaptation projects and
programmes, and integrated planning played a major role in reducing underlying risk
factors.
Overview 9Goal 14: Conserve and sustainably use the oceans, seas and marine resources
for sustainable development
Oceans cover almost three quarters of the planet, comprising the largest ecosystem on
Earth. The increasingly adverse impacts of climate change (including ocean acidification),
overfishing and marine pollution are jeopardizing recent gains in protecting portions of the
31 per cent of
marine fish stocks world’s oceans.
were overfished
in 2013 f 2017, protected areas cover 13.2 per cent of the marine environment under national
fIn
jurisdiction, 0.25 per cent of the marine environment beyond national jurisdiction,
and 5.3 per cent of the total global ocean area. The average coverage of marine key
biodiversity areas (KBAs) by protected areas has risen from 32 per cent in 2000 to
45 per cent in 2017.
f
fThe proportion of marine fish stocks worldwide that have been overfished—that is, are
at biologically unsustainable levels—increased from 10 per cent in 1974 to 31 per cent
As atmospheric CO2 levels increase, in 2013.
estimates indicate that oceans could
be nearly 150 per cent more acidic by 2100 f
fOceans absorb up to 30 per cent of the annual emissions of CO2 generated by human
CO2 CO2
activity. However, the absorbed CO2 also leads to an increase in the acidity of seawater,
CO2 CO2 CO2 CO2
CO2
CO2
which weakens the shells and skeletons of many marine species, such as corals.
CO2 CO2
CO2 CO2
CO2
As atmospheric CO2 levels rise, estimates indicate that oceans could be nearly
150 per cent more acidic by 2100.
f the 63 large marine ecosystems evaluated under the Transboundary Waters
fOf
Assessment Programme, 16 per cent are in the “high” or “highest” risk categories for
coastal eutrophication. By 2050, it is estimated that coastal eutrophication will increase
in 21 per cent of these large ecosystems.
Goal 15: Protect, restore and promote sustainable use of terrestrial ecosystems,
sustainably manage forests, combat desertification, and halt and reverse
land degradation and halt biodiversity loss
Land covered by forest Protected and restored ecosystems and the biodiversity they support can help mitigate
32
climate change and provide increased resilience in the face of mounting human pressures
31.6%
Annual net and natural disasters. Healthy ecosystems also produce multiple benefits for communities
loss of forest
that rely on them. Goal 15 focuses on preserving and sustainably using the Earth’s
area globally
30.8% between 2010 terrestrial species and ecosystems.
and 2015 was
less than half f
fFrom 2010 to 2015, the annual net loss of forest area globally was less than half that of
30.6%
that of the the 1990s. The proportion of land area covered by forest decreased from 31.6 per cent
1990s
30 in 1990 to 30.8 per cent in 2010 and 30.6 per cent in 2015.
1990 2010 2015
f
fFrom 2000 to 2017, average worldwide coverage of terrestrial, freshwater and mountain
KBAs by protected areas increased from 35 per cent to 47 per cent, from 32 per cent to
43 per cent, and from 39 per cent to 49 per cent, respectively.
Average worldwide coverages f
fBiodiversity loss, however, continues at an alarming rate. Corals, amphibians and cycads
of terrestrial, freshwater and are in serious decline due to distinct and worsening threats. Bleaching, driven by climate
mountain KBAs have increased
change and local impacts, has affected the health of coral reefs worldwide, which could
50 49%
47%
43%
disappear completely by 2050. Amphibians also face a high risk of extinction, with
40 41 per cent already threatened.
39%
35% f
fIllicit poaching and trafficking of wildlife continues to thwart conservation efforts,
30 32%
with nearly 7,000 species of animals and plants reported in illegal trade involving
2000 2017 2000 2017 2000 2017 120 countries. In 2013, elephant ivory, rosewood, rhinoceros horn and reptiles comprised
70 per cent of total wildlife seizures.
10 The Sustainable Development Goals Report 2017Goal 16: Promote peaceful and inclusive societies for sustainable development,
provide access to justice for all and build effective, accountable and inclusive
institutions at all levels
Peace, justice and effective, accountable and inclusive institutions are at the core of
sustainable development. Progress in promoting peaceful and inclusive societies remains 29% Over 70 per cent
of victims of
uneven across and within countries. Violent conflicts have increased in recent years, and trafficking were
a number of high-intensity armed conflicts are causing large numbers of civilian casualties women and girls
and driving millions of people from their homes.
71% in 2014
f 2015, the intentional homicide rate in countries with high income inequality (Gini index
fIn
>0.45) was nine times that of countries with low income inequality (Gini indexEradicating poverty and promoting prosperity in a changing
world
Eradicating all forms of poverty is at the core of sustainable of what they need most, including health care and education,
development. Poverty encompasses deprivation in many safe water and shelter. In 2015, 50 per cent of refugee children of
domains, including income, hunger, poor health, social exclusion, primary-school age were out of school. Many displaced children
discrimination and lack of access to basic services. At the same travel alone or are separated from their parents. Among the children
time, deprivations in any one of these domains can in turn making the dangerous passage from North Africa to Europe, the vast
exacerbate the depth or duration of deprivations in one or more majority—92 per cent—of those who arrived in Italy in 2016 and the
of the others. Eradicating poverty and promoting prosperity in first two months of 2017 were unaccompanied.
a changing world requires a holistic approach that takes into
account the interlinkages across the different dimensions of
sustainable development. This section provides a few highlights Women still face considerable structural
of these interconnections in the context of the theme and Goals disadvantages in escaping poverty
under review at the High-Level Political Forum on Sustainable Entrenched gender inequality continues to hold women back from
Development in July 2017. achieving their full potential. In 2015, for instance, almost 27 per cent
of women aged 20-24 were married before the age of 18—a practice
commonplace in Southern Asia and sub-Saharan Africa. These
Increasingly, the extreme poor reside in fragile settings
two regions are also home to 80 per cent of the world’s poor. Child
While nearly a billion people have escaped extreme poverty marriage is closely linked to early childbirth and poor access to health
since 1999, about 767 million remained destitute in 2013, living and reproductive health care. Typically, marriage ends or severely
on 1.90 US dollars or less a day. Half of the world’s poor lived in limits girls’ education, autonomy and economic potential.
sub-Saharan Africa, where 42 per cent of the population subsisted Societal assumptions and expectations of women’s roles as caregivers
in conditions of extreme poverty in 2013. Another one third lived in and mothers also curtail their income. Women spent almost three
Southern Asia. Those in extreme poverty are increasingly found living times as many hours on unpaid domestic work as men. Only half
in fragile situations such as conflict zones and remote areas that are of women in 45 countries with available data make their own
difficult to reach. And many of those who have climbed out of extreme decisions about reproductive health. And women’s and girls’ lack of
poverty continue to live precariously, just above the poverty line, and autonomy over their sexual and reproductive health—compounded
are highly vulnerable to falling backwards. Economic volatility, natural by unintended pregnancies—tends to increase household poverty.
disasters and other shocks put them at risk. About 80 per cent of the In many parts of the world, women’s access to land, property and
world’s poor live in rural areas and 64 per cent work in the agriculture financial assets remains restricted, which limits their economic
sector. Children are more likely to suffer poverty than adults: almost opportunities, and their ability to lift their families out of poverty.
385 million people living in extremely poor households were under
Around the world, one’s home is a key asset for stored wealth.
18 years of age in 2013. Adding to their vulnerability is the lack of
Preliminary analysis of data from selected countries finds that women
adequate social protection systems, which, if well designed, can help
possess less wealth in dwellings than men. In Uganda and Mongolia,
prevent and reduce poverty and inequality at every stage of life.
for example, fewer women than men own dwellings, with women
In 2016, only 45 per cent of the world’s population were covered by
representing only 35 per cent and 37 per cent of homeowners,
at least one social protection cash benefit.
respectively. In KwaZulu-Natal Province in South Africa, nearly half of
women own their own homes, but their dwellings have less monetary
value than men’s, accounting for only about one third of the total value
Conflict and war exacerbate poverty
of dwelling wealth.
Conflict has become the most insurmountable barrier to poverty Even in most European countries, poverty rates among older people
eradication and sustainable development. War, violence and are higher for women than for men. In more than half of the countries
persecution worldwide led to the displacement of 65.6 million people with available data, the gender gap is higher in one-person households
from their homes by the end of 2016. This represents an increase of compared to all households. This reflects women’s heightened
about 300,000 people since 2015, and the highest level recorded vulnerability when living by themselves.
in decades. Of these, 22.5 million were refugees, 40.3 million were
All over the world, women continue to be largely underrepresented
internally displaced, and 2.8 million were asylum seekers.
in parliaments and senior management positions, with less than
Children, who make up about half of the 17.2 million refugees under one-third representation in either domain in most regions of the world.
the responsibility of the United Nations High Commissioner for
Refugees, are disproportionately affected by conflict. In fleeing
to escape violence and persecution, children are often deprived
12 The Sustainable Development Goals Report 2017Ocean degradation threatens progress Eradicating poverty and promoting prosperity
on eliminating poverty cannot be achieved without reaching the most
vulnerable groups
Oceans cover almost three quarters of the planet. Close to 40 per cent
of the world’s population live in coastal communities, and about Empowering vulnerable groups is critical to ending poverty and
61 per cent of the world’s gross national product is produced within promoting prosperity for everyone everywhere. Due to age,
100 kilometres of oceans. Sustainable use of oceans can provide socioeconomic status, gender, ethnicity and geography, vulnerable
countries with food and economic opportunities in fisheries, groups tend to be excluded from access to good education, health
tourism and recreation, along with transport and trade, among care, electricity, safe water and other critical services. In 2016,
others. Appropriate management of this priceless resource can for instance, 15 per cent of young workers and their families lived
help reduce poverty by enhancing food security and improving the in extreme poverty, compared to 9 per cent of adult workers.
livelihoods of millions of people. However, climate change and recent Moreover, youth were nearly three times more likely than adults to be
trends showing ocean acidification, eutrophication, environmental unemployed. In 2015, 85 per cent of the urban population used safely
degradation of coastal land, and a reduction in marine biodiversity are managed drinking water services, compared to only 55 per cent of the
together exerting mounting pressures on this resource. In 2013, nearly rural population. Exclusion extends to persons with disabilities as well.
a third (31 per cent) of marine stocks were overfished; increasing In 2016, only 28 per cent of people with severe disabilities collected
ocean acidification levels endanger marine ecosystems worldwide; a disability pension.
and, by 2050, coastal eutrophication will increase in 21 per cent of The lack of sound disaggregated data for many of these vulnerable
major marine ecosystems. And the decreasing extent of global sea groups—including children, youth, persons with disabilities, people
ice as well as the increasing level of planetary warming indicate that living with HIV, older persons, indigenous peoples, migrants, refugees
climate change continues, increasing the adverse impacts on the and those internally displaced—exacerbates vulnerabilities by
oceans and many other ecosystems. masking the extent of deprivation and disparities. What’s more, a lack
of rigorous evidence and comprehensive data has long compromised
the ability of governments and the international community to
Investment in infrastructure and technology accurately document the discrimination faced by various groups.
can help poor rural farmers As a result, planning and budgeting for necessary services along with
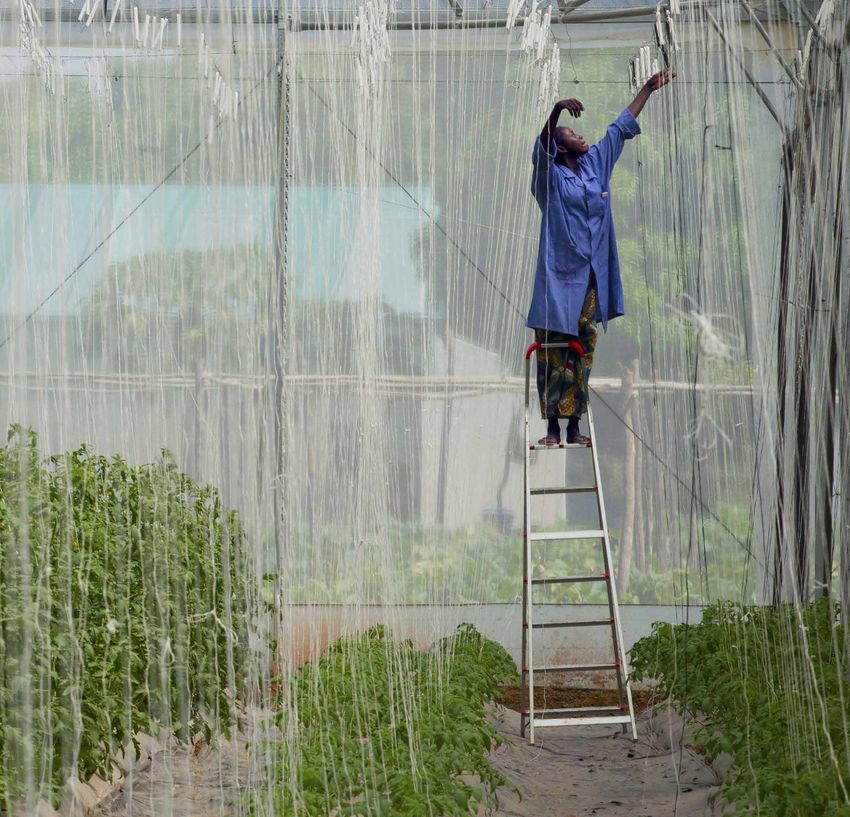
Sustainable agriculture, along with investments to improve effective policymaking have suffered. Children living outside of family
agricultural productivity and enhance food security, are key to ending care, persons with disabilities and older persons, for example, have
hunger and lifting millions of people, including small-scale farmers, largely fallen off the statistical “map”. While innovative approaches
out of extreme poverty. Improving farm productivity, increasing the for bringing these hidden populations into focus have begun to
value added in agriculture, and integrating markets are all important emerge, more resources and capacity-building efforts are needed to
strategies. The role of infrastructure and technology in this regard ensure that vulnerable groups receive their long-overdue place in the
cannot be overstated. Transportation infrastructure, for instance, can development agenda.
connect farmers with existing markets and create new ones. Where
poverty rates are still very high—as in sub-Saharan Africa—air travel
and freight transportation are very limited. The rapid expansion
of mobile cellular service is, however, helping to overcome some
barriers. By 2016, 2G mobile cellular networks were almost universal,
with 95 per cent of the world’s population covered. Information and
communication technologies can help farmers connect with buyers, Wu Hongbo
transfer money and acquire valuable information, including about
Under-Secretary-General for Economic and Social Affairs
weather conditions and market prices.
Overview 13Harnessing the power of data for sustainable development
To fully implement and monitor progress on the SDGs, Data innovation projects are being implemented by a broad range of
decision makers need data and statistics that are accurate, timely, public and private actors in many parts of the world, including Africa,
sufficiently disaggregated, relevant, accessible and easy to use. Asia and Latin America. The results are promising. For instance,
Data availability and quality have steadily improved over the years. crowdsourcing exercises are being employed for the collection and
However, statistical capacity still needs strengthening and data analysis of data for disaster risk management and data on climate
literacy must be enhanced at all levels of decision-making. This change. That said, the use of innovative technologies and new data
will require coordinated efforts on the part of data producers and sources for the public good is not without risk. It also presents
users from multiple data systems. It will also demand innovative institutional challenges: merging new data sources with traditional
ways to produce and apply data and statistics in addressing the ones requires the modernization of data governance and quality
multifaceted challenges of sustainable development. frameworks to ensure national ownership and the establishment
of transparent mechanisms. Such mechanisms allow partners from
the private sector, academia and civil society to contribute their data,
New approaches to capacity development expertise and technology to achieving the SDGs.
for better data
The scope of traditional statistical capacity-
Using innovative web-based technologies
building is widening to nurture collaboration
for health-data reporting
and synergies across increasingly
complex data systems. The goal now is to A growing number of countries are implementing routine
mainstream data innovations into official health information systems such as DHIS 2, a web-based facility
statistical production processes and focus reporting program developed by the World Health Organization.
atad retteb rof gnidliub yticapaC
more sharply on users’ needs. Efforts are This has been a game changer for health data, since it improves
also being made to ensure that statistical capacity-building initiatives real-time availability, use and analysis of facility-based statistics.
are home-grown, long-term, and generated and managed collectively Now in use in more than 50 countries, DHIS 2 is increasingly
by those who benefit from them. becoming the centralized health-data platform of choice. Over
Many countries are making strides in this direction. For example, the past year, partners in the Health Data Collaborative have also
following the launch of its second National Strategy for the been supporting the integration of disease-specific data (on HIV,
Development of Statistics in June 2016, Equatorial Guinea adopted tuberculosis and malaria programmes, among others) into DHIS
an Advanced Data Planning Tool (ADAPT). Its purpose is to facilitate 2, to replace the inefficient use of parallel reporting systems.
the budgeting and monitoring of development activities assigned to
key department heads, allowing for direct ownership and reporting
of progress. Similarly, in 2016, the heads of national statistical Leave no one behind
offices in 24 African countries participated in leadership training
National averages, even city averages, often mask wide disparities
that emphasized the importance of active leadership and change
among population groups. The identification of people suffering
management.
from deprivation therefore requires sufficiently detailed data across
multiple dimensions, including age, sex, geography and disability
Innovations and synergies across data ecosystems status, among others. Any global or national statistical system must
ensure that the coverage and level of data disaggregation for the
Increasingly, public-private partnerships are enabling the use of follow-up and review of the 2030 Agenda leaves no one behind.
big data and other non-traditional data sources in policymaking by
Towards this end, national statistical systems need to invest in the
mainstreaming their use in official statistics. This is made possible
technology and skills necessary to collect and integrate data from
through various institutional arrangements, including in-house
multiple sources, including integration of geospatial information with
production of statistics by data providers, direct transfer of private
statistics and other data. This means making better use of traditional
data to end users, the transfer of private data to a trusted third party
statistical surveys, censuses and administrative records. It also means
and the outsourcing of certain functions. It is crucial that national
harnessing the power of technology to leverage new sources of data,
statistical offices, supported by international organizations, continue
such as from cell phone records, Earth observations, other sensors
to advance the design and implementation of incentives and business
and social media. More citizen-generated data are also being used
models that encourage effective partnerships for improving the
to monitor the needs and progress of vulnerable groups. However,
availability and quality of data for sustainable development.
new methodologies need to be developed to ensure the quality and
reliability of such data.
14 The Sustainable Development Goals Report 2017In recent years, a number of initiatives have reviewed ways
Improving data on difficulties faced to possibly expand existing data principles and standards to
by children with disabilities non-traditional data sources, such as big data. The focus has been
on new data standards that would build upon existing ones to
Tools to collect robust and comparable data on the barriers
facilitate their adoption and rapid scale up among stakeholders
faced by persons with disabilities—and actions needed to help
from both public and private spheres.
them gain more equitable participation in society—remain in
short supply. In response, the United Nations Children's Fund
(UNICEF) and its partners released, in 2016, a new module
The way forward, starting in Cape Town
on child functioning for use in censuses and surveys, with the
aim of producing internationally comparable data. The module The first United Nations World Data Forum, held in January 2017 in
covers children between 2 and 17 years of age, and assesses Cape Town, South Africa, has led to the launch of a number of related
functional difficulties in the domains of communication, initiatives. It also provided a platform for the presentation and review
hearing, vision, learning, mobility and motor skills, behaviour of the Cape Town Global Action Plan for Sustainable Development
and emotions. Data. The plan was developed by members of the official statistical
system and other data communities, including civil society, the private
sector and academia; it was later adopted by the United Nations
Statistical Commission at its forty-eighth session. The plan provides
Understanding the world through data strategic guidance for the design and implementation of country-led
When properly designed, visual information statistical capacity-building needed to achieve the 2030 Agenda,
facilitates data exploration and processing and identifies six strategic areas for action listed below.
for evidence-based decision-making and
advocacy. Data visualization and storytelling
can connect users with data on sustainable
Understanding the world through data
development, enabling them to discover, Cape Town Global Action Plan for
understand, and communicate patterns and interrelationships in the Sustainable Development Data
wealth of data and statistics that are now available. Six strategic areas:
Today, there is an explosion of commercial and open-source f
fCoordination and strategic leadership on data for
frameworks and tools for data visualization. To take advantage sustainable development;
of them, national statistical systems need to engage with diverse
communities of data scientists and analysts ready to put their f
fInnovation and modernization of national statistical
expertise to the service of sustainable development. systems;
Data users also need help in making sense of the overwhelming f
fStrengthening of basic statistical activities and programmes;
volume of data and information they are presented with every
day. This can be accomplished by increasing collaboration across f
fData dissemination and use;
sectors and enhancing users’ skills. In addition, policymakers and f
fMulti-stakeholder partnerships;
the public in general must improve their data literacy. The National
Institute of Statistics of Rwanda and the Partnership in Statistics f
fResource mobilization and coordination.
for Development in the 21st Century (PARIS21), for example, The full text of the Cape Town Global Action Plan is available
are partnering to provide training to journalists from local radio, online at:
television, print and online media along with the Executive Secretary https://unstats.un.org/sdgs/hlg/Cape-Town-Global-Action-Plan.
of the Media High Council of Rwanda.
Data principles and governance
Data standards and best practices need to
evolve in parallel with available technology
and users' needs. Data developers and
users must therefore engage on an ongoing
Data principles and governance basis, recognizing the policy context for
the SDG data ecosystem. For instance, new open data management
frameworks are needed to foster innovation, while providing
continuity and facilitating interoperability among data providers,
managers and users.
Harnessing the power of data 15Goal 1: End poverty in all its forms everywhere
Giving people in every part of the world the support they need to
lift themselves out of poverty in all its manifestations is the very
essence of sustainable development. Goal 1 focuses on ending
poverty through interrelated strategies, including the promotion
of social protection systems, decent employment and the
resilience of the poor. Although the global rate of extreme poverty
has been reduced by more than half since 2000, intensified
efforts are required to boost the incomes, alleviate the suffering
and build the resilience of those still impoverished, particularly
in sub-Saharan Africa. Social protection systems need to be
expanded and risks mitigated for disaster-prone countries,
which tend to be among the world’s poorest countries.
Proportion of the population living below 1.90 US dollars a day, 1999 and 2013 Nearly a billion people have escaped extreme poverty
(percentage)
since 1999; three quarters of a billion remain in its grasp
57.7
Sub-Saharan Africa 8.5 42.3
44.3
The international poverty line is currently defined as 1.90 US dollars
Oceania* 27.2
37.5
per person per day using 2011 purchasing power parity (PPP). In 2013,
Central and Southern Asia 14.4 an estimated 767 million people lived under the poverty line, down
13.9
Latin America and the Caribbean 5.4 from 1.7 billion people in 1999. This represents a reduction in the
34.7
Eastern and South-Eastern Asia 3.2 global extreme poverty rate from 28 per cent in 1999 to 11 per cent
9.6
Northern Africa and Western Asia 2.6 in 2013. The fastest progress was observed in Eastern and South-
1.3
Australia and New Zealand 0.7 Eastern Asia, where 3 per cent of the population lived in extreme
1.8
Europe and Northern America 0.6 poverty in 2013, down from 35 per cent in 1999. Despite a decline in
28.0
the poverty rate in sub-Saharan Africa, 42 per cent of the population
World 10.7 continued to subsist in conditions of extreme poverty in 2013. In
0 20 40 60 fact, sub-Saharan Africa was home to about half of the world’s poor.
1999 2013 Combined with Southern Asia, the two regions accounted for over
Note: Oceania* refers to Oceania excluding Australia and New Zealand throughout 80 per cent of the world’s poorest people that year.
the publication.
Proportion of employed population living below 1.90 US dollars a day, Working poverty has decreased, but it is still
youth and adults, 2000 and 2016 (percentage)
pervasive in many regions and disproportionately
59
60
55 affects the young
53
50
44 45 Many of the world’s workers live in extreme poverty due to a lack
37 39
40
41 34 of decent work opportunities. Almost 10 per cent of the employed
31
30 33 26 population globally lived with their families on less than 1.90 US dollars
20
20
16 per person per day in 2016. While the percentage of the “working
15
16 8 10 poor” has been cut by more than half since 2000—when it stood at
10 6.4 3.7
11 4.1
8 0.6 0.2
9 28 per cent—it remains pervasive in a few regions. In sub-Saharan
5 6
0 3.8 3.4
0.3 0.2 Africa, 34 per cent of workers and their families continued to live
in extreme poverty in 2016. Working poverty affects youth at a
2000
2016
2000
2016
2000
2016
2000
2016
2000
2016
2000
2016
2000
2016
2000
2016
Sub-Saharan Central Oceania* Eastern Northern Latin Europe World
much higher rate than adults: in 2016, 15 per cent of young workers
Africa and and Africa and America and worldwide lived under the international poverty line, compared to
Southern South- Western and the Northern
Asia Eastern Asia Caribbean America 9 per cent of adult workers. This pattern holds true across almost all
Asia
regions.
Adults Youth
Note: “Adults” refers to persons aged 25 and above, “youth” refers to persons aged 15 to 24.
16 The Sustainable Development Goals Report 2017Less than half the world’s population are covered Proportion of population covered by at least one social protection benefit, 2016
by at least one social protection scheme (percentage)
Social protection systems have an important role in protecting the Sub-Saharan Africa 13
most vulnerable. They are fundamental to preventing and reducing Central and Southern Asia 16
poverty and inequality at every stage of people’s lives. Benefits for Eastern and South-Eastern Asia 59
children, mothers with newborns, persons with disabilities, older Latin America and the Caribbean 61
persons and those who are poor and without jobs help ensure
Australia and New Zealand 80
that no one is left behind. Preliminary data show that in 2016, only
Europe and Northern America 86
45 per cent of the world’s population were covered by at least one
social protection cash benefit, and that the proportion varied widely
World 45
across countries and regions. Sub-Saharan Africa had the lowest
coverage, with about 13 per cent of its population covered by at least 0 20 40 60 80 100
one social protection benefit, versus 86 per cent of the population in Note: Coverage corresponds to the sum of persons protected by contributory schemes and
recipients of contributory and non-contributory benefits expressed as a percentage of the
Europe and Northern America. total population. Northern Africa and Western Asia and Oceania* data are not shown due
to low population coverage of available data.
Social protection coverage varies widely by type Proportion of the world’s population covered by various social protection
floors/systems, 2016 (percentage)
of benefit, with many vulnerable groups left behind
In 2016, 68 per cent of people above retirement age received Unemployed 22
a pension. However, this global average masks large regional
differences. In sub-Saharan Africa, only 22 per cent of people above Persons with severe disabilities 28
retirement age received a pension in 2016, while in Europe and
Northern America, pension coverage is almost universal. Other Children 35
vulnerable groups also lack social protection. In 2016, only
22 per cent of the unemployed worldwide received unemployment Mothers with newborns 41
benefits, 28 per cent of people with severe disabilities collected a
disability pension, 35 per cent of children were covered by social Older persons 68
protection, and 41 per cent of women giving birth received maternity
benefits. 0 20 40 60 80
Probabilistic models show that small island developing Average Annual Loss in relation to 2013 GDP (percentage)
States are expected to bear disproportionately large
Least developed countries 0.85
economic losses attributed to disasters
Building the resilience of the poor and strengthening disaster risk Landlocked developing countries 0.42
reduction are key strategies for ending extreme poverty in the most
afflicted countries. Economic losses from natural hazards are now Small island developing States 1.72
reaching an average of 250 billion to 300 billion US dollars a year.
Based on estimated future loss—as measured by Average Annual Loss
(AAL)—the largest losses will be concentrated in bigger economies. World 0.38
However, smaller and more vulnerable countries, particularly the
small island developing States, will bear a disproportionate impact in 0.0 0.3 0.6 0.9 1.2 1.5 1.8
relation to the size of their economies. More efforts should be made to Note: Average Annual Loss is the expected (i.e., future) economic loss value normalized in annual
terms considering all potential occurrence (both severity and frequency) of natural hazards
promote disaster risk reduction, particularly in these most vulnerable (earthquakes, cyclonic wind, storm surges and tsunamis) over a long time frame using
countries. probabilistic hazard models.
Goal 1 | No poverty 17You can also read