Solar Lighting for the Base of the Pyramid - Overview of an Emerging Market
←
→
Page content transcription
If your browser does not render page correctly, please read the page content below
Solar Lighting for the Base of the Pyramid
   - Overview of an Emerging Market -
02              Off-grid lighting for the
    October 2010       Base of the Pyramid

Authors
This report presents an overview of current and projected market trends for off-grid lighting.
It was commissioned and coordinated by Lighting Africa, a joint initiative from IFC and the World Bank and prepared by Dalberg Global Development Advisors
(www.dalberg.com)
Lighting Africa website: www.lightingafrica.org
Email contact address for Lighting Africa : support@lightingafrica.org

Lighting Africa is implemented in partnership with:
The Africa Renewable Energy and Access Grants Program (AFREA) •The Asia Sustainable and Alternative Energy Program (ASTAE) • The Energy Sector Management
Assistance Program (ESMAP) • The Global Environment Facility (GEF) • Good Energies Inc. • Italy • Luxembourg • The Netherlands • Norway • The Public-Private
Infrastructure Advisory Facility (PPIAF) • The Renewable Energy and Energy Efficiency Partnership (REEEP) • The United States.
Off-grid lighting for the       03
                                                                                                                     Base of the Pyramid     October 2010

                                                Acknowledgements
This report presents an overview of current and projected market trends for off-grid lighting. It was commissioned and coordinated by Lighting Africa,
a joint initiative from IFC and the World Bank.
The report provides a snapshot of the off-grid lighting market and provides industry-level data and analysis on key trends. It relies on the inputs of a
broad range of industry experts, manufacturers, distributors, scientists, market researchers, and NGO leaders worldwide who contributed their views,
time, and advice to the preparation of this document. This included interviews with over 70 solar market players in 10 African markets, and a range
of lighting product manufacturers worldwide. The report will be updated every two years.
The insights and input of many people and organizations were invaluable in the production of this report. Lighting Africa would like to thank all
those who contributed to its production.
The report was prepared by Dalberg Global Development Advisors, most notably Mr. Edwin Macharia, Partner, located in Nairobi, Kenya, Mr.
Gaurav Gupta, Associate Partner and Mr. Michael Tsan, Project Manager based in Mumbai, India. We also want to acknowledge the role played
by Dalberg consultants and researchers worldwide who conducted the market survey interviews and desk research that were an integral part of
this report. In this regard, we would like to acknowledge Mr. Chris Denny-Brown, Ms. Antara Ganguli, and Ms. Nupur Kapoor, in Mumbai, India;
Ms. Bilha Ndirangu and Ms. Roseline Njogu in Nairobi, Kenya; and Mr. Mallé Ibn Aboubakry Fofana in Dakar, Senegal. Additionally, we want to
recognize Dalberg advisors Ms. Katie Hill, Mr. Daniel K. Rubia, and Mr. Justin Guay.
Finally, our appreciation goes to the Lighting Africa team members who provided useful market research input, research support, guidance, and
feedback throughout the process.
We welcome your feedback and support in this effort and encourage you to reach out to the Lighting Africa team with your questions and feedback
through www.lightingafrica.org.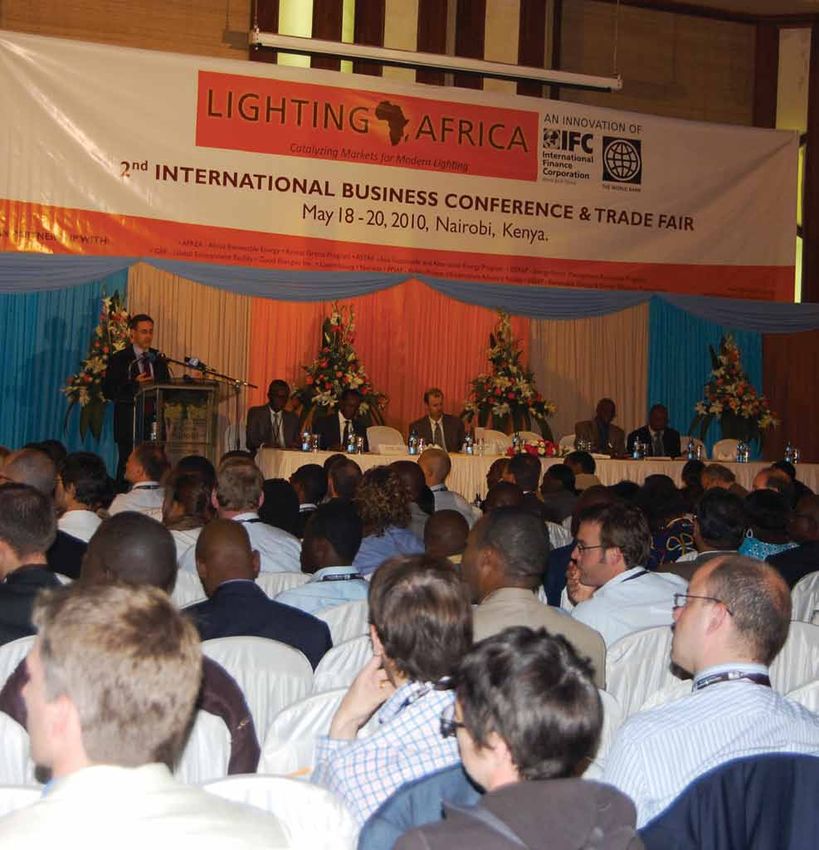
04 Off-grid lighting for the
October 2010 Base of the Pyramid
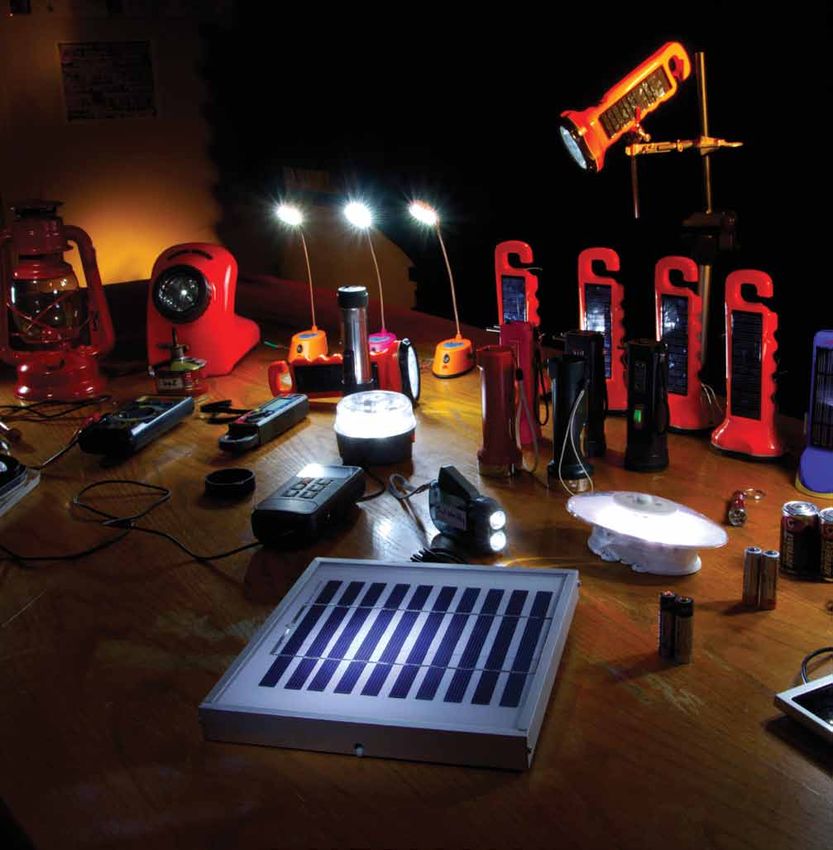
A selection of lighting products.
© Kellie Brown, Humboldt State University.
Off-grid lighting for the         05
                                                                            Base of the Pyramid     October 2010

               Contents
            Authors                                                                                   2

           List of Figures                                                                            6

           List of Abbreviations                                                                      7

          Lighting Africa                                                                             9

         Scope                                                                                        9

         Executive Summary                                                                          10

        The Lighting Imperative                                                                     14

        Understanding the Product Range                                                             18

      Global Industry Trends and Projections – market size and demand                               21

     Global Industry Trends and Projections – supply and distribution                               34

     The Africa Scenario – market size                                                              43

    Africa-specific demand drivers                                                                  50

   2015 Africa forecast                                                                             58

   Challenges To Scaling Up in Africa                                                               62

  Addressing Challenges To Scaling Up                                                               67

 An alternate ending                                                                                72

 Conclusion                                                                                         73

Annex                                                                                               74

Bibliography                                                                                        77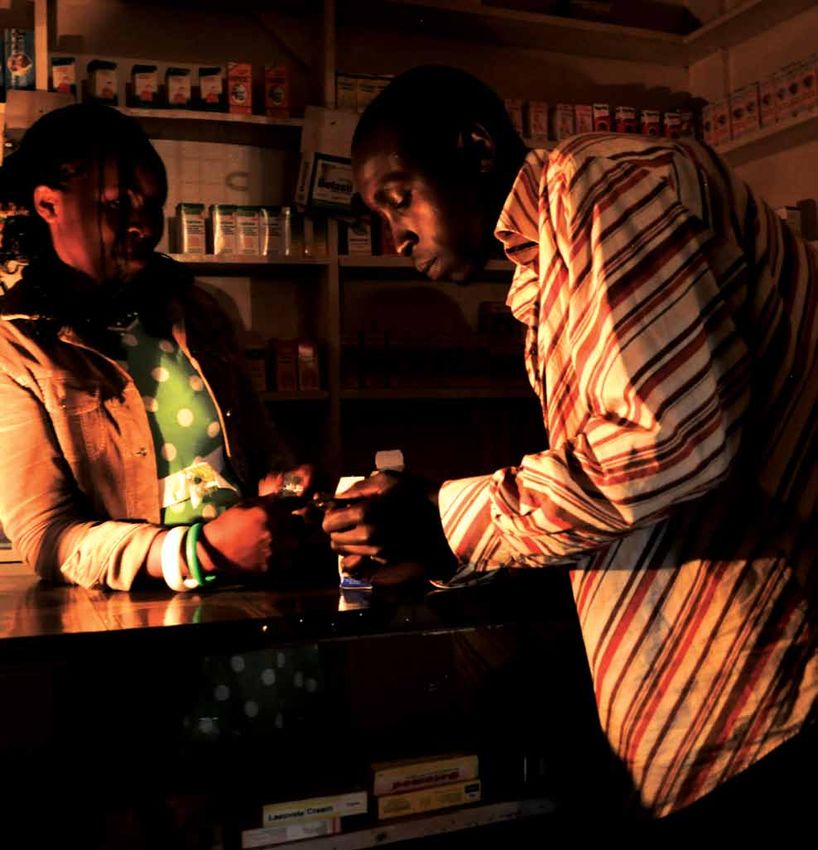
06            Off-grid lighting for the
   October 2010    Base of the Pyramid

List of Figures
FIGURE 1:   AWARENESS ON SOLAR PORTABLE LIGHTING PRODUCTS                                 10
FIGURE 2:   SOLAR PORTABLE LIGHTING PRODUCT LANDSCAPE                                     18
FIGURE 3:   SOLAR PORTABLE LIGHT TECHNOLOGY OPTIONS                                       19
FIGURE 4:   SOLAR PORTABLE LIGHT PERFORMANCE MATRIX                                       20
FIGURE 5:   ELECTRIFICATION RATES AROUND THE GLOBE                                        21
FIGURE 6:   FORECAST FOR GLOBAL UN-ELECTRIFIED POPULATIONS                                22
FIGURE 7:   LARGE RURAL POPULATIONS FACING HIGH ENERGY COSTS ARE HIGH POTENTIAL MARKETS   22
FIGURE 8:   DECOMPOSITION AND FORECAST OF TODAY’S MEDIAN LANTERN’S COMPONENT COSTS        24
FIGURE 9:   LINKS BETWEEN SOLAR PV PRICE AND POLYSILICON                                  25
FIGURE 10: FORECAST FOR SOLAR PV PANEL PRICE TRENDS                                       25
FIGURE 11: BATTERY TECHNOLOGY OPTIONS                                                     26
FIGURE 12: SPL BATTERY PRICE FORECAST (2009-2015)                                         27
FIGURE 13: SPL DEVICE BATTERY SHARE - A POTENTIAL SCENARIO                                27
FIGURE 14: LED PRICE FORECAST                                                             28
FIGURE 15: SPL MANUFACTURING COST FORECAST                                                29
FIGURE 16: LANTERN PAYBACK PERIOD SCENARIOS                                               29
FIGURE 17: TODAY’S CAPITAL COSTS WILL BUY MUCH MORE “LANTERN” TOMORROW                    30
FIGURE 18: FORECAST ON LED EFFICIENCY                                                     31
FIGURE 19: SPL ACCESSORY OVERVIEW                                                         32
FIGURE 20: SOLAR PORTABLE LIGHT MANUFACTURE AND SALES BY GEOGRAPHY                        34
FIGURE 21: MARKET SHARE FOR SPL PLAYERS                                                   35
FIGURE 22: DISTINCTIONS BETWEEN THE 5 MAJOR SPL DISTRIBUTION MODELS                       36
FIGURE 23: COMMON DISTRIBUTION MODELS                                                     36
FIGURE 24: DISTRIBUTION THROUGH AFRICAN MFIS                                              39
FIGURE 25: DISTRIBUTION MODEL FIT BASED ON INDUSTRY CHARACTERISTICS                       41
FIGURE 26: ELECTRIFICATION RATES ACROSS AFRICA                                            43
FIGURE 27: AFRICA OFF-GRID MARKETS RANKED BY SIZE                                         43
FIGURE 28: AFRICA MARKET PRIORITIZATION – GRID GROWTH VS. KEROSENE PRICE                  44
FIGURE 29: THE AFRICAN “UNDER-ELECTRIFIED” CONSUMER                                       45
FIGURE 30: GRID UNRELIABILITY – MONTHLY POWER OUTAGES BY COUNTRY                          46
FIGURE 31: CURRENT SPEND ON LIGHTING BY BOP HOUSEHOLDS AND SMES                           47
FIGURE 32: PRIMARY LIGHT SOURCE BY NUMBER OF USERS AND ANNUAL SPEND                       47
FIGURE 33: SOLAR HOUSEHOLD LIGHTING PENETRATION IN 2009-2010                              48
FIGURE 34: PROJECTED OFF-GRID POPULATION (2010-2015)                                      50
FIGURE 35: AFRICA SOLAR LANTERN VALUE CHAIN                                               51
FIGURE 36: AFRICA VS. INDIA LANTERN VALUE CHAIN COMPARISON                                52
FIGURE 37: KEROSENE PRICES ACROSS AFRICA                                                  53
FIGURE 38: KEROSENE PRICE TREND                                                           54
FIGURE 39: MOBILE PENETRATION AS A POTENTIAL ENGINE FOR SPL GROWTH                        55
FIGURE 40: MOBILE PENETRATION VERSUS GRID GROWTH IN KENYA                                 55
Off-grid lighting for the      07
                                                                                                      Base of the Pyramid     October 2010

FIGURE 41: OFF-GRID PHONE CHARGING OPTIONS                                                                      56
FIGURE 42: SPL MARKET GROWTH SCENARIOS                                                                          58
FIGURE 43: REPLACEMENT AND UPSELLING MARKET FOR SPLS                                                            59
FIGURE 44: MARKET FORECAST - CONSERVATIVE SCENARIO                                                              59
FIGURE 45: SPL MARKET FORECAST FOR 2015 - LIKLEY SCENARIO                                                       60
FIGURE 46: VOICE OF DISTRIBUTORS/SELLERS – MAIN SPL MARKET CHALLENGES IN AFRICA                                 62
FIGURE 47: TAXES AND TARIFFS ON SPL IN SELECT GEOGRAPHIES                                                       64
FIGURE 48: CONSUMER WILLINGNESS TO PAY INCREASES WITH PRODUCT EXPOSURE                                          65
FIGURE 49: SOLAR HOME SYSTEM (SHS) SALES IN AFRICA                                                              74
FIGURE 50: SHS SALES HISTORICAL GROWTH (2000-2009)                                                              75
FIGURE 51: SOLAR MARKET SEGMENTATION - GMENVS. SPL                                                              76

List of Abbreviations                                            MWp – Megawatt peak
a-Si – Amorphous Silicone                                        NGO – Non-governmental organization
BOP – Base of Pyramid (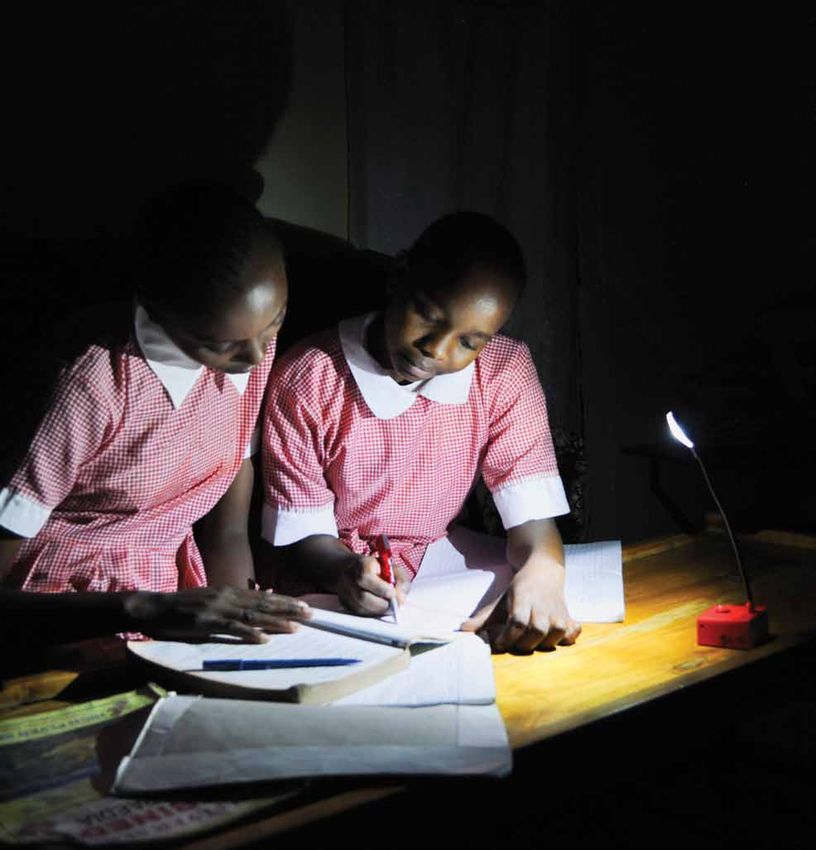
08              Off-grid lighting for the
           October 2010       Base of the Pyramid

The Second Lighting Africa International Business Conference and Trade Fair brought together 600 participants and exhibitors from over 50 countries.
© Jamie Seno/Lighting Africa/2010.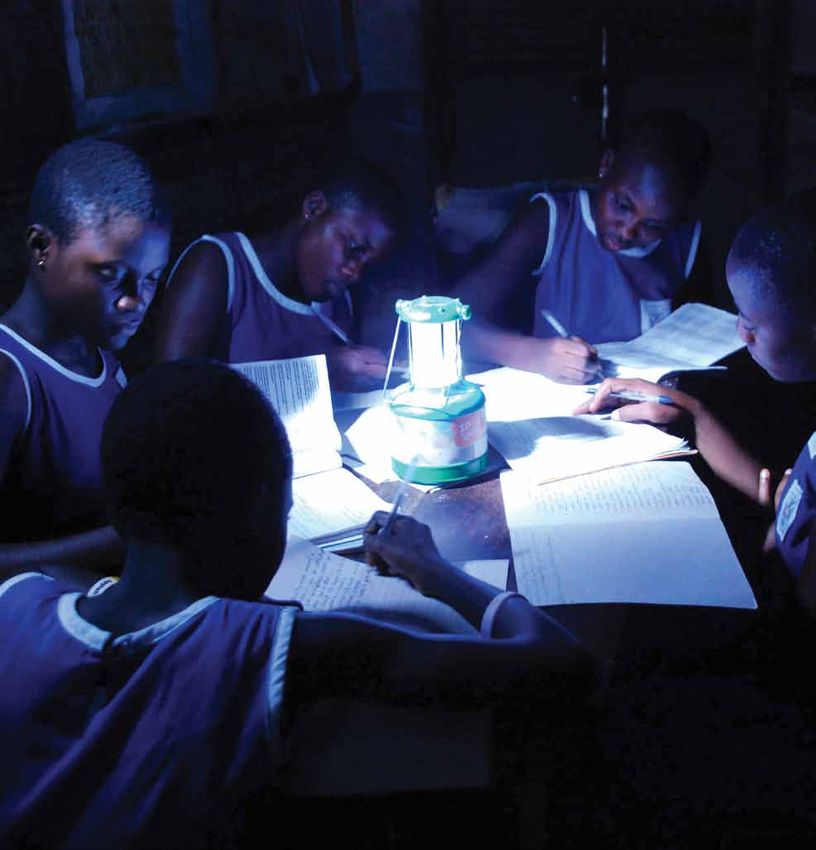
Off-grid lighting for the       09
                                                                                                                              Base of the Pyramid     October 2010

Lighting Africa
Lighting Africa, a joint IFC and World Bank program, seeks to accelerate the development of commercial off-grid lighting markets in Sub-Saharan Africa as part
of the World Bank Group’s wider efforts to improve access to energy. Lighting Africa is helping mobilize the private sector to build sustainable markets to provide
2.5 million people with safe, affordable, and modern off-grid lighting by 2012. The longer-term goal is to eliminate market barriers for the private sector to reach
250 million people in Africa without electricity, and using fuel based lighting, by 2030. Improved lighting provides significant socio-economic, health and
environmental benefits such as new income generation opportunities for small businesses. Lighting Africa is a key element of the global Solar and LED Energy
Access (SLED) program, an initiative of the Clean Energy Ministerial.
For more information, please visit http://www.lightingafrica.org

Purpose of this Report
A key component of the Lighting Africa landscape is the market for solar portable lights, which covers a range of lighting needs from individual tasks to general
household lighting.
This report presents a snapshot of this market and provides industry-level data and analysis on key trends. Excerpts from this report were used to establish a
common foundation for the discussions at the Lighting Africa conference on May 18-20, 2010, and the full document is designed to be a reference point for future
fact-based analysis of the market opportunities for off-grid lighting.
It should be noted that Lighting Africa is technology-neutral, but has assembled this report with a focus on solar-based lighting products, as this is a dominant and
fast-growing sector of the off-grid market deserving lighting industry, donor, and private sector investor attention.
The report relies on the input of a broad range of industry experts, manufacturers, distributors, and NGOs, including interviews with over 70 solar market players
in 10 African markets and a dozen lighting product manufacturers worldwide. It will be updated every two years. We welcome your feedback and support in this
effort and encourage you to reach out to the Lighting Africa team with your questions and feedback.

Scope
Off-grid lighting is a dynamic and growing market with a spectrum of products and business models. For the purposes of this report, we have chosen to focus
on an important cross-section of the market that we term “solar portable lights” (SPL) – this market has been referred to as “pico-solar” in some reports or, more
generically, “solar lanterns” in earlier industry and development agency literature. We define the SPL market on the basis of function, technology and quality.
Hence the scope of this report is defined within the following factors:
    Function - Solar-powered lighting systems that range from the task specific (torches/flashlights) to the general ambient lighting functions of solar lanterns. These
    products can include added functions such as mobile phone charging, but light has to be the primary design driver. The functionality also has to allow easy
    portability and therefore is distinct from the solar home system market.
    Technology - The light – typically LED-based, though many products still feature CFL bulbs – has to be rechargeable and must be powered by a solar cell
    (although not necessarily exclusively), that is integrated or is a stand-alone panel. Devices with non-solar charging functionality are included in the study, for
    instance lanterns that can be recharged from the grid or a car battery, but a solar panel also has to be part of the package. Given the portability factor, the solar
    panel size is restricted to 10 watts and below. Dynamo (e.g., hand crank) technology is also an option worth considering, however its use at present is limited
    and we have chosen to restrict the report to solar devices.
    Quality - Recognizing the emerging issue of market spoilage from poor quality products, our analysis excludes ultra-cheap (typically battery-powered, non-
    solar) LED torches/flashlights ($1-10), which have experienced substantial sales over the past few years in Africa. The focus of this report is on products that meet
    basic quality standards (e.g., sufficiently long life and light intensity) to meet the needs of Africa’s un-electrified households.1
The above criteria represent a robust space of quality solar products that are a market-ready opportunity for meeting the lighting needs of today’s off-grid rural
and urban consumers. These products have momentum and are reaching a tipping point in a number of African markets which justifies focused study and effort in
commercializing their use.

1
See Lighting Africa Quality Test Procedures for details on relevant quality standards.
http://www.lightingafrica.org/files/LED_Lighting_TestProcedures_Draft_FISE_Aug09.pdf
010               Off-grid lighting for the
    October 2010        Base of the Pyramid

Executive Summary
The solar portable light (SPL) market is poised for rapid growth over the next five years.
In its initial phase, the Base of Pyramid (BOP) lighting market was characterized by larger solar PV systems, such as Solar Home Systems (SHS), that have been
marketed commercially in countries like Kenya and Tanzania, used to provide fee-for-service electricity services in markets like South Africa, and also supported by
many donors as an option for off-grid electrification across the continent. Additionally, the market featured a handful of technologically immature and expensive
SPL CFL products often unsuited to the African consumer and a growing array of low cost, low quality LED products retailed commercially at $1-10 each and
primarily powered by disposable batteries.
While donor-based models remain and SHS are still an important and growing segment, the lighting market has now entered a new growth phase that is being led
by SPL entrepreneurs, often relying purely on market-based models, utilizing the latest technology and designing based on consumer tastes.
Yet, scale remains small, price – even though it has dropped significantly over the past few years – is still a barrier, the technology and product build quality have
space to improve, and the vast majority of customers still need to be reached.
The next five years will see the market will reach the inflection point of its growth curve. The community at large is starting to take a significant interest in this
market (Figure 1). Technology is improving at a rapid rate, business models are maturing, and the focus by industry players and market facilitators on addressing
key market failures means that the SPL market is ready for a substantial inflow of private sector investment and exponential growth.

                                                                     Increasing media awareness on solar lanterns
                                                                     Unique hits
                                   News items, blog entries, books
                                   and forum discussions

                                                                           2005 - 2006

                                                                                         2006 - 2007

                                                                                                       2007 - 2008

                                                                                                                     2008 - 2009

                                                                                                                                   2009 - 2010

 Source: Google tools; Dalberg analysis

Figure 1: Awareness on Solar Portable Lighting products
Off-grid lighting for the 011
Base of the Pyramid October 2010
Africa is a key geography for solar portable lights today and is set to grow quickly:
• While the rest of the world will begin to increase electrification levels, if we use historical grid growth rates, Africa’s non-electrified population will in fact grow
from 110 million households to 120 million households and over 10 million small businesses (630 million people) and over 10 million small businesses by
2015. African grid expansion is failing to keep pace with population growth.
• Even the on-grid customers (60 million African households in 2008) presents an opportunity. Intermittency and low quality of grid supply affects at least a third
and, in some African geographies, the vast majority of this group, constituting over 20 million “under-electrified” households.
• Conservative assumptions suggest that the African market for off-grid renewable lighting will experience exceptional growth. Based on current growth trends,
the market will easily experience 40-50% annual sales growth, and 5-6 million African households will own solar portable lights by 2015. This contrasts
strongly with the over 600k SPLs that have been sold into the African market to date over the past five years. As noted earlier, these numbers exclude poor
quality battery-powered LED torches (many in the $1-10 range), whose sales are in the millions.
• However, we do not expect ‘business as usual’ to be the likely scenario. Many new quality oriented players are entering the market and substantial investments
are being made to correct for market failures. Should many of the challenges identified in the report be met and likely external factors come into play (e.g.
innovation in distribution and access to finance models, large increases in kerosene costs, policy changes on taxes and tariffs), the SPL market will far exceed
the business as usual scenario and see annual sales growth rates closer to those seen by the mobile phone market in Africa of over 65%. This could mean
nearly 12 million SPLs owned by African households and SMEs by 2015.
• There is no way to quantify and contain pure entrepreneurial drive and innovation and hence we also recognize that if certain technological advancements
are brought forward, innovations around distribution are scaled up, consumers are better educated about quality lighting products, and successful access to
finance programs come into play (e.g., entry of multiple financing intermediaries to reduce access to finance bottlenecks and provide easier access to CDM),
this market could grow at a multiple of the scenarios we describe in the report.
SPL products set to align more strongly with the needs of this market:
• Rapidly declining manufactured price and payback period: Sharp decreases in the price of solar components, LEDs, and batteries will mean that off-grid
products will become significantly more affordable and erode the upfront cost advantage that kerosene has today. We predict an over 40% drop in the global
manufactured costs of today’s median lantern within 5 years, with a corresponding decline in payback period from eight to five or as little as two months for
the average consumer, depending on distribution economics and CDM market potential.
• Kerosene unaffordability will further help drive demand: Ongoing increases in base kerosene prices, estimated at 4% annually increase over the next few
years, combined with increasingly expensive to maintain subsidy regimes mean that kerosene will continue to lose its appeal.
• Technological improvement will mean more and better light: Along with a decline in price, the market will see a corresponding rise in effectiveness and
quality. At today’s cost, the solar portable light of 2015 will deliver better quality of build, lighter weight, longer-lasting and environmentally cleaner battery
power, a more durable solar panel, and most important brighter light– , 2-3 times the equivalent products of today.
• Consumer will be King: Design is as important a need as the amount of light delivered by a SPL. Like many other retail products, the winning players in the
market will increasingly be those that can design “design based on the needs of the end-consumer with consumer-orientated features like a more durable
and adaptable form factor, charge indicators to prolong battery life, and mobile charging ability, which already is being seen as a killer feature. Our research
suggests that there is no one “true” solution for the market but a variety of models for satisfying the needs of very different consumers (e.g., peri-urban back up
power users vs. remote rural households vs. small businesses with specific lighting needs).
Significant challenges remain in the African marketplace for realizing full potential:
• Access to finance bottlenecks exist both at the distributor end, through lack of credit for business expansion, and at the end-customer point of the value chain,
due to high upfront costs of SPL devices.
• Distributing and servicing effectively is difficult – the markets with greatest need for SPL products are typically the most uneconomic to reach. The market is
still at an early stage in identifying scale distribution models that don’t entail prohibitive costs.
• High taxes/tariffs on SPL products still characterize, many African geographies and even in geographies where solar products are exempted from duties the
difficult-to-navigate exemption and bureaucracy continue to impose costs on distributors and importers.012 Off-grid lighting for the
October 2010 Base of the Pyramid
• Growing problem of market spoilage due to sales of low-quality LED lighting products (including low-quality solar lanterns) with endemic mislabeling,
counterfeiting, and durability issues.
• Lack of consumer education with majority of African consumers having limited awareness of the health, environmental, and economic advantages of solar
lights over traditional fuels.
Solutions are on the horizon, but will require concerted investment and coordination:
• Innovative financing for consumers and other efforts to reduce product costs: While the forecasted reduction in SPL manufacturing costs will translate
into lower prices and a dramatically larger market, cost will continue to be an issue for the poorest African consumers. Access to finance innovation across
the value chain will therefore be a key enabler for growth. Additionally, market experiments to drive down the price of SPLs – for example, through scaled
distribution partnerships – could play an important role in increasing affordability.
• Distribution will evolve: Over the next five years multiple distribution models will continue to survive, but industry leaders will consolidate around a few
tested approaches, with greater concentration of market share as they find ways of accessing last mile retailers (e.g., village kiosks) through existing distribution
channels, partnering with MFIs, SACCOs, NGOs, and the private sector (e.g., mobile providers), and using other aggregation points (e.g., unions, agricultural
cooperatives) to deliver solar portable lights at scale.
• Relaxation of taxes and tariffs on solar technology through regulatory reform: A number of African markets have already reduced or eliminated such tariffs
(e.g., Kenya, Tanzania, Ethiopia, Uganda), but a great deal more engagement is needed in other geographies and further simplification of bureaucratic obstacles
is required in countries where exemptions are in place.
• Market spoilage and quality certification: market spoilage can be addressed through the growth of quality testing and certification programs at the national
level, but well funded and heavily promoted region-wide product quality testing solutions will be necessary to reduce information asymmetries for consumers
and improve the quality of existing products by providing vital feedback to manufacturers.
• Consumer education: consumer education will to some extent occur naturally as more Africans become exposed to higher quality solar portable lighting
products over the next fewyears, with evidence on the ground that willingness to pay for quality SPLs increases as much as fivefold with experience. Nonetheless,
government and the social sector have an important role to play in continuing to educate the public about the benefits of solar lighting, the improving quality
of SPL devices, and the harms of traditional fuels.
Ultimately, market and product evolution entailing both increased quality and reduced costs will be the largest driver of the coming growth. However,
addressing the key market failures above – preferably, without distortionary subsidies by the donor and NGO communities – will bring the market growth
forward by several years and allow deeper penetration of the market to those most in need.
To this end, Lighting Africa has a comprehensive set of programs and initiatives in place to address the challenge areas described above with the ambition of:
• Catalyzing the private sector, including strengthening ties between the international lighting industry and local suppliers and service providers to profitably
manufacture, market, and distribute significantly lower cost products.
• Facilitating consumer access to a range of affordable, reliable, and high-quality lighting products and services - for example, by providing consumer
education services and consumer finance, and by executing a product quality assurance program.
• Improving market conditions for the scale-up of modern lighting products by reducing existing technical, financial, policy, information, and institutional
barriers. This includes the development of methods for obtaining CDM credits for distributed lighting.
• Mobilizing the international community - governments, private sector, international organizations and NGOs - to aggressively promote the use of modern
lighting services for the poor in Africa.
Over the next five years Lighting Africa will continue to build on its mission as the regional platform for market facilitation to address these gaps and bring light
to the millions of Africans who need it.Off-grid lighting for the 013
Base of the Pyramid October 2010
© Jamie Seno/Lighting Africa/2010.014 Off-grid lighting for the
October 2010 Base of the Pyramid
The Lighting Imperative
The social and economic impact of providing clean, safe lighting has been well documented. It has recently gained renewed focus from investments in renewable
technologies and concerns raised by emissions from traditional fossil fuel and biomass sources of light. This report cannot do justice to the extensive literature and
will instead seek to highlight and summarize the main social imperatives that are driving the interest in off-grid lighting.
Approximately 1.6 billion people in the world live without electricity.2 The ramifications of this are profound. A lack of reliable lighting access limits the productivity
of nearly a quarter of the world’s population, hindering their ability to carry out basic activities at night or in the early morning, including household chores, reading
and completing schoolwork, and conducting business. Given the slow growth of electrification, the global lighting crisis increasingly separates those with reliable
lighting from those who lack it, further leaving a substantial proportion of the world’s population further behind.
Africa accounts for a major share of the un-electrified. Our research suggests that of the approximately 110 million off-grid households across Africa (encompassing
580 million individuals), more than half employ kerosene lamps as their primary light source, with many needing several sources to fill their lighting needs. Other
non-renewable off-grid alternatives include candles, biofuels like wood, animal dung, and crop waste, battery powered light devices, and diesel generators for the
very richest households and small businesses. These traditional lighting alternatives are typically expensive and often both dangerous and environmentally harmful.
A growing body of research has examined the many negative impacts incurred by the use of these lighting options, particularly kerosene. Grid expansion is a vital
objective and will be a long-term solution for many African households, but for the majority, grid growth will take decades and many of the benefits of better lighting
can and should be captured today through renewable solar light products.
We outline a few of the major impact areas from replacing traditional lighting fuels by high-quality renewable solar lighting below:
Impact on the Environment: The cumulative effect of 1.6 billion people using kerosene and other biofuels for lighting contributes heavily to global carbon
emissions although it is important to recognize that on a per capita basis, these people remain at the bottom of the spectrum of CO2 emitters. The most commonly
cited estimate of total official household and commercial consumption of kerosene worldwide is 440 million barrels of oil per year (IEA 2007), releasing 190
million tons of CO2 into the atmosphere annually, an equivalent of 30 million cars3 and an amount greater than Australia and the UK combined.4 Use of kerosene
for lighting likely accounts for well over half (100-150 million tons) of these CO2 emissions.
Beyond the direct impacts of such CO2 emissions, a nascent set of science on climate change which looks at the impact of Black Carbon, formed from incomplete
combustion of fossil and bio-fuels and also commonly referred to as soot, has suggested that such emissions from kerosene and bio-fuel burning, could be a major
source of warming in the lower atmosphere and play a strong role in melting of glacial regions. The science on this varies widely, with reports claiming that black
carbon is responsible for anywhere from 5% to 50% of the warming caused by CO2 alone.5 Furthermore, the blackening effect of soot, which can be deposited on
glaciers, also accelerates the warming process in those regions due to a lowering of the reflectivity of the ice (the “albedo” effect). The exact magnitude of impacts
remains heavily in debate, but consensus is forming that the impact is significant and deserves serious attention.
Assuming that Africa’s share of kerosene-based CO2 emissions is roughly equivalent to its share of the worldwide off-grid population, the continent’s households
and small businesses account for at least 30% of this total, or 30-50 million tons of CO2 annually. Using conservative bottom-up assumptions we estimate that
Base of Pyramid (“BOP”) African households6 account for at least 20 million tons of these kerosene-linked CO2 emissions, with the balance due to kerosene use
by businesses and non-BOP households as well as differences in estimation methodology.
Kerosene CO2 emissions assumptions and methodology
Our assumptions appear below to facilitate comparison with estimates in the literature:
• Kerosene CO2 emissions factor – according to commonly accepted estimates kerosene emits approximately 2.5kg of CO2 per liter
• Kerosene use per household – we assume an average of 5 liters monthly per BOP household leading to 150kg of household CO2 emissions a year. The actual
range on household kerosne use is wide with a review of 28 surveys from across the globe showing a variation from 3 to 30 liters per month of lighting fuel use.
Our estimate draws on Lighting Africa market research on off-grid populations in five African countries and equates to the use of one kerosene wick lamp or two
relatively more efficient kerosene hurricane lamps for 3-4 hours daily.
• Number of households – we estimate 110 million African off-grid households and 20 million on-grid households with very poor-quality grid connections and
consequent reliance on fuel-based lighting
2 5
World Bank (2009) Ramanathan, V. (2008); see also J. Hansen, et al. (2005)
3 6
Mills (2005), Mills (2010), United States Environmental Protection Agency (2010) $3000 BOP cut-off
4
Radecksy (2009)Off-grid lighting for the 015
Base of the Pyramid October 2010
Further research is needed on the African off-grid household’s CO2 footprint – the above numbers do not measure the impact of non-kerosene bio-fuels like wood,
for example, which is likely to be very substantial. What is beyond debate and more important than the exact size of fuel-based CO2 emissions is the fact that these
emissions are absolutely unnecessary in view of cheaper and safer solar renewable lighting alternatives.
Beyond CO2 emissions, another source of negative environmental impact from traditional lighting is the large volume of toxic solid battery waste generated
annually from the extensive use of incandescent-based flashlights on the continent. Hundreds of millions of dry-cell batteries are sold annually in Africa for lighting
purposes,7 with the vast majority inappropriately disposed and leading to water source contamination and other downstream problems. The usage of more efficient
lighting products should contribute to reduced levels of battery usage and the abatement of related environmental issues if appropriate SPL rechargeable battery
technologies are utilized.8
Impact on Health: The health implications of fuel-based lighting are two-fold: chronic illness due to indoor air pollution and risk of injury due to the flammable
nature of the fuels used.
Kerosene lamps emit fine particles that are a major source of air pollution because they quickly become lodged in the bronchial system and can result in chronic
disease and death. Burning a liter of kerosene emits 51 micrograms of PM10 9 per hour, which is just above the World Health Organization 24-hour mean PM10
standard of 50 micrograms per cubic meter. Since these particles may not disperse easily in the close quarters of a typical BOP household or small business,
burning a lamp indoors for just four hours can result in concentrations of toxic particles several times higher than the World Health Organization standard.10 A
recent study estimates that an employee working in a Kenyan small business with a wick kerosene lamp may experience PM2.5 levels of 250 micrograms per cubic
meter, seven times the EPA 24-hour limit and 17 times the EPA annual limit.11 Another study estimates that individuals breathing particulate-laden kerosene fumes
inhale the toxic equivalent of smoke from two packs of cigarettes a day.12 While conclusive studies on the health impact of this kerosene exposure are largely
anecdotal, the research suggests that kerosene fumes cause serious health issues, including asthma, bronchitis, tuberculosis, heart disease and lung cancer.13
In addition to toxic fumes from kerosene lamps, the danger of the hazard of fire and ensuing risk to life and property is substantial. In India alone, 2.5 million
people suffer severe burns due to overturned kerosene lamps annually.14 A study conducted in Benin between 2002 and 2006 by the University of Benin showed
that more than 50% of burn victims brought into hospitals were victims of fires caused by overturned kerosene lamps.15 Similarly, a Nigerian study has concluded
that thousands of Nigerians are maimed each year by kerosene lamp explosions, with a 13% fatality rate in such incidents.16
Impact on income generating activity: Several studies in developing countries show that access to proper lighting (of high enough illumination to enable reading
and doing household and business-related activities) has significant positive impact on productivity broadly and income-generating activity specifically.17
For many rural households, for instance, obtaining fuel for lighting can be a time-consuming task that requires traveling long distances and is often undertaken
by women and children, reducing women’s available time for income-generating activities.18 Research on solar home systems has demonstrated that poor Indian
households that operate small cottage industries increased their income by using light to extend their productive hours after nightfall. More research is needed
on the specific impact of solar portable lights on household income generating activities, but the emerging evidence is promising. In a recent Malawi study of a
solar lantern project, ten percent of lantern buyers – many in very low income brackets – noted that the lantern had provided expanded business opportunities by
allowing more time to work at night.19 Similarly, recent Dalberg and SEWA research in rural Bihar and Gujarat in India suggests that solar lanterns contribute to
longer working hours for occupational groups ranging from traditional handicraft artisans, to textile workers, and livestock herders.
An important productivity effect of portable solar lighting will also likely be seen with off-grid rural and urban small businesses. Prior Lighting Africa research in
countries like Kenya suggesting that African businesses would stay open longer if the insecurity and lack of customers were not a factor due to poor illumination. 20
More broadly, there is an established positive correlation between the quality of the lighting in commercial enterprises and retail sales. Research has shown that the
move from kerosene to LED based lighting that improves the quality of illumination also boosts sales since customers pay more attention to the display and engage
in purchase-oriented behaviors more often.21 The Lighting Research Center of Rensselaer Polytechnic Institute has found that customers who could see color more
accurately, found products more visually appealing, and had an increased preference for a product display lit by WLEDs, compared to traditional lighting.
7
Lighting Africa (2008)
8
Many SPL still feature lead acid and NiCd rechargeable batteries that are worse than disposable dry cells; NiMh and L-ion batteries, which are becoming the SPL industry standard, have much less toxicity
9
Particulate matter with an aerodynamic diameter less than 10 microns
10
The Welfare Impact of Electrification, World Bank
11
Poppendieck and Jacobson (2009)
12
Lights for Life (2010)
13
US National Institute of Health (2009); see also an overview of health effects in Cabraal, Barnes, Agarwal (2005)016 Off-grid lighting for the
October 2010 Base of the Pyramid
Lighting Africa research in Kenya provides further anecdotal evidence for the business impact of improved lighting, though more research on solar-enabled SME
retailers and small kiosks is needed:
• A small non-electrified enterprise near Lake Victoria which received solar lighting saw its revenues increase 60% as a result of being able to better illuminate
its wares at night
• Vendors of shoes, detergent, and food products at a major Kenyan night market reported upon seeing LED-solar prototypes that they would be able to extend
their operating hours by 30 to 50% if this form of lighting became available. They also universally believed that their sales volumes per hour would increase as
a result of their wares being more easily seen and more attractive due to better color rendering by white LED sources compared to kerosene lanterns
• Outdoor shopkeepers reported that with LED lighting they would avoid periods of market closure due to wind or rain (both of which extinguish their flame-
based lighting sources). They also perceived an additional benefit of being able to more easily and accurately count money and make change for customers.
Impact on Education: More Africa-specific research on the education impact of improved lighting is needed, though the limited data points available are
encouraging. In the Malawi solar lantern project study mentioned above, 18% of participating households identified children’s study time and reading as one of the
major benefits of better lighting.22 Evidence from other regions is more direct and highly positive. In Bangladesh, a study revealed that when solar-powered lighting
was introduced, children from the newly solar powered homes remained awake longer each day and used 38% of their additional time for studying and reading.
Similarly, a study of portable solar lighting impact in India found that the introduction of solar lighting raised average study hours of students per household from
1.5 hours to 2.7 hours, with a correlative effect on school performance.23
Impact on household spending: Another obvious and important impact of fuel-based lighting is the cost burden on poor household of paying for expensive
kerosene-based light. Kerosene costs vary across the world, but even in countries where kerosene is heavily subsidized by the government, like India and Sri Lanka,
the cost of a month’s worth of kerosene can equal between three to five days of income. In Africa this cost burden is often more substantial, with Lighting Africa
research and other estimates showing that BOP African households face recurring expenditures on fuels ranging between 10 and 25% of their monthly household
budgets.24
As the preceding survey of the literature demonstrates, traditional lighting options, particularly those those that use kerosene as fuel, are unequivocally flawed,
imposing unnecessary dangers, stiff costs, and insufficient services on the un-electrified and under-electrified poor. Consequently, the need for clean, safe,
renewable, and cheap lighting alternatives is one that is both urgent and growing.
14
Solar Electric Light Fund
15
Dongo, A. et al. (2007)
16
Oduwole, et al. (2003)
17
See generally, Cabraal, Barnes, Agarwal (2005) for a discussion of productive impact of non-fuel based lighting
18
Adkins, et al. (2009); Batliwala, Reddy (2003); Laxmi, et al. (2003)
19
Adkins, et al. (2009)
20
See, e.g., Lighting Africa, “Kenya: Qualitative Off-grid Lighting Market Assessment” (2008)
21
Display & Design Ideas (2003)
22
Adkins, et al. (2009)
23
Agoramoorthy and Hsu (2009)
24
Peon, et al. (2005); Lighting Africa market research (2008-2009)Off-grid lighting for the 017
Base of the Pyramid October 2010
Brighter, cleaner, and safe lighting for the family.
© Lighting Africa018 Off-grid lighting for the
October 2010 Base of the Pyramid
Understanding the Product Range
We classify the solar portable lighting (SPL) product range in two ways:
1. Product typology: what is the customer need being served
2. Performance: how many lumens delivered for how long for what price
Product Typology
The industry today lacks a common set of definitions or terminology, with solar lanterns being too generic a term to properly define the spectrum of products
available. In addition, we believe that currently consumers select products primarily based on price. Due to this reality, we do not believe a broad proliferation
of product categories is currently widely used, but we project a rapid broadening of solar lighting needs and services provided going forward. We forecast the
following styles of products to become increasingly differentiated in the future:
Flashlights/Torches - portable handheld devices offering directional lighting
at low lumen output. Today’s solar torches typically feature integrated solar
panels.
Task lamps/work lights – portable or stationary handheld devices, including 10W
solar desk lamps, in a range of panel sizes and light output levels utilized for
specific tasks (i.e. reading, weaving etc.).
Micro SHS
Ambient lamps /“lanterns” – portable or stationary devices that resemble the
Power/ Panel size
kerosene hurricane lamp form factor. They typically offer multi-directional light
along with a wide variety of size and functionality depending on technology 5W
Ambient Lamp/
Lanterns
(e.g., from heavy, powerful CFL lanterns to smaller LED-based systems).
Multi-functional devices – portable or stationary devices that can provide
Multi - Functional
directional and multi directional light, a variety of value-added features (i.e. Task Lantern/ Work Light
mobile phone recharge), and can be utilized for either task based or ambient Flashlight/Torch
lighting needs. 0
Low High
Micro-SHS – semi-portable lighting devices associated with a small portable Range of uses/ tasks
solar panel that powers or charges 1-3 small lights, mobile phones, and other
low-power accessories (e.g., radio, mini-fan).
Figure 2: Solar Portable Lighting product landscape
These products are distributed across a spectrum of decreasing specialization and increasing lumen output, which correlates directly with increasing power output
of the solar panel typically attached to them (Figure 2).
This comes as no surprise; the bigger the power capacity, the wider the lighting and other functionality that the core product can provide.
Across each of the above, multiple technological options are available based on price, local availability and performance requirements.Off-grid lighting for the 019
Base of the Pyramid October 2010
Figure 3: Solar Portable Light technology options
Performance
Ultimately, the core characteristic of a lighting product remains its ability to deliver bright light, for a long enough period of time at an affordable cost. However, the
ability to deliver a high level of lumen output is in direct competition with battery life. And, both high battery life and high luminosity are associated with higher
prices.
Hence, we propose a Solar Portable Light Performance Matrix that demonstrates the range of performance we have witnessed in the market, based on independent
testing and the latest price associated with such products (Figure 4):
We see clearly the emergence of premium, budget and specialized segments even within the BOP market. Importantly, while there is some correlation between
price and performance, there are also clear price leaders in each segment, even within our small sample set.
It is worth noting that the bottom end of the solar lantern market contains many products that fail to meet minimal quality requirements. This is especially true of
many African markets and, discussed in greater detail below, is already leading to problems of market spoilage. Therefore, this report omits low cost, low quality
products in all analyses – primarily rechargeable LED torches in the $1-10 range.020 Off-grid lighting for the
October 2010 Base of the Pyramid
Figure 4: Solar Portable Light Performance MatrixOff-grid lighting for the 021
Base of the Pyramid October 2010
Global industry Trends and Projections – market size and demand
Market definition and size
The solar portable light (SPL) market is focused on the off-grid (no access to electricity) and under-electrified (highly un-reliable access) markets. These markets are
further stratified by a range of incomes, as the absence of the grid cuts across income classes in many countries.
Given the alternatives available to wealthier households, including generators and solar home systems, the solar portable light market is predominantly targeted at
Base of Pyramid consumers and small businesses. Furthermore, while many countries feature a sizeable urban off-grid population, the problem of electrification
is particularly acute for the rural poor (Figure 5) who form the majority of potential SPL customers.
Figure 5: Electrification rates around the globe
While Asia is the largest market currently, with India the dominant force, relative population growth rates and slow grid expansion mean that Africa will be the
dominant market in the next twenty years, with close to 700 million people projected to be living of the grid by 2030 (Figure 6).
A common mistake in sizing the solar market opportunity in developing lighting markets is to focus exclusively on the off-grid population figures highlighted above.
In reality, many more households lack access to reliable electricity than official statistics suggest. First, official electrification statistics at times overestimate the
on-grid population by including households living in grid areas, but lacking a reliable and legal grid connections – in Haiti, for example, the official electrification
rate stands at 25%, with only half of these households having legal, secure grid access. More important, many poor on-grid households and businesses in Latin
America, Asia, and Africa experience lengthy and frequent blackouts. Our research suggests that this “under-electrified” BOP population (defined as individuals
and businesses with weekly or daily power outages) ranges from 10% to over 50% of the on-grid populations in many nations, with the problem being particularly
acute in Africa (over 100 million “under-electrified” individuals) and in rural areas of South and Southeast Asia. The under-electrified population is a major potential
market for off-grid back-up power solutions like SPLs.022 Off-grid lighting for the
October 2010 Base of the Pyramid
By 2030 roughly 1.3 billion people will remain un-electrified. With Africa’s un-electrified
projected to grow to 700 million, gains made in other regions will be largely negated.
Figure 6: Forecast for global un-electrified populations
Given the current concentrations of un- and under-electrified populations, the largest off-grid SPL commercialization efforts are unsurprisingly focused on Africa
and South Asia. A mix of low grid penetration, large populations plus continued population growth, high energy prices, relatively low levels of urbanization and
ongoing high levels of poverty, continues to make these two regions high value markets for solar portable products (Figure 7). The need to focus on Africa and
South Asia is clear.
Note: Bubble size equals number of un-electrified population
Figure 7: Large rural populations facing high energy costs are high potential marketsOff-grid lighting for the 023
Base of the Pyramid October 2010
Global drivers of off-grid lighting market growth
The potential for off-grid lighting is not only large, but is growing rapidly. The five major drivers of demand globally are:
1. Lagging grid growth: the importance of grid growth as a driver for SPL demand varies by region, with rapid grid growth likely in select Asian and Latin American
geographies and very slow grid growth seen in many African nations. Grid penetration typically needs to grow by over 2% a year to counteract the effect of
population growth – in practice this means that even substantial investments into the grid will leave many large nations with sizeable and growing off-grid
populations in decades to come.
2. Price trends: rapid technological innovation in basic SPL technologies and a scale-up of commercialization efforts by lighting entrepreneurs is driving a substantial
decrease in the manufactured price of solar portable lights, and since affordability is arguably the main obstacle to market adoption, falling manufacturing costs
and corresponding declines in the retail product price will be a critical driver of demand going forward.
3. Technology and design innovation: Beyond improvements in price, the top of the SPL market is also undergoing a revolution in product design and quality.
Most manufacturers have not yet achieved the quality and reliability standards of mass produced consumer electronics, but the market is starting to see a number
of products that combine sufficient quality of build, long battery life, and most importantly, value-added features and product designs that address the particular
needs of BOP off-grid and under-electrified consumers. Innovation is set to accelerate as technological components fall in price and entrepreneurs invest more
resources into studying local conditions and end-users.
4. Kerosene prices: kerosene, the main traditional alternative to off-grid renewable lighting, has long been an expensive commodity for the poor and is expected to
continue increasing in price. Analysts forecast an average increase of 4% annually over the next five years. This, combined with increasing pressure on kerosene
subsidies in Asia and Africa, will drive consumer demand for cheaper alternatives.
5. Mobile opportunity: Today, nearly 500 million people worldwide (i.e., a third of the 1.6 billion off-grid population) have a mobile phone subscription but
no easy or cheap access to a means of charging their phones.25 A number of potential charging solutions are on the market, but if lighting manufacturers take
advantage of this trend (e.g., partnerships with phone companies, mainstreaming of mobile charging functionality), the mobile charging opportunity could
become a major driver for SPL sales globally – providing a value proposition to both consumers, who can avoid mobile phone charging costs, and to the phone
companies who can sell more airtime.
Below we focus on the global trends of SPL price, evolution in underlying technologies, and growth of consumer-orientated features and design. Other important
drivers, like off-grid population growth, kerosene prices, and growing demand for off-grid phone charging solutions are illustrated in depth in the Africa 2015
market scenario section of the report.
SPL price trends
Solar lanterns are generally composed of five major cost components. However, depending on the distribution margins and taxes, this prices are estimated to
account for only for 30-70% of the price seen by the end-consumer.
The core components include: (1) the solar panel, (2) the battery, (3) the light source, (4) the charge controller, and (5) the lamp housing. While a breakdown of
component costs can vary by design and manufacturer, we have compiled an averaged view below including 5 year projections (Figure 8):
25
See GSMA Development Fund (2010). The most common mobile charging option for such off-grid consumers is fee-based charging through electrified neighbors or SMEs.024 Off-grid lighting for the
October 2010 Base of the Pyramid
Figures in Dollars
Figure 8: Decomposition and forecast of today’s median lantern component costs
Solar
The largest costs in today’s SPLs are concentrated in the solar panel, which often accounts for well over 30% of a typical solar lantern or torch component costs.
Depending on the portable light device and type of light source, the solar panel can be as small as 0.3W for solar torches or as large as 8W for full-featured CFL
“hurricane lantern-style” devices. Our review of over 40 SPL devices tested by Lighting Africa, GTZ, and other researchers suggests an average panel size of 2.5
watts, with obvious differentiation based on form factor and SPL type.26
The majority of the SPL devices on today’s market feature crystalline silicone solar PV panels, but a growing minority use amorphous “thin-film” technology. The
SPL device split that we have seen largely mirrors the industry-wide split in amorphous (15% of the market) and crystalline PV production (85% of the market).27 A
major technical difference between crystalline (c-Si) and amorphous (a-Si) PV technologies is their efficiency at converting solar energy into electricity. Crystalline
PV panels have efficiencies that range from 12 to 22%, while a-Si panels currently have an efficiency of 6-9%. The practical implication of these efficiency
differentials is that a typical a-Si panel for any given watt rating will be larger than a similarly rated crystalline panel. This has not proven a major obstacle for SPL
applications, given the rural BOP consumer’s preference for “substantial” products with larger panels that appear sturdier and therefore a better value.
The price of both crystalline and thin-film amorphous technologies for SPL devices has declined substantially over the years and is set to fall further.
The price of crystalline PV modules correlates with the movements of polysilicon spot prices with a volatility roughly half that of polysilicon, as demonstrated below
(Figure 9). Since 2008, polysilicon prices have dropped rapidly due to a market oversupply. Over the past year a 32% drop in polysilicon prices has correlated
with a 16% drop in solar PV prices. Near-term forecasts predict polysilicon prices will continue to slide as a market oversupply is projected through at least 2012.
Analysts we have interviewed believe that this polysilicon glut, along with more efficient manufacturing, will continue to drive down the average price of large
crystalline PV panels to under $1.7/watt from $3.3/watt in 2009 (Fig. 10).28
26
Lighting Africa; GTZ; Radecsky (2009) sample of dozens of SPL bought in Kenyan markets.
27
Photon International (2009); Navigant (2008)
28
Solar PV cost projections reference the costs for large sized (e.g., 200-400 watt) panels; small panels of the type used for SPL devices typically come at a 20-40% premium depending on scale of purchaser
and technology, with an average cost of over $3.3 dollars per watt in 2009 and $1.74/watt by 2015Off-grid lighting for the 025
Base of the Pyramid October 2010
Thin-film a-Si PV panels will also continue to see substantial price declines due to
technological innovation and growing scale of production, falling to below $1 per watt
according to industry projections. The analysts we’ve talked to believe that continuing
innovation in the a-Si technology, as well as thin-film alternatives like CIGS, light-
absorbing dyes (DSCC), organic polymer solar cells, and nanocrystalline cells will
maintain substantial pressure on all thin-film PV panel prices in coming years.
Many of the SPL manufacturers we have spoken to in our survey were considering the
switch to thin-film PV components because of their durability and flexibility; others
will make their decision purely on the basis of price. We hypothesize a move by SPL
manufacturers to 50% thin-film (likely, a-Si) and 50% crystalline (c-Si) in five years, as the
increase in efficiency and growing scale of production makes thin-film products more
competitive and as more companies pursue more durable, flexible SPL form factors. The
projected decline in thin-film prices will therefore further “decrease the blended average
price of an SPL’s PV panel price (Figure 10).
In light of these trends, and accounting for technology advances, market scale, and
growing small panel manufacturing capacity, we project an 35-45% reduction in the
cost of today’s solar panel by 2015.
Figure 9: Links between solar PV price and polysilicon
Figure 10: Forecast for solar PV panel price trends026 Off-grid lighting for the
October 2010 Base of the Pyramid
Battery
The emergence of advanced battery alternatives illustrates how the introduction of new technologies can change the cost-by-component breakdown.
Sealed lead acid (SLA) batteries have been the standard SPL industry solution in its early years, given the substantial power required for CFL lights, the wide
availability of the technology, and its low cost. With the ongoing shift to LED lights and lower resulting power requirements, manufacturers have trended towards
Nickel Metal Hydride (NiMH) batteries which now account for over half of the batteries (across all form factors) for the SPL devices we’ve reviewed. In the past
two years a small number of SPL manufacturers have begun to feature Lithium-Ion (Li-Ion) batteries to take advantage of their smaller size, increased battery life,
and substantially greater number of recharge cycles.
Figure 11: Battery Technology Options
We believe the shift away from SLA and toward Li-Ion is set to accelerate. Li-Ion is experiencing rapidly falling prices and now receives the bulk of advanced
battery research investment fueled by the mobile phone, laptop and hybrid vehicle battery market. Li-Ion is forecasted to be the fastest growing battery segment
in the portable electronics segment, with a projected price decline of 13% annually, 29 leading to a lower price point in 2015 than NiMH batteries and a rapid
convergence to SLA costs (Figure 12).
Based on the feedback in many of our interviews, we believe this will continue to pull the market away from both SLA batteries and, if the SPL industry mirrors the
battery trends in the mobile phone battery market over the past five years, Li-Ion will increasingly steal share from NiMH-powered SPL (see Figure 13, applying
Li-Ion share growth in the mobile market over 2005-2010 to the SPL market in 2010-2015).
29
Pike Research (2009) projects 13% annual price declineYou can also read