Market Opportunities for Missouri Artisan Cheese
←
→
Page content transcription
If your browser does not render page correctly, please read the page content below
Market Opportunities for
Missouri Artisan Cheese

Dr. Joe Parcell (parcellj@missouri.edu; 573-882-0870)
Jill Moreland (morelandj@missouri.edu; 573-884-1756)

Missouri Value Added Center
University of Missouri

Federal State Marketing Improvement Program
United States Department of Agriculture

March 2013
Table of Contents
Table of Contents ............................................................................................................................ 2
Figures ................................................................................................................................................ 4
Tables ................................................................................................................................................. 4

Executive Summary .................................................................................................................... 6

1.     Research Background and Justification ........................................................................... 9

2. Cheese Segments and Varieties ..................................................................................... 10
2.1. Common Categories ........................................................................................................ 10
2.2. Segment Market Share ..................................................................................................... 13
2.3. Segment Price Points ......................................................................................................... 16

3.     U.S. Cheese Consumption ................................................................................................ 19

4. Missouri Cheese Consumption ........................................................................................ 22
4.1. Survey Design and Methodology .................................................................................... 22
4.2. Survey Results and Insights ................................................................................................ 23
4.2.1.  Frequency of Cheese Consumption........................................................................... 23
4.2.2.  Reasons for Eating Cheese ........................................................................................... 25
4.2.3.  Well-Liked Cheeses ........................................................................................................ 26
4.2.4.  Consumption and Purchase of Artisan Cheeses ...................................................... 28
4.2.5.  Consumption Frequency of Artisan Cheeses ............................................................ 29
4.2.6.  Important Attributes of Artisan Cheeses..................................................................... 29
4.2.7.  Interest for Special Flavors............................................................................................. 30
4.2.8.  Preferred Forms and Packaging for Artisan Cheeses .............................................. 31
4.2.9.  Preferred Retail Channels ............................................................................................. 32
4.2.10.    Pricing for Imported Artisan vs. Local Artisan Cheeses ........................................ 33
4.2.11.    Definition of “Local” ................................................................................................... 34
4.2.12.    Summary and Key Takeaways ................................................................................. 35

5. U.S. Cheese Production .................................................................................................... 36
5.1. History ................................................................................................................................... 36
5.2. Factors behind the Development of a Cheese Industry............................................. 36
5.3. Production Trends............................................................................................................... 38
5.4. U.S. Regional Cheese Centers ......................................................................................... 39

6. Supply Chain and Marketing Channels .......................................................................... 42
6.1. Missouri Dairy ....................................................................................................................... 43
6.2. Role of Brokers and Distributors ........................................................................................ 45
6.3. Common Distribution Channels ....................................................................................... 45
6.3.1. Specialty Stores ............................................................................................................... 45
6.3.2. Farmers Markets .............................................................................................................. 45
6.3.3. Direct/Online Marketing................................................................................................ 46
6.3.4. Retail Grocery Outlets ................................................................................................... 46

Missouri Artisan Cheeses
                                                                                                                                                             2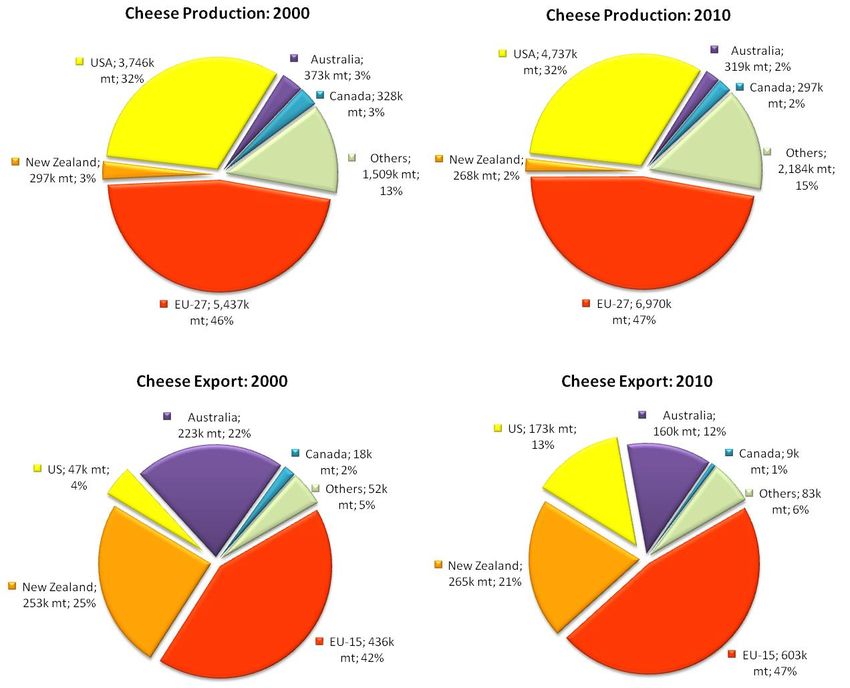
6.4. Distribution Channels for Missouri Cheeses .................................................................... 46
6.4.1. Survey of Deli Managers: Survey Design .................................................................... 46
6.4.2. Survey Findings and Insights.......................................................................................... 48

7. Institutional Setting............................................................................................................. 55
7.1. Supporting Institutions ........................................................................................................ 55
7.1.1. Dairy Management, Inc.................................................................................................... 55
7.1.2. Slow Food Movement ....................................................................................................... 55
7.1.3. The American Cheese Society ........................................................................................ 56
7.1.4. State Advisory Board and Cheese Guilds ...................................................................... 56
7.1.5. Dairy Cooperatives ............................................................................................................ 56
7.1.6. Trade Publications .............................................................................................................. 57
7.2. Regulatory environment ................................................................................................... 57
7.2.1. Zoning and Land Use Regulations ................................................................................... 58
7.2.2. CAFO and the Dairy Wastewater Management Permit ............................................. 58
7.2.3. Federal Standards of Identity ........................................................................................... 59
7.2.4. Product Packaging ............................................................................................................ 59

8.    Major Market Players ........................................................................................................ 60

References...................................................................................................................................... 61
Appendices .................................................................................................................................... 63
Appendix 1: Artisan Cheesemakers in the U.S. ....................................................................... 64
Appendix 2: Murray’s Cheese Catalogue ................................................................................ 76
Appendix 3: Consumer Survey Questionnaire ......................................................................... 78
Appendix 4: Sample Brochures ................................................................................................... 82
Appendix 5: Survey of Grocery Chains: Interview Guide ...................................................... 83
Appendix 6: Agricultural Districts of Missouri ............................................................................. 86
Appendix 7: Farmstead Cheese Producers in Missouri ........................................................... 87
Appendix 8: Missouri Farmers Markets ....................................................................................... 88

Missouri Artisan Cheeses
                                                                                                                                                      3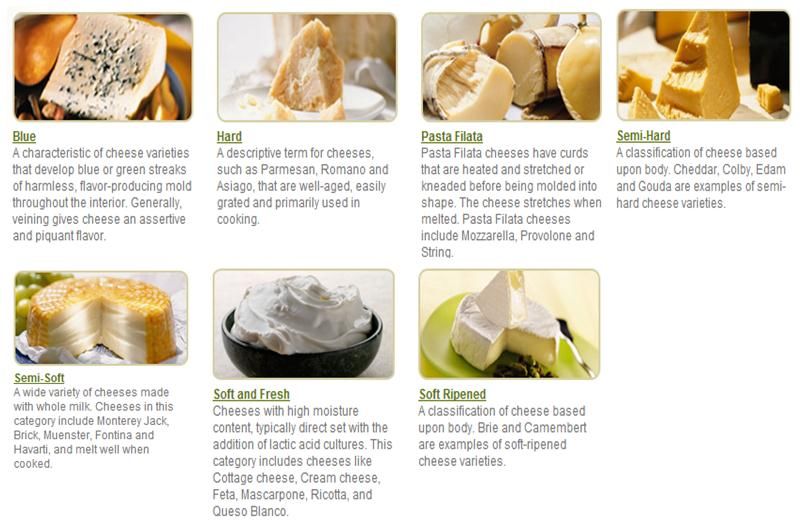
Figures
Figure 1: Natural Cheese Varieties ............................................................................................. 11
Figure 2: U.S. Cheese Production Mn Lbs (1960-2010) ............................................................ 14
Figure 3: Cheese Production Other Cheese Types Mn Lbs (1960-2010) .............................. 15
Figure 4: U.S. Cheese Production Italian Cheese Types Mn Lbs (1960-2010) ...................... 15
Figure 5: U.S. Per Capita Cheese Consumption, 1982-2017 ................................................... 19
Figure 6: Distribution of Respondents Who Consume Cheese .............................................. 25
Figure 7: Reasons for Eating Cheese .......................................................................................... 26
Figure 8: U.S. Cheese Production, Mn Lbs ................................................................................. 38
Figure 9: International Dairy Cheese Production and Exports: 2000 and 2010 ................... 39
Figure 10: Regional Cheese Production .................................................................................... 40
Figure 11: U.S. Cheese Production: Top 10 States (1970-2011), Mn Lbs ................................ 41
Figure 12: Cheese Dairy Product Value Chain......................................................................... 42
Figure 13: Missouri Dairy Production Statistics ........................................................................... 43
Figure 14: Sales Value of Milk and Other Dairy Products in Missouri by Region ($ Mn) ..... 44

Tables
Table 1: Cheese Shelf-Life by Moisture Content ...................................................................... 11
Table 2: Cheese Segment Performance, 2011 ........................................................................ 13
Table 3: Growth and Market Share of U.S. Farmstead and Artisan Cheeses ..................... 16
Table 4: Average Wholesale Price ($/lbs) of Domestically Produced Cheeses ................. 17
Table 5: Average Weekly Wholesale Price ($/lbs) of Foreign Cheese Types ...................... 17
Table 6: Advertised Retail Price Ranges of Natural Cheeses In the U.S. ($/lbs):
         01/28/2013-02/08/2013................................................................................................... 18
Table 7: Cheese Consumption by Income Bracket ................................................................ 20
Table 8: Frequency of Consumption by Demographic Profile .............................................. 24
Table 9: Top Three Popular Cheese Types ................................................................................ 27
Table 10: Most Preferred Cheese Textures ................................................................................ 27
Table 11: Purchase of Artisan Cheese by Frequency of Cheese Consumption ................ 28
Table 12: Reasons for Not Consuming Artisan Cheese ........................................................... 28
Table 13: Reasons for Consuming Artisan Cheese .................................................................. 29
Table 14: Artisan Cheese Consumption Frequency ................................................................ 29
Table 15: Artisan Cheese Attributes (N=440 total cheese buyers) ........................................ 30
Table 16: Interest in Artisan Cheese with Special Flavors ....................................................... 31
Table 17: Preference for Artisan Cheese Forms ....................................................................... 31
Table 18: Preference for Artisan Cheese Packaging .............................................................. 32
Table 19: Retail Channel .............................................................................................................. 32
Table 20: Frequency of Cheese Purchase from Farmers Market .......................................... 33
Table 21: Frequency of Cheese Purchase Online or Other Media Channels .................... 33
Table 22: Premium for Domestic vs. Imported Artisan Cheese ............................................. 34
Table 23: Definition of Local ........................................................................................................ 34
Table 24: List of Grocery Stores Selected for the Interview .................................................... 47

Missouri Artisan Cheeses
                                                                                                                                             4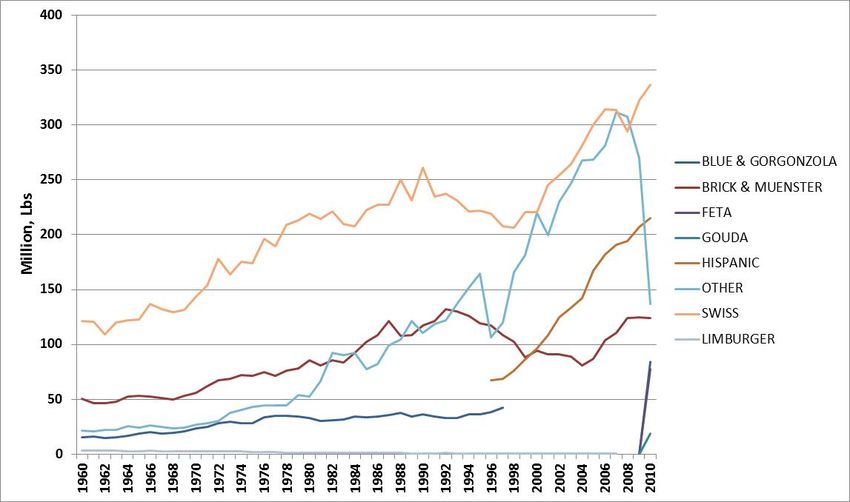
Table 25: Stores Selling Artisan Cheeses .................................................................................... 48
Table 26: Percent of Cheese Sold That Is Artisan ..................................................................... 49
Table 27: Interviewees’ Perception of Local ............................................................................ 49
Table 28: Sources of Artisan Cheeses ........................................................................................ 50
Table 29: Supplier Attributes ........................................................................................................ 52
Table 30: Product Spoilage .......................................................................................................... 52
Table 31: Decision on New Supplier by Type of Store ............................................................. 53
Table 32: Summary of Challenges and Opportunities ............................................................ 53

Missouri Artisan Cheeses
                                                                                                                                            5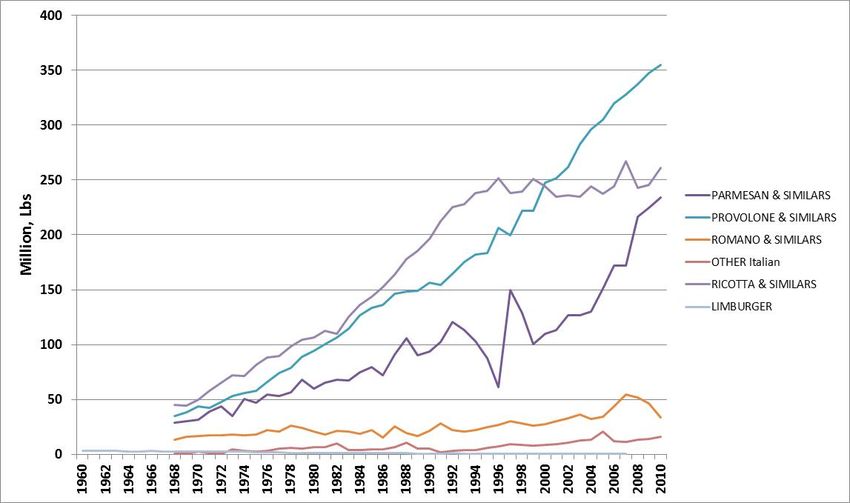
Executive Summary
The potential for artisan cheese varieties appears promising. External factors
such as the implementation of the Uruguay Round, which has brought down subsidies
for European cheese exports, can further open markets both domestically and abroad.
Already, U.S. cheese exports have seen tremendous growth. Its market share increased
from 4 percent of global cheese exports in 2000 to 13 percent in 2010.
Domestic consumption of specialty cheese is also on the uptrend. It grew by 94
percent between 1993 and 2004 and is projected to increase more given the growing
popularity of Hispanic and European cuisines in the American diet as well as the
increase in easy-to-consume specialty cheese packages available in retail channels.
Local markets appear ripe for artisan cheeses; almost a majority of consumers
either already consume artisan cheese varieties or are interested in doing so. The gap
appears to be in educating consumers about which cheeses available are artisan.
Based on consumer survey research conducted for this study, a majority of respondents
do not know what artisan cheeses are, and some wonder where they can buy these
products. Of those who already patronize artisan varieties, many are cognizant of the
price premium that these command. Other consumer survey findings highlight the
following marketing and production-related considerations for local cheesemakers:
Most people (87 percent) eat cheese, and they do so mainly because they like
the taste of it. Hence, flavor is important.
A frequent cheese eater is typically white, is 25 years old to 64 years old, has an
annual household income of at least $26,000 and has at least earned a high
school degree.
Cheeses are used as ingredients for cooking and sandwich complements. This
goes along with why consumers would prefer harder cheese varieties like Swiss
and parmesan. However, consumers are starting to get acquainted with more
exotic cheese varieties (e.g., Havarti, Pecorino, Manchego, etc.).
Although most respondents were cheese eaters, many (42 percent) were
unfamiliar with the “artisan” varieties. There is evidently a need for marketing or
an information campaign that will help consumers identify and get familiar with
artisan varieties. On top of this, availability of artisan cheese is also an issue.
Those who buy artisan cheeses consume it at least monthly (75 percent), and it’s
typically consumed as a snack or complement with other products such as wine.
Executive Summary
Hence, they would also typically prefer easy-to-consume product formats such
as pre-packed bricks, curds, sliced, spreads, or snack-size.
Important artisan cheese attributes are (i) taste (consistent with why consumers
would eat cheeses in general), (ii) made with natural milk, (iii) price, (iv) package
Missouri Artisan Cheeses
6
size, and (v) health or fat content. Along with taste, cheese with special flavors
such as smoked and herb varieties are popular, and consumers are generally
inclined, if they haven’t already done so, to try the flavored varieties.
Most artisan cheese buyers (78 percent) buy cheese from the most convenient
retail channel – grocery chain stores. Others (50 percent) buy it online, albeit
typically less than once per month. Only 11 percent indicated that they buy it
directly from processors. Moreover, most (76 percent) never buy cheese from
farmers markets. Interestingly, on-premise retailing and farmers markets are the
most common channels used by artisan cheesemakers, indicating a mismatch
between buyers and suppliers. It also, however, highlights untapped demand for
artisan cheesemakers. Making product more accessible is an opportunity.
Most artisan cheese buyers recognize that these varieties are premium products.
They will be willing to pay 20 percent more for those that are U.S.-produced.
Consumers define local products as those produced within state boundaries.
Missouri offers the right environment to take advantage of the growth in the
industry. There are 1,530 licensed dairy herds in Missouri, and Missouri is the 25th largest
milk-producing state in the U.S. At least seven artisan cheese producers have
established niche markets and are well on their way in sustaining and growing their
businesses. The survey of grocery chain stores conducted for this study shows that if
supply reliability issues can be addressed, then local producers can gain a stronger
foothold on grocery chains to reach the end consumers. The following points are other
challenges highlighted during the grocery store survey:
Consumer Awareness/Product Familiarity: Interviewees raised the issue of
product familiarity as one of the key challenges, which underscores the need for
an education/marketing campaign for artisan varieties. One interviewee
explains: There is a need to “inform the customer of what artisan cheese is. Why is
it so expensive?” Another interviewee specifically cited confusion on product
packaging. To wit, “People's perspective of the artisan and specialty cheeses
that are sealed is incorrect. They feel that if they are sealed, then they are not
fresh, but actually it keeps the cheese fresher and allows for longer refrigerator
time.” Many of the extension services of U.S. cheese-producing regions are doing
a great job with more holistic marketing of artisan cheese varieties. All artisan
cheese producers benefit in some way from this information campaign, but local
producers must soon find a way to differentiate and brand their products in the
face of the strengthening brand identity of more well-known cheese-producing
states. For instance, most Wisconsin cheeses come with a Wisconsin Cheese
Executive Summary
product seal. Availability of Wisconsin cheeses in the same geographic area
that Missouri producers offer their product raises the need for a more holistic
competitive strategy for local cheeses.
Product Seasonality, Supply Availability, and Taste Consistency: Although some
consumers seek new product varieties and unique taste, it appears that product
Missouri Artisan Cheeses
7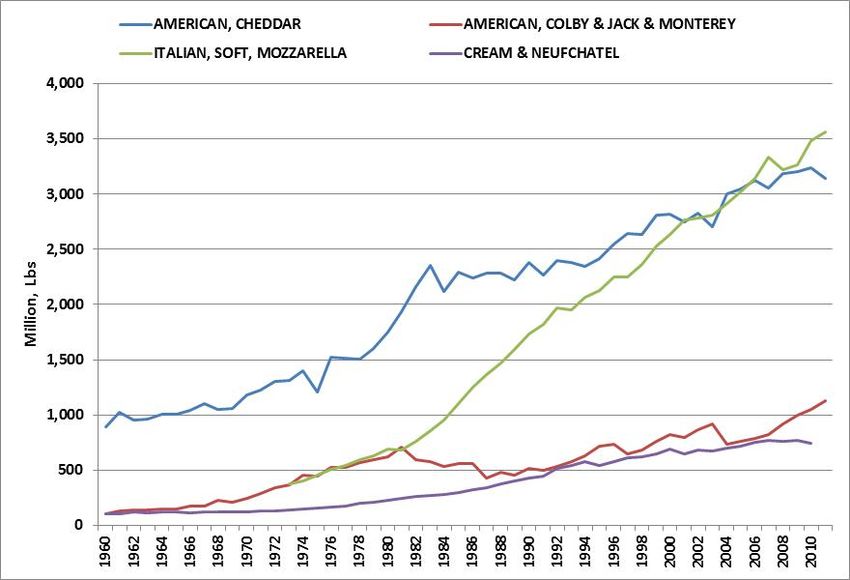
consistency is a concern. One grocery chain manager explains that one issue
encountered is that the “taste isn’t the same with every batch.” On top of this,
“Supply is not consistent.” Another interviewee explains, “Because it is artisan, the
taste varies, and customers don’t like that. Samples will help this situation.”
Higher Price: One interviewee points out the need to ”get people used to buying
a higher priced item.” Consumers’ unfamiliarity with the product coupled with
unsteady supply disrupts the opportunity to create a steady artisan variety
buying pattern.
The following are opportunities that the grocery store survey respondents cited for
artisan cheese products:
Consumers’ Preference for Local Products: The following statements from the
interviewees explains this opportunity: (i) “Local, home-grown and processed
products are up and coming, especially in St. Louis.” (ii) “Always room for more
competition. And local producers are the number one choice [for our customer
base].” (iii)”Having the ability to trace a product back to [the] farmer helps with
the marketing side of the product. People are starting to understand why
specialty cheeses are more expensive, and they are willing to pay for the added
luxury of it being produced locally. If the product can be sampled, like in a
farmers market, it enhances the profitability in the store,” and (iv) ”If the product
is local, we can keep it on the shelf…we are constantly out of the product. We
have over 500 different suppliers of local of local products in our store. We are
always looking for new companies, and the process is not difficult.”
Increased Accessibility: To quote an interviewee: “Our customers look to us to
have local products so they do not have to attend different farmers markets and
road side stands. Convenience of selling local products is important.”
Consumers’ Increasing Preference for Healthier Food Types: This trend is
explained by one of the interviewees as follow: “In the deli market, artisan
cheese has a huge market to break into. [Artisan cheeses] will be marketed well
because it is a rare product. People are looking for new things and new tastes. A
niche product has the opportunity to reach high demands.”
Seasonality and Demand Potential: “The product is marketed the best as a
seasonal product. There is demand for artisan cheese in all areas, especially
cities. There is market if the product is available.”
Although farmers markets and online retail do not seem to be preferred channels
for sourcing artisan cheese, developing institutional support in a more holistic marketing
Executive Summary
campaign for Missouuri artisan cheeses, similar to the strategy adopted by Wisconsin
and California, can boost familiarity and patronage for Missouri artisan cheeses.
The insights contained in this market study should bridge the information gap and
provide dairy producers with market opportunity information that will help them
brainstorm ideas and concepts to better meet consumer wants and needs.
Missouri Artisan Cheeses
8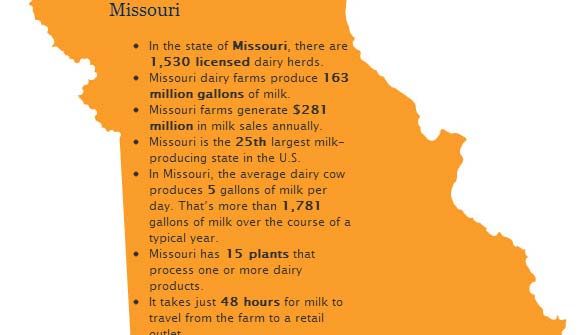
1. Research Background and Justification
       The U.S. cheese market has grown steadily in the past three decades.
According to the U.S. Department of Agriculture (USDA), per capita cheese
consumption between 1982 and 2012 averaged about 30 lbs. Consumption is
projected to reach 37 pounds per capita by 2017. Consumer research firm Mintel, Inc.,
presents an equally robust outlook. In its 2012 report, Mintel estimates the value of this
industry to be approximately $19 billion. It forecasts an average annual growth in sales
of about 5 percent, making this a $24 billion market by 2016.

       Missouri offers the right combination of demographics, population, and small-
scale dairies to provide considerable opportunities to partake in this multi-billion dollar
market. Although approximately 20 percent of the industry is currently dominated by
brand leader Kraft, the potential to penetrate niche markets within increasingly
differentiated product segments is an opportunity for small-scale artisan cheese
producers.

         Already, many small-scale Missouri dairies are entering niche cheese production.
The recent financial crisis has hastened the pace of these dairies to look for new value-
added product opportunities. However, lack of understanding about market needs
and market opportunities limits many from pursuing value-added product processing.
Providing current and emerging dairy producers with market opportunity information
will assist these entrepreneurs in brainstorming ideas and concepts to better meet
consumer wants and needs. This market study aims to bridge the information gap.

       This report includes an introduction to the different cheese varieties, brief history
of cheesemaking in the U.S., product supply chains, consumption trends, and market
shares. This information provides the context within which market opportunities for
Missouri artisan cheese are discussed.

      Alongside the more general discussions on the cheese industry and
cheesemaking business on a national scale, special attention is given to the results of a
Missouri consumer survey and grocery chain deli manager interviews. These two
primary data zero in on specific business questions for Missouri artisan cheeses.

       The consumer survey sheds light on product wants, needs, buying location                Research Background and Justification
preferences, and pricing. The grocery chain survey delves into opportunities for local
artisan cheese producers to connect with retail channels in the area.

Missouri Artisan Cheeses
                                                                                               9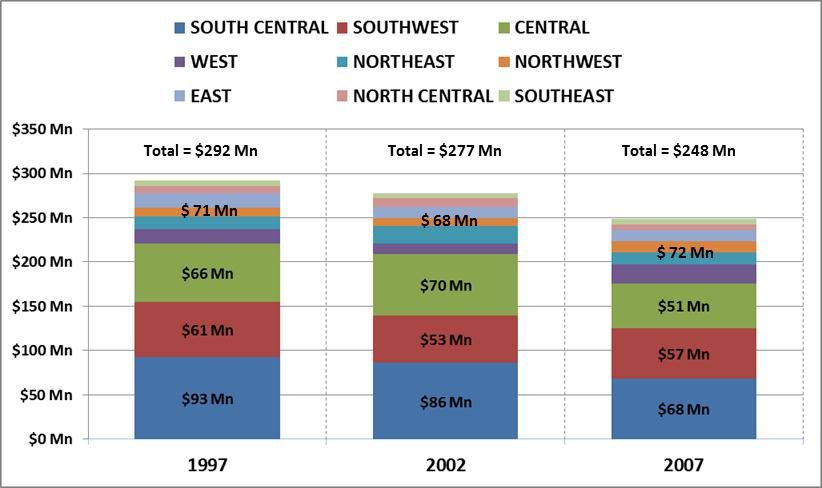
2. Cheese Segments and Varieties
        According to the International Dairy Foods Association, cheese is a “highly
nutritious and palatable food that contains almost all of the protein and essential
minerals, vitamins, and other nutrients of milk.” Because cheese has a low glycemic
index; is high in protein, vitamins, and minerals; and is available in different flavors and
varieties, it is a highly sought ingredient in meals (National Dairy Council, 2005).

         Not only is it highly nutritious and delicious, but cheese is also one of the most
fascinating products. There are hundreds of types and varieties of cheeses from which
to choose. The International Dairy Federation recognizes more than 500 varieties. Other
institutions account for more. A study entitled “Cheese: Chemistry, Physics and
Microbiology: Major Cheese Groups” provides a comprehensive discussion about
categorizing cheese varieties (Fox et al., 2004). Some of these categorizations are
discussed below. Others are left to cheese aficionados who would like to learn more
and can sift through the more technical aspect of cheesemaking.

2.1.   Common Categories

       The more obvious categorization of cheese is associated with the dairy animal
that produced the milk: cow, sheep, goat, moose, camel, reindeer, horse, or yak
(cheese.com).

       Cheese is also often broadly segmented into natural cheese and processed
cheese. Natural cheeses can be unripened or ripened. Unripened cheeses are made
by coagulating milk proteins (casein) with acid. Examples include soft cheeses like
cream cheese, cottage cheese and Neufchatel. Ripened cheeses are made by
coagulating milk proteins with enzymes (rennet) and culture acids. These cheeses are
then ripened (aged) by bacteria or mold.

      Natural cheeses are often categorized according to their moisture content or
degree of softness or hardness. The most common texture categories are hard,
pressed, uncooked, semi-hard, soft, flowered, washed, spotted, and ripened. Figure 1
presents these categories, their description and some examples
(www.eatwisconsincheese.com).

         Categorizing cheese by moisture content is crucial to understanding product
                                                                                                      Cheese Segments and Varieties

shelf life --the more moisture a cheese has or the softer it is, the shorter its shelf life. Shelf-
life rapidly deteriorates once the cheese is removed from its packaging. Keeping the air
out by tightly wrapping the cheese helps prevent spoiling. Table 1 presents cheese
shelf-life by moisture content.

Missouri Artisan Cheeses
                                                                                                      10
Figure 1: Natural Cheese Varieties
Source: http://www.eatwisconsincheese.com
Table 1: Cheese Shelf-Life by Moisture Content
Cheese Type Shelf Life
Soft unripened cheeses (ricotta, cottage cheese) 2 to 4 weeks
Soft-ripened cheeses (brie) 4 to 8 weeks
Semi-soft cheeses (muenster, Monterey Jack) 2 to 3 months
Firm cheeses (Swiss, Cheddar) 3 to 6 months
Hard cheeses (Parmesan, Romano) 7 to 9 months
Processed cheeses (American) 9 to 12 months
Source: http://www.dcicheeseco.com/about-cheese/faqs
Processed cheeses are cheeses made by blending one or more natural cheeses,
heating, and adding emulsifying salts. Processed cheeses contain more moisture than
Common Categories
natural cheeses. Pasteurized processed cheeses include American cheese, cheese
spreads and cheese foods. Cold-pack cheese is a blend of natural cheeses processed
without heat. Flavoring and seasonings are often added (Natural Dairy Council). It is
inexpensive and consistent, and it melts smoothly. It is sold packaged and either pre-
Missouri Artisan Cheeses
11sliced or unsliced in a number of varieties. It is also available in aerosol cans in some
countries.
The above cheese varieties are often grouped into the following cheese types
for reporting purposes: mozzarella, cheddar, other Italian, other American,
cream/Neufchatel, Swiss cheese, Hispanic cheese, and other types of cheese (NASS).
Yet another way to segment the cheese industry is by manner of production.
There are two main production categories for cheese: commodity cheese and
specialty cheese. Commodity cheeses are found in the supermarket dairy case as pre-
packaged and multi-sized products. They tend to be used more for cooking and
baking. Examples of commodity cheese include cheddar, mozzarella, and Swiss
cheeses that are produced in large quantities.
Specialty cheese on the other hand is a value-added product that has a high
quality (flavor and appearance), is produced in much smaller quantities than
commodity cheese, and demands a premium price from consumers. Specialty cheeses
tend to be sold more in specialized shops such as delis. Specialty cheeses include
Havarti, Italian varieties, Gouda, feta, Latin American, flavored, washed, or smear-
ripened cheeses. They come from all types of milk (cow, sheep, goat) and may include
flavorings, such as herbs, spices, fruits, and nuts.
Also related to manner of production, especially of natural cheese varieties, is
another layer of segmentation: artisan cheeses and farmstead or homestead cheese.
Artisans’ dairy products are often handmade, or they’re made using relatively small-
scale specialty techniques in small batches. Artisan captures the uniqueness and
special identity of each product as well as the artisan who makes it. Farmstead
cheeses are those that are made on the farm from the milk produced on that farm.
Because artisan cheeses are made in “limited quantities using traditional
methods with great attention to detail, and possessing unique taste and quality
characteristics that differentiate them from other cheeses” (Reed etal, 2011), they are
categorized as specialty cheeses.
Artisan cheeses are not necessarily farmstead, but the traditional technique and
unique flavoring that characterize this cheese segment often make its production very
vertically integrated. Hence, most, albeit not all, artisan cheeses are farmstead. “The
Atlas of American Artisan Cheese” by Jeffrey P. Roberts features 345 artisan
cheesemakers in the U.S. Seventy-three percent of artisan products inventoried in the
book are homestead (Appendix 1).
The above categorization of cheeses, particularly the specialty cheese segment,
Common Categories
is by no means clean cut. Compared with data gathering for commodity dairy
products, data gathering for the specialty cheese category is a complex undertaking
because information is fragmented. Government resources generally do not provide
data broken down into the various cheese categories. This makes it challenging to
track and analyze production and consumption of specialty cheeses, particularly the
artisan and farmstead varieties. Categorization also varies by region. NASS field offices,
Missouri Artisan Cheeses
12for instance, track 14 categories of specialty cheeses in Wisconsin but only seven in
California (Ellerby, 2010).
The dynamic growth of the cheese industry makes categorizing complicated.
For example, mozzarella used to be considered a specialty cheese, but that variety’s
massive growth as a pizza ingredient has firmly placed it in the commodity category
(exempting “fresh” varieties that are water- or oil-packed and less than two weeks old).
Various cheddar types also may or may not be considered “specialty,” depending on
their specific attributes (Ellerby, 2010).
2.2. Segment Market Share
The largest sector of the U.S. cheese market in 2011 was natural cheese, which
generated 62.1 percent of the market's value. Natural cheeses encompass most of the
more than 300 types of cheese available in the U.S. Cheddar is the leading type of
cheese that consumers buy (among 89 percent as noted in the Household Cheese
Usage section). Table 2 shows segment performance for 2009 and 2011.
Table 2: Cheese Segment Performance, 2011
Sales Share
2009 2011
growth change
Segments
% Market % Market
$Mn $Mn % % Point
Share Share
Natural
11,031 61.5 11,732 62.1 6.4 0.6
cheese
Processed
4,570 25.5 4,685 24.8 2.5 -0.7
cheese
Cream
cheese/cream 1,236 6.9 1,341 7.1 8.5 0.2
cheese spread
Cottage
1,104 6.2 1,134 6.0 2.7 -0.2
cheese
Total 17,941 100 18,893 100 5.3 -
Source: Mintel/based on SymphonyIRI Group InfoScan® Reviews; U.S. Bureau of Labor Statistics,
Consumer Expenditure Survey; USDA Economic Research
Figure 2 shows production of the top four cheese types from 1960 to 2010. These
include cheddar, mozzarella, American, and cream and Neuchatel. Very notable in
this chart is the sharp increase in the production of mozzarella; little was produced in
the 1960s, but by 2010, more than 3.5 billion lbs were produced. Cheddar also showed
an upward trend during the same period.
Segment Market Share
Production of other cheese types, graphed separately in Figure 3 and Figure 4
for clarity, also shows a generally increasing trend, especially for provolone, ricotta, and
parmesan. Data for feta and Gouda are tracked separately by USDA starting in 2010
due to the significant increase in their production -- 78 million lbs and 19 million lbs,
respectively, in 2010.
Missouri Artisan Cheeses
13These trends help explain the overall growth in the U.S. cheese industry and
reflect (i) consumers’ preference for food consumed away from home; (ii) the
introduction of new, convenient cheese products, such as re-sealable bags of
shredded cheese; (iii) availability of specialty varieties; and (iv) the increasing
prominence of foreign food such as Hispanic and Italian fares in the American diet (ERS,
2008).
Figure 2: U.S. Cheese Production Mn Lbs (1960-2010)
www.nass.usda.gov
Segment Market Share
Missouri Artisan Cheeses
14Figure 3: Cheese Production Other Cheese Types Mn Lbs (1960-2010)
www.nass.usda.gov
Figure 4: U.S. Cheese Production Italian Cheese Types Mn Lbs (1960-2010)
www.nass.usda.gov
Segment Market Share
In spite of the data tracking issues related to specialty cheeses discussed above,
there have been efforts to estimate its growth and market share. Table 3 shows an
estimate by the California Milk Advisory Board, which puts specialty cheese
consumption at 9 percent of total cheese consumption in 2003 (Reed et al., 2011):
Missouri Artisan Cheeses
15Table 3: Growth and Market Share of U.S. Farmstead and Artisan Cheeses
Type of Cheese
1994 2003 Growth
Consumed
Total cheese 1,800
7,000 8,800
consumption (Mn Lbs) (+26%)
Specialty cheese 420 815 395
consumption (Mn LBs) (6% of total) (9% of total) (+94%)
Total cheese
4.0
consumption per 26.6 30.6
(+15%)
capita (Lbs)
Specialty cheese
1.2
consumption per 1.6 2.8
(+75%)
capita (Lbs)
Source: California Milk Advisory Board, 2004
For purposes of this study, specialty cheese was defined as a “natural cheese that commands a higher
price than a commodity cheese because of its high quality limited production, and value-added
production techniques or ingredients.” This includes varieties commonly designated as specialty cheese;
commodity-type cheese aged 12 months or longer (i.e., Cheddar, Jack); cheeses flavored with
vegetables, fruits or herbs/spices; and Mozzarella packed in water or oil less than 2 weeks old.
2.3. Segment Price Points
Because of the wide array of cheese varieties available in various packaging,
cheese prices are perhaps one of the most difficult commodity groups to aggregate,
report, and analyze. NASS typically reports American and cheddar cheese prices in 40
lb blocks and 500 lb barrels. The USDA Agricultural Marketing Service (AMS), on the
other hand, reports the Chicago Mercantile Exchange (CME) daily cash trading for
cheese barrels and cheese 40 lb blocks, which respectively recorded a closing price of
$1.64/lb and $1.69/lb on Jan. 18, 2013.
AMS also reports prices of some foreign and domestic cheeses.
Table 4 and Table 5 show average prices of these cheese types in 2011 by
region. In addition, AMS reports advertised prices for natural cheese varieties at major
retail supermarket outlets. These are aggregated by region and pack sizes in Table 6
and are reported bi-weekly.
Missouri Artisan Cheeses
16Table 4: Average Wholesale Price ($/lb) of Domestically Produced Cheeses
(January 2012 – December 2012)
MIDWEST (1) NORTHEAST (2) WEST (3)
Domestic Cheese Types Low High Low High Low High
Price Price Price Price Price Price
Blue 5lb 2.37 3.33
Brick And/Or Muenster 5lb 2.11 2.64
Mozzarella 5 - 6lb 1.95 3.15
Process American 5lb loaf 1.88 2.54
Grade A Swiss Cuts 6 - 9lb 2.89 3.12 3.01 3.44
Monterey Jack 10lb 2.08 3.05 2.01 2.17
Cheddar 40lb block 2.11 3.05 2.09 2.38 1.82 2.17
Grade A Swiss cuts 10 - 14lb 3.43 3.75
Muenster 2.11 2.47
Process 5lb sliced 1.87 1.99
Cheddar 10lb cuts 2.00 2.22
Process 5lb loaf 1.78 2.04
Source: http://marketnews.usda.gov/
(1) MIDWEST/CENTRAL: Alabama, Arkansas, Illinois, Indiana, Iowa, Kansas, Kentucky, Louisiana, Michigan, Minnesota,
Mississippi, Missouri, Nebraska, North Dakota, Ohio, Oklahoma, South Dakota, Tennessee, Texas, and Wisconsin.
(2) NORTHEAST: Connecticut, Delaware, Massachusetts, Maryland, Maine, New Hampshire, New jersey, New York,
Pennsylvania, Rhode Island, and Vermont
(3) WEST - Arizona, California, Colorado, Idaho, Montana, Nevada, New Mexico, Oregon, Utah, Washington, and
Wyoming.
Table 5: Average Weekly Wholesale Price ($/lb) of Foreign Cheese Types
(January 2012 – December 2012)
Domestic Price Imported Price
Foreign Cheese Types
Low High Low High
Jarlsberg (Brand) 2.95 5.23
Reggianito (Argentine) 3.29 4.23
Sardo Romano (Argentine) 2.85 3.98
Swiss Cuts Finnish 2.59 2.85
Blue 2.23 3.72 2.64 5.22
Provolone (Italy) 2.27 2.43 3.44 6.04
Gorgonzola 2.73 3.05 3.69 6.33
Romano (cow’s milk) 3.42 5.57
Segment Price Points
Parmesan (Italy) 3.44 4.46
Swiss cuts Switzerland 3.52 3.84
Source: http://marketnews.usda.gov/
Missouri Artisan Cheeses
17Table 6: Advertised Retail Price Ranges of Natural Cheeses in the U.S. ($/lb): 01/28/2013-
02/08/2013
South Southwest Northwest Northeast Southeast Midwest
Central (1) (2) (3) (4) (5) (6)
8oz block 1.67-3.00 1.88-2.50 1.99-2.50 1.99-3.59 1.67-2.79 1.33-2.99
1 LB block 5.00 3.29-5.49 3.88-5.49 2.99-3.99 2.99-5.00 3.99-4.99
2 LB block 5.00-8.99 4.69 5.00-8.99 5.00
8oz shred 1.67-2.99 1.48-3.79 1.99-3.99 1.50-3.50 1.67-2.99 1.33-2.99
1 LB shred 2.99-5.00 3.29 3.99 2.99-5.00 2.99-4.99
Source: National Dairy Retail Report (http://marketnews.usda.gov/)
(1) SOUTH CENTRAL U.S. Arkansas, Colorado, Kansas, Louisiana, Missouri, New Mexico, Oklahoma, and Texas
(2) SOUTHWEST U.S. Arizona, California, Nevada, and Utah
(3) NORTHWEST U.S. Idaho, Montana, Oregon, Washington, and Wyoming
(4) NORTHEAST U.S. Connecticut, Delaware, Massachusetts, Maryland, Maine, New Hampshire, New jersey, New York,
Pennsylvania, Rhode Island, and Vermont
(5) SOUTHEAST U.S. Alabama, Florida, Georgia, Mississippi, North Carolina, South Carolina, Tennessee, Virginia, and West
Virginia
(6) MIDWEST U.S. Iowa, Illinois, Indiana, Kentucky, Michigan, Minnesota, North Dakota, Nebraska, Ohio, South Dakota,
and Wisconsin
Artisan varieties command a substantial premium over the reported prices
above. A market study of Vermont Farmstead Cheeses explains that higher cheese
price is determined by (i) the aging method, (ii) the type of rind, and (iii) the market
value of the label (Sakovitz-Dale, 2006).
A cursory look at U.S. artisan cheeses available for purchase online at Murray’s
prices a pound of the most expensive U.S.-made artisan cheese at $39.99/lb.
Appendix 2 provides a catalogue of Murray’s U.S.-made artisan cheese as of
Feb. 11, 2013. Murray’s is a well-known cheese retailer founded in 1940 by Murray
Greenberg. It prides itself for being “the oldest cheese shop in New York City”
(http://www.murrayscheese.com). In 2008, Murray’s partnered with grocery chain
Kroger and launched the first Murray’s-within-a-Kroger concept, a specialty cheese
shop within a grocery store. By the end of 2012, Kroger had full-service Murray’s cheese
shops within 67 of its stores across the country (Harper, 2013). Grocery chains featuring
specialty cheeses in their deli section is not unique to Kroger. This highlights the
increasing prominence of specialty cheeses in regular shopping venues. In 2011, The
Fiscal Times featured specialty cheeses as one of the “seven grocery items Americans
are blowing money on” adding that “the fancy cheeses are even being added to
once-budget friendly American classics like grilled cheese sandwiches and macaroni
and cheese” (www.thefiscaltimes.com).
Segment Price Points
Missouri Artisan Cheeses
183. U.S. Cheese Consumption
According to the U.S. Department of Agriculture (USDA), per capita cheese
consumption from 1982 to 2012 averaged about 30 lbs. This has increased annually by
2.6 percent and is projected to reach 37 lbs by 2017 (Figure 5). However, U.S. per
capital consumption remains below that in traditional centers of cheese eaters like
France, where per capita consumption currently averages about 54 lbs (Reed et al.,
2011).
Factors driving higher domestic cheese consumption include: “(i) increased
availability of cheese varieties, (ii) expanded cheese use by fast food and pizza
restaurants, (iii) increased use of cheese as an ingredient by both food manufacturers
and home cooks, (iv) increased consumption of ‘cheese-rich’ ethnic foods such as
Italian and Mexican dishes (Manchester and Blayney, 1997), and (v) changes in
consumer demographics. Emphasis on the nutritional benefits of milk and dairy
products has also likely contributed to changes in cheese consumption. The National
Dairy Council’s 3-Every-Day program is an effort designed to encourage people to
consume three servings of low-fat cheese, yogurt, or fluid milk a day in efforts to
improve calcium and other nutritional intakes” (Davis et al., 2011).
Figure 5: U.S. Per Capita Cheese Consumption, 1982-2017
Source: USDA/ERS, Livestock, Dairy, and Poultry Outlook; F APRI, 2008 Agricultural Outlook
On a micro level, two main factors drive individual consumer demand: family
U.S. Cheese Consumption
income and demographic profile.
Mintel reports that “Households with an annual income of $75K-$99.9K are the
most apt to purchase many of the common cheeses, though those from the highest-
income households show a significantly higher likelihood of buying some of the less-
common common cheeses. For example, more than half of those with an annual
household income of $150K+ (52 percent) eat Gouda cheese compared to the 34
Missouri Artisan Cheeses
19percent average, and 46 percent eat Brie cheese compared to the 30 percent
average. They are the least likely to eat American cheese, which, all together, reflects
an interest in quality and flavor with little concern for price.” Table 7 presents cheese
preferences by income bracket.
Table 7: Cheese Consumption by Income Bracket
“Currently, do you or someone in your household eat any of the following types of
cheese? Please select all that apply per option.”
$25K- $50K- $75K- $100K-
Cheese Type All• Those with three or more children are at least 10 percentage points more
likely than average to consider made locally, organic, and award winning
as important claims.
• Consumers aged 18-34, or the so-called Millennials, are more likely to
consider reduced fat, reduced calorie, and reduced lactose or lactose-
free. Specifically, those aged 25-34 consider reduced lactose as
important (26 percent compared to the 19 percent average), and they
are the most interested in cheese that claims to be vegetarian. They are
also 10 percentage points more likely than average to consider kosher as
an important claim, and they’re most likely to eat the less common
cheeses like Gouda, Brie, and Edam as well as try new varieties.
• Most consumers consider the particular type of cheese as important (79
percent), followed by re-sealable packaging (72 percent).
U.S. Cheese Consumption
Missouri Artisan Cheeses
214. Missouri Cheese Consumption
While there are numerous references on factors that characterize cheese
consumption, they focus on national aggregates and seem more applicable to
established cheese-eating regions such as Wisconsin, California, and New York. This
lack of secondary data for Missouri underscored the need for a survey that could
identify marketing opportunities for locally produced cheeses. This section discusses the
survey results and hopes to bridge the information gap on product wants, needs,
buying location preferences, and pricing for Missouri artisan cheeses.
4.1. Survey Design and Methodology
The questionnaire used for this survey, which can be found in the appendix, was
disseminated through e-Rewards, one of the world’s leading opinion panels that
rewards its members for taking surveys. Having worked with e-Rewards on previous
projects, the authors of this market study are confident that the data gathered by
e-Reward are reliable. Respondent selection was designed to ensure collection of
valuable insights and reliable generalizations on artisan cheese consumption for the
Missouri market.
The survey collected responses from 1,079 Missouri residents. The map below
displays that noticeable clusters of the respondents reside in the St. Louis and Kansas
City areas, but other areas are also well-represented.
Survey Design and Methodology
The respondent profile is summarized below:
• 54.4 percent were female, and 45.6 percent were male.
Missouri Artisan Cheeses
22• Almost 60 percent of the participants were between the ages of 35 and
64.
• Ninety-three percent of respondents are white.
• Highest level of education is distributed as follows: 24 percent are high
school graduates, 13.7 percent have associate degrees, 37.7 percent
have bachelor’s degrees, 16.9 percent have master’s degrees, and 7
percent have doctoral degrees.
• Distribution according to income is as follows: 10.3 percent make $0 to
$25,000, 21.1 percent make $26,000 to $50,000, 21.5 percent make $51,000
to $75,000, 19.2 percent make $76,000 to $100,000, and 27.9 percent
make more than $100,000.
4.2. Survey Results and Insights
4.2.1. Frequency of Cheese Consumption
Reflecting the increasing significance of cheese in local consumers’ diets,
87 percent of respondents said they eat cheese at least weekly. Less than a
percent said they “never” eat cheese and cited lactose intolerance and allergic
to cheese products as reasons. The frequency of cheese consumption is broken
down by demographic profile in Table 8. Across demographic characteristics, a
majority of respondents are frequent cheese eaters, i.e., they eat cheese at least
weekly.
Missouri Artisan Cheeses
23Table 8: Frequency of Consumption by Demographic Profile
Sometimes Never Eat
Frequent (1)
(2) Cheese
Gender
Female 89% 11% 1%
Male 86% 13% 1%
Age
24 and under 90% 7% 2%
25-34 87% 12% 1%
35-44 87% 13% 0%
45-54 89% 10% 1%
55-64 88% 11% 1%
65 and older 84% 15% 1%
Race
White 88% 11% 1%
Other 70% 28% 1%
Education Level
Less than high school
Degree 57% 43% 0%
High school graduate 85% 13% 1%
Associate's degree 89% 11% 0%
Bachelor's degree 87% 12% 1%
Master's degree 91% 9% 1%
Doctoral degree 86% 9% 4%
Income
$0-$25,000 83% 14% 3%
$26,000-$50,000 83% 16% 0%
$51,000-$75,000 91% 8% 1%
$76,000-$100,000 86% 14% 1%
More than $100,000 90% 9% 1%
(1) Frequent: at least weekly
(2) Sometimes: once per month, twice per month or less than once per month Frequency of Cheese Consumption
To shed light on which specific demographic segments to target, Figure 6
further breaks down higher or more frequent cheese consumption according to
their demographic characteristics. The charts show that:
• Females account for a higher percentage of those who eat cheese at
least once a week (55 percent vs. 45 percent). However, there does not
appear to be a significant distinction as males also account for 67
percent of those who eat cheese once per month.
• More than 90 percent are white.
Missouri Artisan Cheeses
24• Higher educational attainment tends to be associated with frequency of
consumption. Respondents who have less than a high school degree
account for marginal (0.4 percent) of those who eat cheese at least
weekly.
Figure 6: Distribution of Respondents Who Consume Cheese
“At Least Weekly”
4.2.2. Reasons for Eating Cheese
Figure 7 shows that 70 percent of respondents eat cheese because they like
the taste of cheese, which underscores the importance of flavor. This is
consistent with industry reports that “continue to show that flavor … drives
consumer sales of cheese in the United States” (Highbeam Industry Report).
Taste is followed by “It goes well with other food” (19 percent). Not shown in
Reasons for Eating Cheese
the graph but cited in other comments are good source of calcium, “I love
cheese,” and good substitute for meat.
Missouri Artisan Cheeses
25Figure 7: Reasons for Eating Cheese
4.2.3. Well-Liked Cheeses
Table 9 shows the percentage distribution of cheese eaters with respect to
the top three cheese types they enjoy the most.
Cheeses commonly used as sandwich stuffers as well cooking ingredients
unsurprisingly ranked high in the list. According to industry reports, four-fifths of
cheese is consumed on sandwiches or in foods that contain cheese. This explains
the growing array of selection and availability of pre-sliced cheeses, both in the
dairy aisle and at the deli counter (Highbeam Industry Report, 2010).
In addition, 2 percent of respondents also specifically identified provel, a
white processed cheese that is known as a traditional topping for St. Louis-style
pizza. Other types mentioned in the unaided recall list specified by a significant
number of respondents are parmesan (3 percent), feta (3 percent), American (2
percent) and goat/chevre (2 percent). Also specified by some respondents are
Harvarti, asiago, Pecorino, Edam, Monterey jack, Gorgonzola, Gruyere,
Manchego, Camembert, Gouda, and Mexican cheeses. Well‐Liked Cheeses
Missouri Artisan Cheeses
26Table 9: Top Three Popular Cheese Types
Question: “I enjoy the following types of cheeses: (Select the top three.)”
Type of Cheese % of Total Cheese Eaters (N=1,040)
Mozzarella 69%
Sharp cheddar 67%
Mild cheddar 62%
Provolone 62%
Colby 62%
Swiss 60%
Pepper jack 50%
Gouda 31%
Blue 28%
Brie 24%
Muenster 23%
In terms of preferences for cheese texture or moisture content, it appears
that hard cheeses are favored more than the other varieties. Eighty-two percent
of respondents indicated that they prefer hard cheeses such as Swiss. Table 10
presents the cheese texture preferences of respondents.
Table 10: Most Preferred Cheese Textures
Question: “I prefer…” (Please select all that apply.)
% of Total Cheese
Texture Eaters (N=1,040)
Hard - some have holes, e.g., Swiss 82%
Very hard - usually eaten ground, e.g., parmesan 49%
Semi-soft - often with streaks of blue mold that make
a special flavor 43%
Soft - e.g., brie 39%
4.2.4. Consumption and Purchase of Artisan Cheeses
Zeroing-in on the artisan cheese category, Table 11 shows that though a
significant percentage of cheeseeaters buy artisan cheese, a majority indicated
that they do not buy artisan cheeses. For instance, of those who eat cheese at
least weekly, 44 percent said that they buy artisan cheese. The remaining
respondents (56 percent) said that they do not buy artisan cheese. This trend
appears to be the case across all consumption frequency categories.
Missouri Artisan Cheeses
27Table 11: Purchase of Artisan Cheese by Frequency of Cheese Consumption
Question: “Do you purchase artisan cheese?”
Purchase Artisan Cheese?
Frequency of Cheese Consumption No (N=618) Yes (N=440)
At least weekly 56% 44%
Twice per month 70% 30%
Once per month 73% 27%
Less than once per month 89% 11%
TOTAL 58% 42%
When prompted to select the reasons why they would not purchase artisan
cheeses, 52 percent of the respondents chose “I don’t know what artisan cheese
is” followed by “It’s too expensive” (27 percent). Unfamiliarity with artisan
cheeses is further emphasized by respondents who explained why they would
not buy the artisan varieties. Sixty-five percent of these unaided responses
include variations of the “I don’t know what artisan is” statement. Examples are
“I don’t know what it looks like or don’t know if I had it,” “I do not know where it is
available”, “I have not tried it,” “I have not found samples,” and “Maybe too
expensive.” These statements call attention to the need for marketing or an
information campaign that will help introduce artisan cheeses to consumers to
initiate patronage of this product category.
Interestingly, 15 percent of the respondents chose “it is not available in my
area.” This calls attention to the need to identify accessible retail channels within
Missouri that can provide artisan cheese access to consumers already interested
in artisan cheese. Table 12 presents the other reasons along with the
corresponding percentages.
Table 12: Reasons for Not Consuming Artisan Cheese
Question: “For what reasons do you not consume artisan cheese? (Select all
that apply.)”
Consumption and Purchase of Artisan Cheeses
% of Total Who Do Not Buy
Reasons Artisan Cheese (N=618)
I don't know what artisan cheese is. 52%
It's too expensive. 27%
Artisan cheese is not available in my area. 15%
It's not an important product attribute. 14%
I don't like the taste of artisan cheese. 5%
It's not available in the varieties that I like. 3%
The table below shows that one-third of Missouri artisan cheese consumers
consume artisan cheese as a snack. This is followed by “used as complement
with other product (i.e., wine), which explains the proliferation of websites on
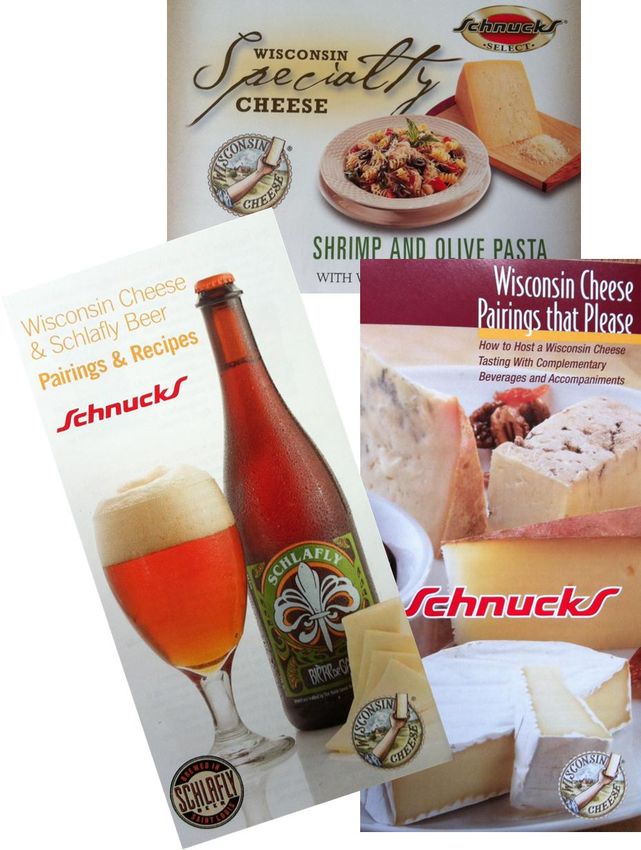
wine and cheese pairings. Appendix 4 shows a sample brochure displayed in
Missouri Artisan Cheeses
28You can also read