SRI LANKA SELECTED ISSUES
←
→
Page content transcription
If your browser does not render page correctly, please read the page content below
IMF Country Report No. 18/176

            SRI LANKA
            SELECTED ISSUES
June 2018
            This Selected Issues paper on Sri Lanka was prepared by a staff team of the International
            Monetary Fund as background documentation for the periodic consultation with the
            member country. It is based on the information available at the time it was completed on
            May 17, 2018.

                              Copies of this report are available to the public from

                              International Monetary Fund • Publication Services
                                    PO Box 92780 • Washington, D.C. 20090
                               Telephone: (202) 623-7430 • Fax: (202) 623-7201
                            E-mail: publications@imf.org Web: http://www.imf.org
                                         Price: $18.00 per printed copy

                                     International Monetary Fund
                                           Washington, D.C.

            © 2018 International Monetary Fund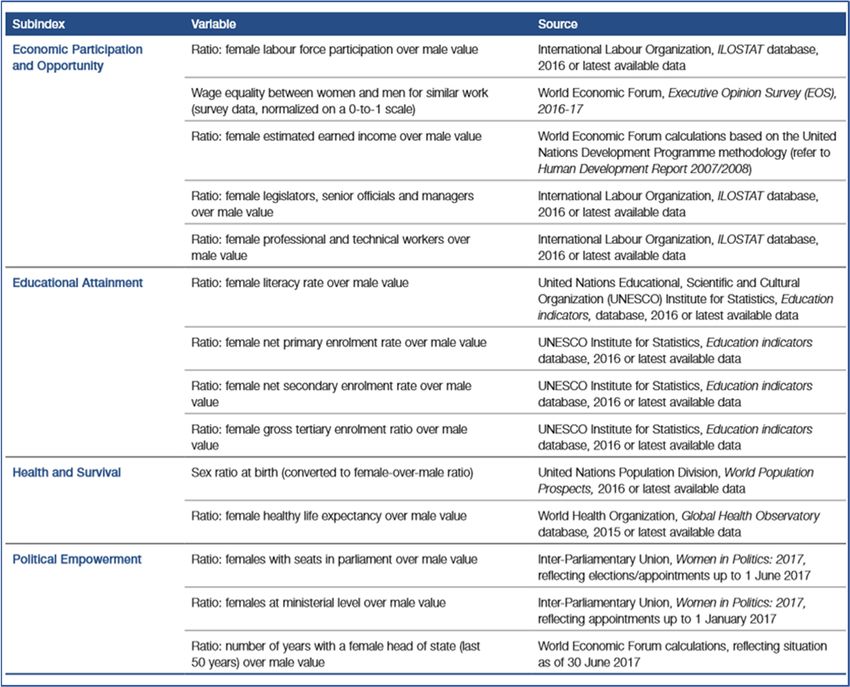
SRI LANKA
               SELECTED ISSUES
May 17, 2018

                 Approved By                 Prepared by Sarwat Jahan, Eteri Kvintradze, Masahiro Nozaki,
                 Asia and Pacific            Amitha Sundararaj (all APD), Jeff Danforth (FAD), Peter
                 Department                  Lindner (MCM), Misa Takebe (SPR), and Samantha Cook
                                             (World Bank).

                  CONTENTS

               SRI LANKA: STRUCTURAL TRANSFORMATION—THE NEW FRONTIER ____________ 4
               A. Growth Story _________________________________________________________________________ 4
               B. Competitive Challenges and Opportunities __________________________________________ 9
               C. Conclusions _________________________________________________________________________ 16
               References _____________________________________________________________________________ 24

               TABLE
               1. Economic Policy Orientation, 1970–2018 _____________________________________________ 5

               BOXES
               1. Summary of Trade Reforms Under the World Bank Program _______________________ 12
               2. Estimation of the Impact of Structural Reforms in Emerging Market Economies ___ 14

               ANNEXES
               I. TFP Accounting and Data Sources ___________________________________________________ 18
               II. Export Structure _____________________________________________________________________ 23

               FEMALE LABOR FORCE PARTICIPATION: A NEW ENGINE OF GROWTH FOR
               SRI LANKA? ___________________________________________________________________________ 26
               A. The Gender Gap _____________________________________________________________________ 26
               B. Macroeconomic Impact of Female Labor Force Participation on Growth ___________ 29
               C. Policies to Close the Gender Gap ___________________________________________________ 32
               D. Conclusions _________________________________________________________________________ 38
               References _____________________________________________________________________________ 41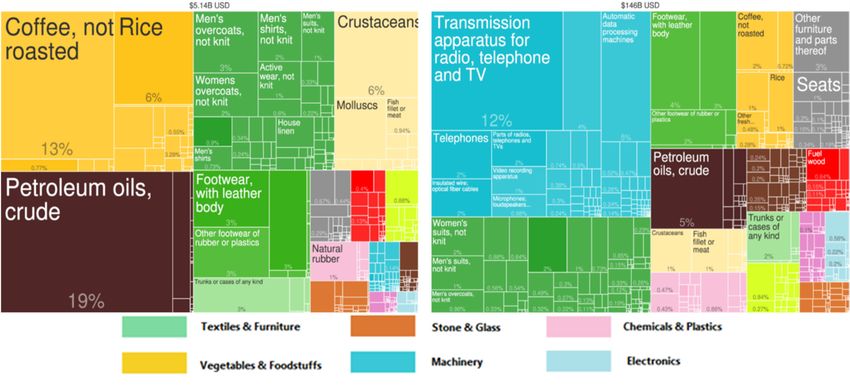
SRI LANKA

            FIGURE
            1. A Snapshot of Gender Parity in Sri Lanka ____________________________________________ 27

            ANNEXES
            I. Structure of the Global Gender Gap Index ___________________________________________ 39
            II. Measures Outlined in 2018 Budget to Achieve Gender Equality ____________________ 40

            COPING WITH NATURAL DISASTER RISKS IN SRI LANKA _________________________ 43
            A. Introduction _________________________________________________________________________ 43
            B. Developing National Disaster Risk Management Framework _______________________ 44
            C. Near-Term Options to Mitigate Disaster Financing Risks ___________________________ 47
            D. Conclusions _________________________________________________________________________ 51
            References _____________________________________________________________________________ 52

            BOXES
            1. Innovative Transfer Options _________________________________________________________ 46
            2. Use of Dedicated Contingency Funds _______________________________________________ 48
            3. Mexico's Natural Disaster Fund (FONDEN) _________________________________________ 49

            SRI LANKA'S CREDIT EXPANSION: ENGINEERING A SOFT LANDING WHILE
            FINANCING GROWTH? _______________________________________________________________ 53
            A. Current State of Credit Growth ______________________________________________________ 53
            B. Assessing Underlying Risks in the Financial Sector __________________________________ 55
            C. Policy Response _____________________________________________________________________ 57
            D. Conclusions _________________________________________________________________________ 60
            References _____________________________________________________________________________ 61

            FIGURE
            1. Current State of Credit Growth in Sri Lanka _________________________________________ 54

            TOWARD SECOND-GENERATION FISCAL RULES IN SRI LANKA ___________________ 62
            A. Background _________________________________________________________________________ 62
            B. Principles Underpinning Effective Fiscal Rules _______________________________________ 63
            C. Rule Calibration _____________________________________________________________________ 65
            D. Additional Design Features for Effective Fiscal Rules ________________________________ 69
            E. Conclusions __________________________________________________________________________ 72
            References _____________________________________________________________________________ 77

2   INTERNATIONAL MONETARY FUND
SRI LANKA

ANNEXES
I. Deriving the Debt Ceiling Threshold _________________________________________________ 73
II. Fiscal Reaction Function ____________________________________________________________ 75
III. Estimating the Stock-Flow Adjustment _____________________________________________ 76

                                                     INTERNATIONAL MONETARY FUND         3
SRI LANKA

SRI LANKA: STRUCTURAL TRANSFORMATION—THE
NEW FRONTIER1
With its relatively static trade structure, Sri Lanka lacks the economic complexity and diversification
expected of a middle-income Asian economy. Simplifying tax policy, gradually liberalizing tariffs and
para-tariffs, and easing the regulatory burden on businesses could help restore competitiveness,
private-sector dynamism, and increase the country’s productivity.

1.       Sri Lanka is ready to shift towards more private-sector-led growth, building on its
significant upgrade in infrastructure after the war and ongoing reform efforts. Sri Lanka has
gone through defining transitions over the past decade. In 2009, the country embarked in a major
post-war scale up of infrastructure in a relatively brief period. Reforms continued in 2015, following a
peaceful and democratic transition of power to the coalition government. The current economic
environment offers a window of opportunity for evaluating remaining structural weaknesses and
working towards macro-economic resilience and enhancing competitiveness. Among others,
simplification of tax systems, including trade tariffs and para-tariffs, through predictable, fair, and
automated mechanisms, can remove uncertainties that hold back trade and investment decisions
and support the needed shift towards more private sector-led growth. Stable and transparent
regulatory systems would also make Sri Lanka’s business environment more attractive for long-term
foreign investment and support trade integration.

A. Growth Story

2.      Sri Lanka has a compelling growth story. The economy has grown at an average of
5 percent over the last four decades, amidst the 30-year civil conflict, weather calamities, and swings
in economic policy orientation depending on ruling parties’ ideology. Sri Lanka seesawed between
protectionist and liberalization strategies: state control and import substitution in early 70s; two
waves of liberalization in early 80s and 90s; closing up again in early 2000s at the height of the war;
and then opening up again since the end of the war (text table below).

3.       Strong economic growth has led to a significant decline in poverty rates (text table
below). While a recent IMF study (IMF, forthcoming) finds that emerging markets experienced a
significant increase in average growth rates in the 2000s, particularly in Asia, only half of these
emerging markets are converging with developed countries in per capita income levels. Remarkably,
Sri Lanka has halved its poverty gap over the last decade. Nevertheless, challenges in terms of
inclusiveness, regional disparities, quality of education, and gender equality remain.2

1
    Prepared by Eteri Kvintradze, Amitha Sundararaj, and Misa Takebe.
2
    World Bank (2015a).

4       INTERNATIONAL MONETARY FUND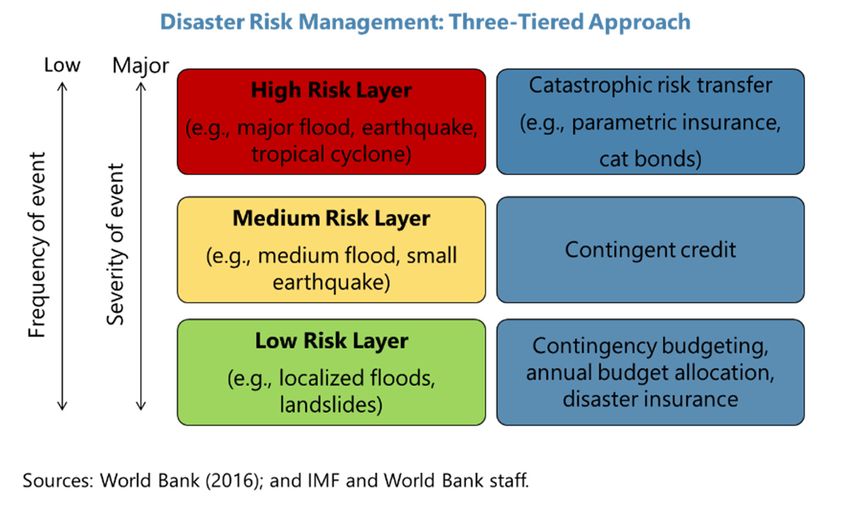
SRI LANKA

                         Table 1. Sri Lanka: Economic Policy Orientation 1970–20181

1
    Athukorala and Rajapatirana, S. (2000) and Athukorala (2017).

                                                                    INTERNATIONAL MONETARY FUND     5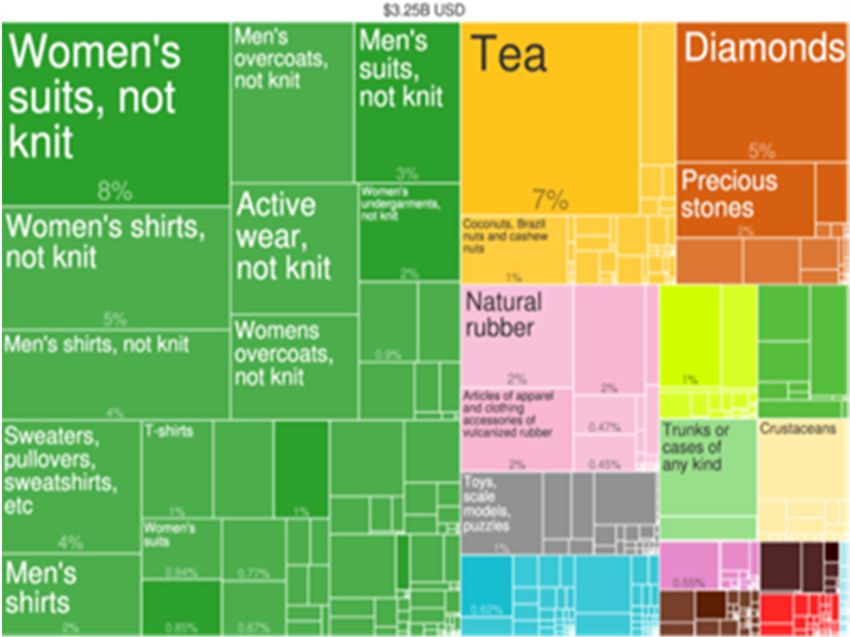
SRI LANKA

                                Sri Lanka: Poverty and Inequality, 2002-2016
                                                                              2006/     2009/       2012/
                                                                   2002                                         2016
                                                                               2007      2010        2013
    Poverty indicators
    Poverty headcount ratio (percent of population)
     US$1.90 a day (2011 PPP)                                        8.3         3.8       2.4        1.9         0.7
     National poverty lines                                         22.7       15.3        8.9        6.7         4.1
    Poverty gap (percent)                                            5.1         3.1       1.7        1.2         0.6
    Severity (percent)                                               1.6         0.9       0.5        0.3         0.1
    Inequality indicators
    Gini coefficient                                                0.40       0.40       0.36       0.39        0.45
    Theil index                                                     0.32       0.33       0.27       0.32         …
    p90/p10 ratio                                                   5.12        4.98      4.30       4.74         …
    Source: World Bank (2016) and Department of Census and Statistics - HIES 2016.

4.      The remainder of the paper is organized as follows. A growth accounting framework is
used in this section to investigate the main sources of growth in Sri Lanka during the period of 1960-
2016, including through sectoral decomposition and reallocation effects. The following section
presents an overview of competitiveness challenges and reform opportunities going forward.

Aggregate TFP Accounting

5.       A simple Solow residual growth accounting shows that capital was the most important
contributor to growth over the past five decades.3 Capital accumulation peaked after the trade
and economic policy liberalization
                                        Total Factor Productivity Residual
of the late-70s driven by FDI
                                        (Average across time period, in percent)
inflows, dropped during the war,      4
and picked up again with the                      Emerging Markets Average (IMF 2018)
                                      3
reconstruction since 2010. With the               Sri Lanka
                                      2
opening up of the economy in the
70s, TFP contribution to growth also  1
improved considerably reaching        0
about 3 percent even during the      -1
height of the war (text table) and   -2
exceeded the average for emerging           1961-70     1971-80     1981-90      1991-00 2001-10
markets.                              Source: IMF (2018) and staff calculations.

3See Annex I for different methods of growth accounting, description of data sources, utilization rates, and sensitivity
analysis.

6     INTERNATIONAL MONETARY FUND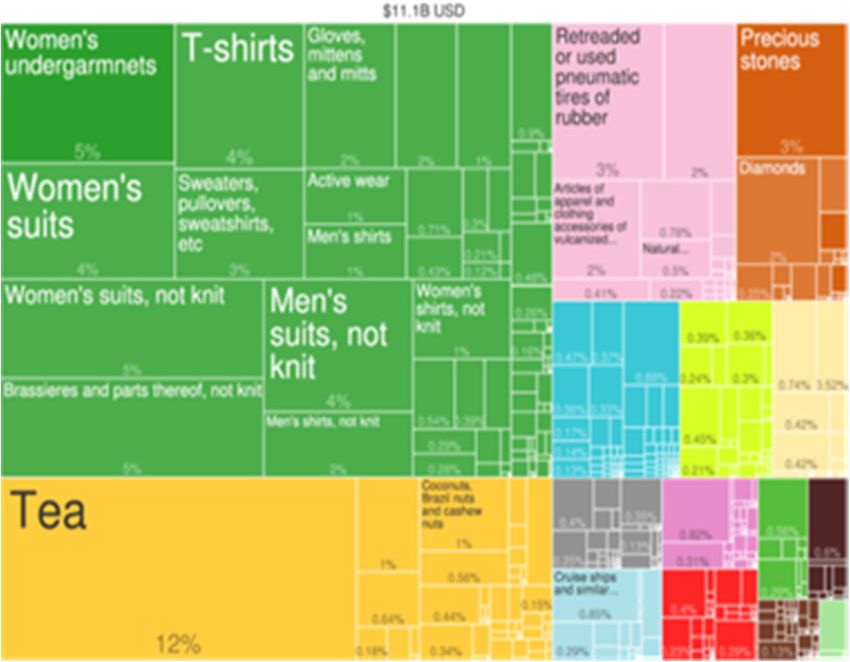
SRI LANKA

6.      The war is also found to have significantly affected production factor utilization rates.
Factor utilization adjustment is a relevant concept in empirical studies of re-organization of
production structures in an economy due to a war or a major economic transition.4 It allows to
better capture factor contributions versus TFP residual and separate contribution of sectoral
reallocation effects discussed later in the section. In the case of Sri Lanka, capital utilization rates
have dropped considerably at the peak of the war, while labor utilization rates have also been
possibly affected by recurrent natural disasters (Annex I).

                          Sri Lanka: Sources of Growth – Solow Residual, 1961-2016
                                        (Average growth rate, in percent)
                                                                                                     Contribution of:
                               Output      Employment              Capital      Output per        Capital per          Factor
                                                                                   Worker            Worker       Productivity
    1961-70                          4.7             2.5               9.5             2.2                2.1              0.1
    1971-77                          2.9             1.7               9.0             1.2                2.2             -1.0
    1978-87                          5.4             2.9             11.0              2.5                2.4              0.1
    1988-02                          4.6             1.1               4.5             3.5                1.0              2.5
    2003-09                          6.0             1.6               5.4             4.3                1.1              3.2
    2010-16                          6.3             1.1               7.8             5.1                2.0              3.1
    Sources: Central Bank of Sri Lanka, World Development Indicators, Penn World Tables and staff calculations.

7.      However, the post-war capital injection does not appear to have resulted in immediate
TFP enhancements, taking factor utilization rates into account. The contribution of capital
accumulation to growth picked up during the post-war reconstruction period, driven by mega-scale
public infrastructure development projects. Interestingly, the TFP residual halved during this period
and has continued to decline in recent years.5 Unlike the 70-80s when capital deepening was mainly
driven by investments in tradable sectors and followed by a significant productivity pick up,6 the
nature of the post-war capital deepening was different, mainly driven by mega-scale infrastructure
projects financed by the public sector and FDI remained stagnant, below 2 percent of GDP since
1998 (text table below).7 Reforms to ease the business environment and trade are still at the early
stages of implementation. As showed by other episodes of infrastructure scale-up in different
countries, business environment liberalization is an important catalyst of private sector led growth.8

4 Blanchard and Kremer (1997) predict that disorganization releases production inputs which are reallocated to other

sectors less susceptible to disorganization. The process of reallocation is gradual and disorganization ends once old
relationships are reorganized. Empirical studies of disorganization use utilization adjustment to better capture factor
contributions and reallocation effects on growth. Utilization adjusted TFP residual could be lower or higher than a
simple Solow residual depending on the downward or upward trends in utilization rates. For example, higher capacity
utilization rates will result in increased capital contribution to growth compared to lower utilization rates.
5 See IMF Country Report No. 17/253, Box 2 (https://www.imf.org/en/Publications/CR/Issues/2017/08/10/Sri-Lanka-

Second-Review-under-the-Extended-Arrangement-under-the-Extended-Fund-Facility-45178).
6 Athukorala and Rajapatirana (2000).
7 FDI new inflows dropped to 1.1 percent of GDP in 2016, compared, for example, to 6.1 percent of GDP in Vietnam
for the same period (WDI).
8   April 2015 World Economic Outlook, Chapter 3 (http://www.imf.org/external/pubs/ft/weo/2015/01/).

                                                                                  INTERNATIONAL MONETARY FUND                 7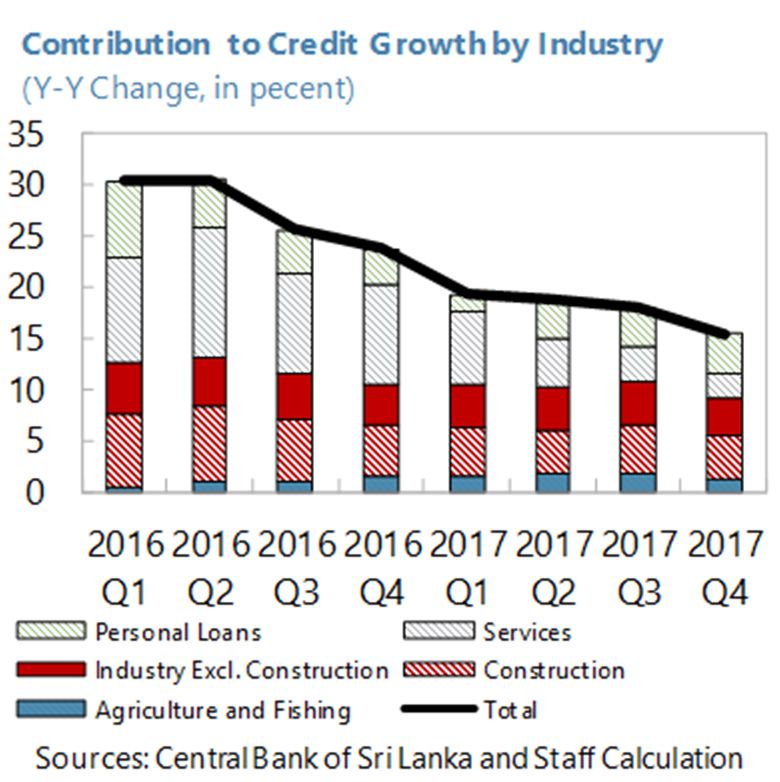
SRI LANKA

                       Sri Lanka: Sources of Growth, Adjusted for Utilization, 1961-2016
                                        (Average growth rate, in percent)
                                                                                                                            Contribution of:
                                  Output        Employment                  Capital        Output per         Capital per            Factor
                                                                                  Worker             Worker                     Productivity
    1961-70                          4.7              …                 …               …                  …                              …
    1971-77                          2.9             5.2               7.7            -2.3                0.7                          -3.0
    1978-87                          5.4             2.8             14.2              2.6                3.4                          -0.8
    1988-02                          4.6             1.0               4.7             3.6                1.1                            2.5
    2003-09                          6.0             1.9               1.7             4.1               -0.1                            4.1
    2010-16                          6.3             0.9             12.0              5.4                3.3                            2.1
    Sources: Central Bank of Sri Lanka, World Development Indicators, Penn World Tables and staff calculations.

Sectoral Decomposition and Factor Reallocation

8.       Sri Lanka’s economic structure has also changed over the years. The contribution of
agriculture to output and employment declined over the years as labor moved to manufacturing and
other sectors. While agriculture and manufacturing employ a significant share of the population,
services, construction, and other sectors have become with time the main employers and output
drivers in Sri Lanka (text table below).

                                            Sri Lanka: Sectoral Shares, 1960-2016
                                                          (In percent)
                                Sectoral Shares in Output                                       Sectoral Shares in Employment
                  Agriculture        Manufacturing      All Other Sectors             Agriculture       Manufacturing     All Other Sectors

      1960*            26                   16                 58                         53                  9                  38
       1971            22                   19                 59                         49                  9                  42
       1978            21                   16                 63                         49                 12                  39
       1988            17                   17                 66                         45                 13                  42
       1990            17                   18                 65                         45                 13                  42
       2003            11                   21                 68                         32                 16                  53
       2010             9                   20                 70                         31                 16                  54
       2016             8                   17                 75                         25                 17                  58
    Source: Central Bank of Sri Lanka and Penn World Tables.
    Notes: other sectors are construction, quarrying and mining, and services.
    * Sectoral Share in Employment as of 1963.

9.      The productivity of the manufacturing sector has been declining since the 1990s.
Manufacturing sector TFP has dropped despite growing capital investments.9 In 2010–2016, capital
per worker in manufacturing sector almost doubled, while TFP has significantly declined. The recent
agricultural growth was mainly driven by better access to land in the Eastern and Northern provinces
previously affected by the conflict. Construction and services are the fastest growing sectors with the
highest productivity rates. Expansion of real estate, logistics, transport, and tourism related services
quickly followed the post-war infrastructure scale up (text table below).

9   The largest manufacturing subsectors are food and beverages, textiles, rubber, and chemicals.

8       INTERNATIONAL MONETARY FUND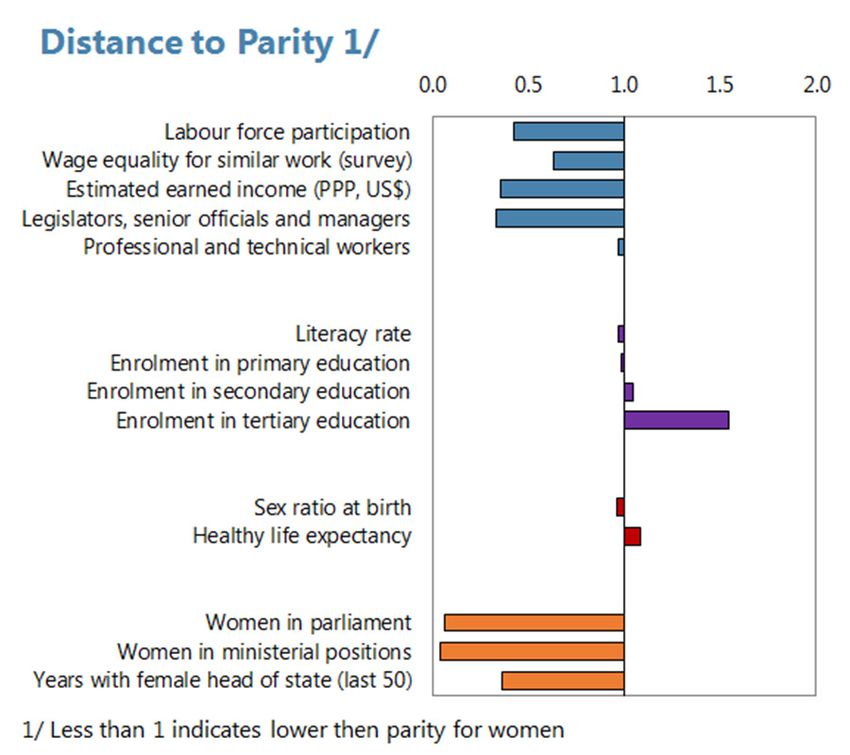
SRI LANKA

                   Sri Lanka: Sectoral Growth Accounting, Adjusted for Utilization, 1990-2016
                                          (Average growth rate, in percent)
                                                                                                                                         Contribution of:
                                               Output            Employment                  Capital           Output per             Capital per              Factor
                                                                                                                  Worker                 Worker           Productivity
       Agriculture Sector
              1990-2002                             2.0                  -1.2                    4.6                   3.3                   1.8                   1.5
              2003-2009                             3.4                   1.0                    0.3                   2.5                  -0.2                   2.7
              2010-2016                             3.4                  -1.8                   12.6                   5.2                   4.3                   0.9
       Manufacturing Sector
              1990-2002                             6.7                   3.2                    2.1                   3.5                  -0.3                   3.8
              2003-2009                             5.1                   2.5                    5.5                   2.6                   0.9                   1.7
              2010-2016                             3.6                   1.0                    8.2                   2.6                   2.2                   0.5
       All Other Sectors (Construction and Services)
              1990-2002                             5.0                   2.8                    4.6                   2.2                   0.6                   1.7
              2003-2009                             6.6                   2.4                    1.6                   4.3                  -0.2                   4.5
              2010-2016                             7.3                   2.2                   12.1                   5.1                   3.0                   2.1
       Sources: Central Bank of Sri Lanka, Department of Census and Statistics, Food and Agriculture Organization, Penn World Tables and staff calculations.

10.     The shift of employment towards more productive sectors has benefited overall
productivity. The factor reallocation effect on overall growth has been positive and increased after
the war. Labor has moved from relatively low productive sectors such as agriculture and
manufacturing to more productive services and construction (text table below). The positive
contribution of factor reallocation to growth has doubled since the war, after an almost three-fold
drop during the war due to physical restrictions in affected regions.

                  Sri Lanka: Reallocation Effect on Growth Adjusted for Utilization, 1990-2016
                                         (Average growth rate, in percent)

                                    Output per Worker                                                        Contribution to Growth
                   Agriculture Manufacturing   All other sectors                   Total   Agriculture Manufacturing All other sectors                     Reallocation
     1990-2002               3.3          3.5                  2.2                     3.8           0.5          0.6                1.5                              1.2
     2003-2009               2.5          2.6                  4.3                     4.1           0.3          0.5                2.9                              0.4
     2010-2016               5.2          2.6                  5.1                     5.4           0.5          0.5                3.6                              0.8
     Source: Staff calculations.

B. Competitiveness Challenges and Opportunities10

Trade Openness

11.     Despite significant productivity growth in the post-war period, Sri Lanka has not been
able to diversify exports and its share in global trade has been declining gradually. Unlike its
East Asian neighbors, Sri Lanka’s export structure has not changed in decades and remains

10This section uses five perception-based indicators (Doing Business Indicators by the World Bank, Global
Competitiveness Index and Perceived Infrastructure Quality Index by the World Economic Forum, International Trade
Center series on non-tariff measures, and Worldwide Governance Indicators by the Brookings Institution and the
World Bank). The accuracy of the indicators can be biased by experts’ views. These non-IMF indicators provide
qualitative information but do not represent the IMF’s assessment.

                                                                                                               INTERNATIONAL MONETARY FUND                               9
SRI LANKA concentrated on garments, tea, and rubber products (Annex II). The static export structure reflects lack of competitive forces to drive trade dynamism, innovation, and diversification. 12. Sri Lanka’s weakness in trade competitiveness partly stems from its restrictive trade policies. According to trade policy indicators recently developed by the IMF, Sri Lanka’s trade and FDI regimes are more restrictive than the average emerging market in all key areas.11 In particular, the country is more distant from the emerging market average in the categories of trade facilitation performance and ease of starting a foreign business.12 These findings are consistent with those of the World Economic Forum’s Enabling Trade Index 2016, which scores Sri Lanka at 4.1 out of 7 mainly due to market access, tariff rates and tariffs faced in destination markets. 13. The introduction of para-tariffs has significantly increased the degree of protectionism. Introduction of para-tariffs13 during the last decade has effectively doubled the protection rates making the present import regime one of the most complex and protectionist in the world.14 Para-tariffs not only increase monetary costs for firms but also procedural costs. A recent survey by the International Trade Center15 finds that the biggest challenges from para-tariffs are lack of information and extensive documentation as well as delays in processing, which is particularly hard to bear for small firms. 11The indicators are designed to help assessing three key trade policy areas (trade in goods, trade in services, and FDI) by marking 0 to the country with the most restrictive value and 1 to the country with the least restrictive value among 96 countries. For more details, please see Cerdeiro and Nam (2018). 12Trade facilitation performance is the average of 11 dimensions of the World Trade Organization’s Trade Facilitation Agreement (such as information availability, appeal procedures, fees and charges, and documentation formalities). The MFN tariff in the indicators does not cover para tariffs, which play an important role in Sri Lanka. 13Para-tariffs are non-tariff barriers to trade and include the Ports and Airports Development Levy (PAL), the Commodity Export Subsidy Scheme (CESS), and the Special Commodity Levy (SCL). The Export Development Board (EDB) Levy, which was another type of para-tariffs, was eliminated 2012. 14 The increase in para-tariffs was not only to protect domestic industries but also to support the declining revenue base. 15 A survey was conducted by International Trade Center covering over 500 businesses on their views regarding non- tariff measures. The results can be accessed through http://www.intracen.org/publications/ntm/SriLanka/. 10 INTERNATIONAL MONETARY FUND
SRI LANKA

14.      The most protected segments of the economy benefit from both high tariffs and para-
tariffs. In addition, some sub-sectors have a third layer of protection on their inputs through
selected tax holidays or exemptions. Consequently, the effective rate of protection (ERP) for the top
10 most protected sectors reach between 170 and 524 percent as of 2015 (text table).16 Interestingly,
some of the most protected sectors do not necessarily represent strategic development or high
employment activities, but
appear effective in lobbying for                 Sri Lanka: Effective Rates of Protection
protection. Moreover, the
             17
                                         (Ranking across 105 sub-sectors, 1 = highest rate, 2015)
increase in the web of protective       105
barriers seem to coincide with           90

                                             ERP on Para-Tariffs
the decline in total contribution        75
of state-owned establishments            60

to sectoral value added (text            45
                                         30
table below). Furthermore, it
                                         15
appears that the government
                                          0
gave up direct ownership in
                                             0      15       30      45        60   75      90   105
some sectors, but
                                                                    ERP on Tariffs
simultaneously ensured the            Source: Department of Census and Statistics.
lasting protection of private
companies in those same sectors.

                     Sri Lanka: Top Ten Most Protected Sectors in Manufacturing, 2015
                                        (ERP range: 170-524 percent)

     Ranking    Sector
        1       Processing and preserving of fruit and vegetables
        2       Manufacture of bakery products
        3       Manufacture of macaroni, noodles, couscous and similar farinaceous products
        4       Manufacture of refined petroleum products
        5       Manufacture of refractory products
        6       Distilling, rectifying and blending of spirits & Manufacture of wines
        7       Manufacture of other porcelain and ceramic products
        8       Manufacture of articles of concrete, cement and plaster
        9       Manufacture of soft drinks; production of mineral waters and other bottled waters
       10       Manufacture of dairy products
     Source: Department of Census and Statistics and Staff Calculations

16 The Effective Rate of Protection (ERP) is calculated by Department of Census and Statistics and is defined as the
difference between value added (per unit of output) in domestic prices and value added in world prices, expressed as
a percentage of the latter. See Annex I.
17   Protection is granted by tariff, non-tariff, and/or tax exemptions.

                                                                           INTERNATIONAL MONETARY FUND           11
SRI LANKA
Sri Lanka: Contribution of Government Establishments in
Manufacturing Value Added, 1970-2014
(In percent of total value added)
1970 1974 1981 1988 1993 1998 2005 2010 2014
Food, beverages and tobacco products 24 42 42 44 17 19 7 3 2
Textiles, wearing apparel and leather products 11 37 72 39 1 11 0 0 0
Wood and wood products 73 92 92 74 46 35 14 27 63
Paper and paper products 43 69 66 45 38 19 3 2 0
Chemical and chemical products, rubber and plastic products 46 70 43 28 3 16 5 14 3
Non-metallic mineral products 72 82 87 60 28 50 3 1 0
Basic metals, machinery and transport equipment 87 91 46 31 15 8 0 0 0
Total Manufacturing 30 66 64 42 10 17 2 3 2
Sources: Athukorala and Rajapathirana (2000) and Department of Census and Statistics.
15. In order to address these challenges, as part of the Vision 2025 priorities, the
government announced that it will adopt a time-bound plan to eliminate para-tariffs and
conduct a comprehensive review of tariffs. The government has committed to eliminate 1200
lines of para-tariffs in the 2018 budget and is developing a 3-year plan to fully phase out remaining
para-tariffs through subsequent budgets. Policy discussions are ongoing on a comprehensive review
of tariffs and developing a time-bound plan for convergence to a relatively simplified structure.
Streamlining the administrative processes and simplifying the structure of para-tariffs and tariffs will
have a beneficial impact on trade.
Box 1. Summary of Trade Reforms under the World Bank Program1
Sri Lanka launched various reforms under the World Bank’s trade and competitiveness program. The
program, launched in March 2017, focuses on three areas: (i) improving the investment climate, (ii)
eliminating barriers to trade, and (iii) fostering enterprise competitiveness. The following key achievements
were made in each area:
• Improving the investment climate. The program aims to reform the business environment, enhance
investment promotion, and strengthen the effectiveness of investment incentives. Under the program, the
Investment Climate Reform Road Map and Action Plans were launched. Task Forces detailed time-bound
actions to deliver. Moreover, sectors with high FDI potential were identified and an Investment Promotion
Certification program was completed in January 2018. With the new Inland Revenue Act, the government
also switched its investment incentive scheme from tax holidays, which reward profit making, to investment
allowances, which incentivize investment in April 2018.
• Eliminating barriers to trade. The program aims to eliminate policy obstacles and regulatory barriers to
trade. Under the program, a trade vision document to set an overall framework for trade facilitation reforms
was adopted. In addition, the National Trade Facilitation Committee (NTFC) Secretariat became fully
operational. The National Trade Facilitation Action Plan was also finalized.
• Fostering enterprise competitiveness. The program aims to leverage innovation and entrepreneurship
for export competitiveness and enhance the competitiveness of the tourism sector. Under the program, the
Tourism Vision 2025 and the Tourism Strategic Action Plan were approved by the Cabinet Committee.
Subsequently the Innovation and Entrepreneurship Roadmap to develop Innovation and Entrepreneurship
Strategy, Intellectual Property Rights Framework and National Quality Infrastructure Strategy were adopted
by the Cabinet.
1
Based on World Bank Group (2017) and other sources.
12 INTERNATIONAL MONETARY FUNDSRI LANKA
16. Moreover, the focus of the trade policy discussions is gradually shifting towards an
enabling environment for investment. Despite its complex and expensive system of tax incentives
to promote investment, Sri Lanka’s foreign investment has remained below 2 percent of GDP over
the past twenty years. In addition, new FDI in the past few years has been predominantly
infrastructure oriented with only a relatively small proportion reaching sectors that are associated
with global value chains.18 With the new Inland Revenue Act, (IRA; see paragraph 19) the authorities
have moved away from inefficient case-by-case customizations of tax incentives towards a more
transparent, even-handed, and predictable framework. In line with this shift, the country has also
launched various trade sector reforms with the help of the World Bank (box below).
Business Environment and Other Competitiveness Challenges
17. The country faces several structural and competitiveness challenges to achieve the
goal of becoming a regional hub for trade and services. Beyond its trade liberalization agenda,
several competitiveness obstacles remain to be addressed to jump start investment and regional
integration. The rest of this section provides an overview of key competitiveness challenges and
opportunities and summarizes some of the authorities’ reform initiatives in this area (text table).
Sri Lanka: Competitiveness Challenges and Opportunities
Challenges Opportunities
Weak trade competitiveness New trade agreements
Closed economy Access to EU GSP
Regulatory favoritism Removing para-tariffs
Worsening doing business ranking New IRA with new investment incentives
Complex tax system New infrastructure
Declining population growth High literacy
Weak skills Female labor force participation
Illustrative Impact of Structural Reforms on GDP per Capita
18. Structural reforms could have a (In percent)
significant impact on long-term growth in Sri 0.7
Lanka. For Sri Lanka to reach the average level of 0.6
emerging market economies over a ten-year 0.5
0.4
period, the annual real GDP growth could be
0.3
increased by about 0.6 percentage points per
0.2
year through product market reforms and around
0.1
0.2 percentage points per year through a trade
0.0
tariff reduction, based on a framework by Product market reforms Tariff reduction
Lusinyan (2017) (box below).19 An empirical study Source: IMF Staff Calculations.
18 On average, manufacturing sector received 22-25 percent of total FDIs during the period 2014–2017.
19Among the structural variables used by Lusinyan (2017), Sri Lanka has lost its competitiveness especially in terms of
product market regulations and trade tariffs over the last decade. Product market regulations are gauged by the
Regulatory Quality index of the World Governance Indicators, which measures perceptions of the ability of the
government to formulate and implement sound policies and regulations that permit and promote private sector
development. Trade tariffs are gauged by the World Economic Forum, which is a trade-weighted average applied
tariff rate, including para-tariffs.
INTERNATIONAL MONETARY FUND 13SRI LANKA
by Weerasinghe (2005) also finds that an increase in openness would raise Sri Lanka’s growth
through both improvements in total factor productivity and accumulation of physical and human
capital.
Box 2. Estimation of the Impact of Structural Reforms in Emerging Market Economies
Past literature found that structural reforms could have a significant impact on long-term economic growth.
Lusinyan (2017) developed a methodology to quantify the impact of structural reforms on growth (denoted
z in the equation below), by separating the reforms’ impact on capital accumulation, labor utilization, and
productivity/technical efficiency, using data from 32 emerging market economies and 27 advanced
economies in the period between 1980 and 2016 following Égert and Gal (2016).1 The paper found that the
largest impact comes through the productivity/efficiency channel. The greatest efficiency tends to be
brought in by regulatory reforms in the product market. It also found that reducing trade tariffs and lowing
costs of starting a business have a great impact through the capital accumulation channel.
1
Emerging market economies include Argentina, Brazil, Bulgaria, Czech Republic, Chile, China, Colombia, Estonia, Cyprus,
Estonia, Hungary, India, Indonesia, Korea, Latvia, Lithuania, Malaysia, Malta, Mexico, Pakistan, Peru, Philippines, Poland, Romania,
Russia, Slovak Republic, Slovenia, South Africa, Thailand, Turkey, Ukraine, Venezuela, and Vietnam.
19. Sri Lanka’s IRA legal reform, approved last October 2017, is a remarkable step to
modernize the tax regime and create a more predictable business environment. Sri Lanka’s
complex and volatile tax system has been harming business for decades.20 Over the past four
decades, tax expenditures have been used extensively to achieve a variety of goals such as
promoting investment, strategic development, job creation, protecting key industries, and the
socially vulnerable. Once tax incentives were granted, they were rarely repealed, leading to
proliferation of tax expenditures without necessarily delivering on development goals. Recent
studies even show that incentives benefit a large portion of firms which would be profitable even
without incentives.21 Tax incentives were not well targeted and costly in terms of forgone revenue.22
To address these weaknesses, the new IRA decisively moves away from a complex combination of
redistributive and development objectives embedded in the colonial tax laws. It also gives a clear
guidance for long-term investment decisions, firmly shifting from fragmented and ambiguous
decision-making around investment incentives, to transparent, unified, and even-handed legal
framework.
20 Presidential Taxation Commission Report 2010, extracted from Waidyasekera (2016).
21 World Bank (2016b).
22 More than one percentage point of GDP, two third of actual revenue collected, is lost to Corporate Income Tax
incentives annually.
14 INTERNATIONAL MONETARY FUNDSRI LANKA
20. Transportation networks could be further developed and access to land should be
improved. After the post-war reconstruction, Sri Lanka has one of the best road and port
infrastructure in the South Asian region. That said, more remains to be done in developing road and
transportation networks with the North-East regions to enable better inland trade integration as well
as tourism access to these regions. Access to land also remains problematic for investors. The state
ownership of land is more than 80 percent23 and the process of obtaining lease and permits is
excessively burdensome with a number of different legislations and parallel forms of land
registration involved. The government is considering developing a consolidated land cadaster
system and easing lease and permit procedures.
Infrastructure in Sri Lanka
Note: Public education infrastructure is measured as secondary teachers per 1,000 persons; Electricity production per capita as
kWh per 1,000 persons; Roads per capita as km per 1,000 persons; and Public health infrastructure as hospital beds per 1,000
persons. The most recent year is used for each indicator depending on the availability of data.
Sources: World Economic Forum, World Bank and IMF staff Estimates.
21. The quality of education can be further strengthened. Sri Lanka has a remarkable 93
percent literacy rate, widespread access to education, high completion rates in both primary and
secondary education, and gender parity in general education. However, the quality of general
education lags other upper middle-income countries.24 Although access to primary and secondary
education is impressive, achievement is modest with only one third of primary school children
mastering language and mathematics skills. Moreover, while the proportion of Sri Lankans with
secondary education are comparable to that of East Asian countries, Sri Lanka’s tertiary education
numbers are much lower than in East Asian countries.
22. Despite high access to education, the overall skills of the workforce need to be
upgraded. In the WEF Global Competitiveness Index, restrictive labor regulations (4th most
problematic) and poor work ethics (2nd most problematic), inadequately educated workforce, and
23 World Bank (2015a), Page 74.
24 World Bank (2015a), Page 5.
INTERNATIONAL MONETARY FUND 15SRI LANKA insufficient capacity to innovate were quoted among the top problematic factors for business.25 There is a need to build up quality of primary and secondary education, expand supply of vocational training and technical skills, and introduce soft skills in the general education. For example, only 28 percent of workers can use computers and only 20 percent are proficient in English, with lower ratios in rural regions when over 75 per cent of employers expect a high-skill worker have English language and computer skills.26 Employers are also demanding soft skills such as teamwork, presentation, and decision making which are not fully incorporated in education and training systems. 23. Sri Lanka’s low unemployment rate masks segmentation in the labor market and an increasing dependency ratio. Sri Lanka’s demographic dividend is quickly narrowing, unlike in other South Asian economies, as working age population is expected to grow slowly (13–14 percent rate) and then gradually decline, raising over time the number of elderly people that need to be supported by active workers. Low unemployment rates (4 percent) mask several problems such as high youth unemployment (22 percent), low female labor force participation rate (36 percent)27 and skilled labor shortages in manufacturing and construction. An estimated two-third of workers are employed informally. Policies to better enable youth employment and female labor force participation may help to address the aging population challenge in the context of large development needs. C. Conclusions 24. The government has ambitious plans to achieve upper middle-income country status in 2025 by transforming Sri Lanka in an Indian Ocean Hub for trade, investment, and services. Unlike the 70-80s when investment in the tradable sectors led the productivity boost, the post-war capital deepening was mainly driven by mega-scale public-financed infrastructure projects, which did not seem to result in immediate productivity gains, as reforms to enable the business environment lagged. Sri Lanka’s static export structure signifies an absence of competitive forces to drive trade dynamism, innovation, and diversification: for over two decades exports have remained concentrated on garments, tea, and rubber products with a declining share in global trade. Introduction of para-tariffs barriers during the last decade has effectively doubled the protection rate, making the present trade regime one of the most complex and protectionist in the world. Despite operating a complex and an expensive system of tax incentives to promote investment, FDI remains low. 25. Stable and transparent regulatory systems would make Sri Lanka’s business environment more attractive for long-term investment and support trade integration. Breaking from the past, Sri Lanka’s new IRA, approved in October 2017, decisively moves to a 25The ranking of these factors is based on World Economic Forum's Executive Opinion Survey with a sample size of 75–100 for Sri Lanka on their ranking of the five most problematic factors for doing business in the country, with a rank between 1 (most problematic) and 5 (http://reports.weforum.org/global-competitiveness-index-2017-2018/). 26 World Bank (2015a), Page 14. 27 Annual labor force survey 2016, Department of Census and Statistics. 16 INTERNATIONAL MONETARY FUND
SRI LANKA

transparent, unified, and even-handed legal framework, from the previous ad hoc, fragmented, and
ambiguous tax investment incentives. Consistent implementation of this new rule-based system
could help unlock long-term investment decisions. A simplification of tax systems, including trade
tariffs and para-tariffs, through predictable, fair, and automated mechanisms, can remove
uncertainties that hold back trade and investment decisions and support the needed shift towards
more private sector-led growth. Reviewing trade barriers and developing a phased and sequenced
strategy for gradual removal of restrictions is a first necessary step towards enabling more
competitive trade. In this regard, the authorities’ decision to gradually rationalize para-tariffs and set
up automated approval systems is a welcome step. Ongoing open consultative processes on reform
strategies can also help building public consensus in support of these important objectives.

                                                                   INTERNATIONAL MONETARY FUND          17
SRI LANKA
Annex I. TFP Accounting and Data Sources
This section summarizes the three methods of aggregate TFP accounting presented in the paper as
well as the data sources for the estimations and sensitivity analysis.
Methodologies
Solow Residual TFP
. .
∆ ln ∆ ∆ 1 ∆
Human Capital Adjusted TFP
. .
∆ ln ∆ ∆ 1 ∆ 1 ∆
Capital and Labor Utilization Adjusted TFP
. .
Differentiating the production function and dropping time subscripts yields:
∆ ln ∆ ∆ 1 ∆ ∆ 1 ∆
Where output is a function of (TFP), the stock of physical capital and is the capital
utilization. Human Capital adjustment is denoted by and utilization adjusted labor, which is the
product of a labor utilization times persons engaged given by . α is the output elasticity of
physical capital, and 1- α is the output elasticity of augmented labor.
We use Bosworth and Collins (2006)’s approach to show reallocation effects in the growth accounts.
Sectoral decomposition is applied to aggregate labor productivity growth to separate the sectoral
reallocation effects, the first term on the right-hand side, from the sectoral composition effect, the
y
second term. Employment shares are denoted by s and value-added shares by s , sectors are
denoted by j .
y s
j
j y j s yj y j
j
18 INTERNATIONAL MONETARY FUNDSRI LANKA
Data Definition and Sources
The accuracy of the growth accounting exercise depends on the correctness of the methodologies,
as well as the measurement of factor inputs and factor shares. Studies show that differences in
methodology and data sets have produced significantly different estimates of TFP growth rates
(Weerasinghe 2005). Therefore, while this study uses widely accepted methodologies and
assumptions which have reached consensus in the literature, it is also important to note the
limitations that arise from inconsistencies and quality of data.
Output Gross domestic production, real growth rates and sectoral contribution were
obtained from the Special Appendix Table of Annual Report 2016 and Economic
Social Statistics 2017 by Central Bank of Sri Lanka (CBSL). GDP deflator (2010=100)
was taken from World Development Indicators. The sectoral real growth rate is
calculated as the year-on-year change in gross domestic production/gross value
added in constant prices with different base years and those growth rates are used
to extrapolate sectoral and aggregate real GDP in 2010 prices. The National
Account estimates were revised in 1970, 1982, and 1996 by the Central Bank of Sri
Lanka and Department of Census and Statistics in 2002 and 2010. Due to such
rebasing exercises, a consistent long series of real output was not readily available
and therefore, was estimated using the real growth rates of different base years in
2010 prices (see also sensitivity analysis below).
Capital Gross fixed capital formation in constant local currency, inventories in constant local
currency and adjusted savings: consumption of fixed capital (% of GNI) obtained
from World Development Indicators. Capital stock was estimated under the
perpetual inventory method with 7 percent depreciation rate using gross fixed
capital formation and changes in inventories.
Labor Number of persons engaged, share of labor compensation in GDP and annual
average hours worked were taken from Penn World Tables. Sectoral labor shares as
a percent of total employment was taken from labor force surveys (1990 onwards)
and similar surveys (before 1990) of Department of Census and Statistics obtained
from CBSL Annual Report 2000 (Special Statistical Appendix – Table 4). The missing
values in between the periods are imputed using fixed growth assumption.
The labor information for Sri Lanka comes from many sources. The labor data prior
to 1990 comes from Census of Population, Socio Economic Survey and Land and
Labor Utilization Survey that have been conducted at irregular intervals. The primary
source of the labor force and employment, Labor Force Survey conducted by the
Department of Census and Statistics (DCS) only since 1990. However, due to the
ongoing conflict in the country, two provinces were inaccessible to conduct the
survey regularly. Such inclusions and exclusions and different coverages of the
surveys shows up in the national data as anomalies. Therefore, the persons engaged
information from the Penn World tables were considered in place of it.
INTERNATIONAL MONETARY FUND 19SRI LANKA
Utilization Rates CBSL publishes capacity utilization
series in annual reports based on
factory industrial production
surveys on output and usage of
installed capacity. Capacity
utilization rates for 1968–1975 are
taken from CBSL Annual Report
2000, Special Appendix Table 14
and were extracted from "The
Economy of Sri Lanka”. Labor
utilization rates are estimated using
the average annual hours worked
by the persons engaged available in the Penn World Tables (PWT) until 2014 and
CBSL’s new series on gross value added per hour worked since 2014. The maximum
workable hours in a week is assumed to be 40.
Labor and In using Cobb-Douglas production function to conduct growth accounting exercise,
Capital Share of constant returns to scale are assumed. In the growth accounting literature, the
capital share of income varies between 0.3-0.4 for emerging market countries.
Income
However, for this study, the labor share of income was taken as 0.7, a 15-year
average based on the data available in Penn World Table on labor share of income
for Sri Lanka. Therefore, the capital share is 0.3. The following sub-section presents
the results of sensitivity analysis carried out for various depreciation rates, capital
share of income and human capital adjustment.
Human Capital Human Capital Index for Sri Lanka published by the
Index and Penn World Table 9.0 is based on the average years
of schooling from Barro and Lee (BL, 2013) and an
Literacy Rate
assumed rate of return to education, based on
Mincer equation estimates around the world
(Psacharopoulos, 1994). The free education policy
was implemented in the late 1945. In 1911, the
literacy rate of Sri Lanka was 31% and in 1971 it was
improved to 78.1%. Therefore, high rates of human
capital development during the early 1970s are in
line with the policies prevailed.
Agriculture FAO Agriculture Capital Stock (ACS) database publishes country-by-country data on
physical investment in agriculture, forestry and fishing as measured by the System
of National Accounts (SNA) concept of Gross Fixed Capital Formation (GFCF) since
1990. For this study, the GFCF in current local currency for agriculture deflated by
deflator (2010=100) was taken without any adjustments. Then the perpetual
inventory method with 7 percent depreciation was employed to estimate the capital
stock. The depreciation rate is in line with consumption of fixed capital as a per cent
of agriculture value added available in the FAO database. Bosworth and Collins
(2007) add land as an input for agriculture growth accounting. However, following
their observation that addition of land does not make a substantial difference to
results, we omit land from our study.
20 INTERNATIONAL MONETARY FUNDSRI LANKA
Industry, Employment and gross additions to fixed capital formation for manufacturing and
Manufacturing industries (without construction activities) were taken from the Annual Survey of
Industries by Department of Census and Statistics. The missing values and 2015–16
values for gross fixed capital formation were calculated using the total capital stock
growth rate.
Effective Rate of Effective rates of protection are derived from Input – Output Tables published by
Protection Department of Census and Statistics. The Department of Census and Statistics
calculated nominal and effective rates of protection for 127 industries using
nominal tariff rates, input shares of industries from Supply-Use Table and
Symmetric Input Output Table (SIOT) framework of Sri Lanka for 2010 and 2015.
Unlike the traditional approach to calculate ERP, the I/O tale approach is complete
and consistent, as it covers all the inputs, outputs and accounts for the usage of
tradables.
∑ 1
1 ∑ 1
Where - nominal tariff on j,
- nominal tariff on i and
- the share of final value of j accounted for by input i.
INTERNATIONAL MONETARY FUND 21SRI LANKA
Sensitivity Analysis
In the calculations below using the 2002 base year growth rates for the period 2010–2015, TFP
growth rates increase by 0.4–0.5 percent range for different methodologies.
Sri Lanka: Sources of Growth - Sensitivity Analysis
(Average growth rate, in percent)
Contribution of:
Output Employment Capital Factor
Productivity
Solow Residual with Human Capital (HC) Adjustment
1961-70 4.7 4.3 2.8 -2.5
1971-77 2.9 2.4 2.7 -2.2
1978-87 5.4 4.2 3.3 -2.1
1988-02 4.6 3.1 1.4 0.1
2003-09 6.0 1.2 1.6 3.1
2010-16 6.3 0.6 2.3 3.3
Capacity Utilization and HC Adjustment
1971-77 2.9 2.4 2.3 -1.8
1978-87 5.4 4.2 4.3 -3.0
1988-02 4.6 3.1 1.4 0.1
2003-09 6.0 1.2 0.5 4.2
2010-16 6.3 0.6 3.6 2.0
Capacity and Labor Utilization and HC Adjustment
1971-77 2.9 4.8 2.3 -4.2
1978-87 5.4 4.1 4.3 -3.0
1988-02 4.6 3.1 1.4 0.1
2003-09 6.0 1.4 0.5 4.0
2010-16 6.3 0.5 3.6 2.2
Solow Residual: Depreciation 5% and Capital share 0.3
1961-70 4.7 1.8 2.7 0.2
1971-77 2.9 1.2 2.6 -0.9
1978-87 5.4 2.0 3.2 0.1
1988-02 4.6 0.8 1.4 2.4
2003-09 6.0 1.1 1.6 3.2
2010-16 6.3 0.8 2.3 3.2
Utilization Adjusted: Depreciation 5% and Capital share 0.3
1971-77 2.9 3.7 2.2 -3.0
1978-87 5.4 2.0 4.2 -0.8
1988-02 4.6 0.7 1.5 2.4
2003-09 6.0 1.3 0.5 4.1
2010-16 6.3 0.6 3.6 2.1
Solow Residual: Depreciation 7% and Capital share 0.4
1961-70 4.7 1.5 3.8 -0.6
1971-77 2.9 1.0 3.6 -1.7
1978-87 5.4 1.7 4.4 -0.7
1988-02 4.6 0.7 1.8 2.1
2003-09 6.0 1.0 2.1 2.8
2010-16 6.3 0.7 3.1 2.5
Utilization Adjusted: Depreciation 7% and Capital share 0.4
1971-77 2.9 3.1 3.1 -3.3
1978-87 5.4 1.7 5.7 -2.0
1988-02 4.6 0.6 1.9 2.1
2003-09 6.0 1.1 0.7 4.1
2010-16 6.3 0.5 4.8 1.0
Source: Central Bank of Sri Lanka, Department of Census and Statistics, Food and
Agriculture Organization, Penn World Tables, and staff calculations.
22 INTERNATIONAL MONETARY FUNDSRI LANKA
Annex II. Export Structure
Sri Lanka and Vietnam had a relatively similar export composition in 1995, mainly concentrated in
agriculture good and textiles. Vietnam was able to diversify exports towards light electronics and
manufacturing, while Sri Lanka’s export structure remained mostly unchanged in past two decades.
Sri Lanka: Export Structure
1995 2014
Source: http://atlas.cid.harvard.edu/
Vietnam: Export Structure
1995 2014
Source: http://atlas.cid.harvard.edu/
INTERNATIONAL MONETARY FUND 23SRI LANKA
References
Athukorala, P. (2017). The Structure of Trade Protection in Sri Lanka, Policy brief, Arndt-Corden
Department of Economics, Australian National University.
Athukorala, P., and S. Rajapatirana (2000). Liberalization and industrial transformation: Sri Lanka in
international perspective. Oxford University Press.
Bandara, Y. M., and N. D. Karunaratne (2010). An empirical analysis of Sri Lanka's Manufacturing
Productivity Slow-down. Journal of Asian Economics, 21(4), 391-403.
Blanchard, O., and M. Kremer (1997). Disorganization, The Quarterly Journal of Economics, Volume
112, Issue 4, 1 November 1997, Pages 1091–1126.
Bosworth, B. P. and S. M. Collins (2003). The empirics of growth: An update, Mimeo, Washington:
Brookings Institution.
Bosworth, B., and S. Collins, (2007). Accounting for Growth: Comparing China and India, NBER
Working Paper No. 12943.
Cerdeiro D. A. and R J. Nam (2018). A Multidimensional Approach to Trade Policy Indicators,
International Monetary Fund Working Paper WP/18/32.
Chandrasiri, S., and N. India (2014). Industrial productivity for sustained growth: The case of Sri
Lankan manufacturing industries, in The Way Forward for Sustained Growth, eds., A. V. D. V. de S
Indraratna, S. Vidanagama and A Wijesinghe.
Chandrasiri, S., S. De Mel, and S. D. Jayathunga (2016). Enhancing productivity and export
competitiveness: The case of Sri Lankan manufacturing industries, presented at the annual sessions
of the Sri Lanka Economic Association, December.
Collins, S. (2007). Economic Growth in South Asia: A Growth Accounting Perspective, in South Asia:
Growth and Regional Integration, eds., S. Ahmed and E. Ghani. World Bank, Washington, DC.
De La Fuente, A. and R. Domenech (2000). Human Capital in Growth Regressions: How Much
Difference Does Data Quality Make? Economics Department Working Paper, 262, OECD, Paris.
Duma, N. (2007). Sri Lanka’s sources of growth, International Monetary Fund, Working Paper
WP/07/225.
Dunbar, H., B. Millot, Y. Savchenko, H. Aturupane, and T. A. Piyasiri, (2014). Building the Skills for
Economic Growth and Competitiveness in Sri Lanka, Directions in Development. Washington, DC:
World Bank.
24 INTERNATIONAL MONETARY FUNDSRI LANKA
Dutz, M. A., and S. D. O'Connell (2013). Productivity, innovation and growth in Sri Lanka: An empirical
investigation. Policy Research Working Paper No. WPS6354. Washington, DC: World Bank.
Easterly, W. and R. Levine (2001). It's Not Factor Accumulation, The World Bank Economic Review
15(2): 177-219.
International Monetary Fund (2017). Regional Economic Outlook: Making the Most of the Upswing.
Washington, October.
International Monetary Fund (forthcoming), Structural Issues in Emerging Market Developing
Countries and Initial Considerations for Structural Reform Prioritization for Low Income Developing
Countries, International Monetary Fund, Forthcoming IMF policy paper.
Jeong, H. and R. M. Townsend (2007). Sources of TFP Growth: Occupational Choice and Financial
Deepening. Economic Theory. 32. 179-221.
Lusinyan, L. (2017). Assessing the Impact of Structural Reforms through a Supply-Side Framework:
The Case of Argentina, Selected Issues Paper on Argentina, IMF Country Report No. 17/410.
Salim, R. A. (1999). Capacity Realization and Productivity Growth in a Developing Country: Has
Economic Reform had Impact? Ashgate Publishing.
Waidyasekera, D.D.M. (2016). Taxation in Sri Lanka: Current Trends and Perspectives., Institute of
Policy Studies of Sri Lanka, Working Paper Series No 25.
Weerasinghe, P.N. (2005). Trade Policy Openness and Economic Performance: Cross-country
Evidence. Staff Studies Volume 35, Nos. 1 & 2. Central Bank of Sri Lanka.
World Bank (2015a). Sri Lanka: Ending Poverty and Promoting Shared Prosperity, A Systemic Country
Diagnostic. Washington DC: World Bank.
World Bank (2015b). Sri Lanka: Opportunities and Constraints to Foreign Direct Investment, World
Bank, June.
World Bank (2016a). Enhancing competitiveness in Sri Lanka, World Bank, June.
World Bank (2016b). Sri Lanka: Moving Toward a New Investment Incentives Framework, World
Bank, October.
World Bank Group (2017). Sri Lanka Trade and Competitiveness Program, September.
INTERNATIONAL MONETARY FUND 25SRI LANKA
FEMALE LABOR FORCE PARTICIPATION: A NEW
ENGINE OF GROWTH FOR SRI LANKA?1
Sri Lanka has been a trendsetter in the region in advancing gender parity in education and health. Yet,
this has not been reflected in more active female labor force participation (FLFP), which is low
compared to its emerging market peers and even some low-income developing countries in the region.
Closing this gap is especially important as Sri Lanka faces an aging population with a labor force that
could start shrinking as early as 2026. Given the potential for significant economic gains from
integrating the female labor force into the labor market, the authorities’ Vision 2025 identifies policies
to bridge this gap. Specifically, the Sri Lankan authorities aim to provide child care facilities, improve
access to transportation, facilitate part-time and flexible work arrangements, improve maternity
benefits for private sector employees, and increase access to tertiary education and vocational training.
While these measures are steps in the right direction, Sri Lanka may also benefit from a more
systematic approach through implementing gender responsive budgeting.
A. The Gender Gap
1. Sri Lanka has largely eliminated gender disparities in key aspects of education and
health care but women still face disadvantages in economic and political life. Sri Lanka has
exceeded gender parity in terms of health with the World Development Indicators showing a higher
life expectancy for females at birth and lower levels of child mortality for females (under the age of 5
years). The World Economic Forum’s Global Gender Report (2017) also ranked Sri Lanka first among
144 countries in the category of health and survival. In terms of education, Sri Lanka has almost
reached parity in primary education and exceeds parity in tertiary education. However, a significant
gender gap persists in terms of women’s participation in the labor market which has remained low
for decades. Women make up over fifty percent of the total population but less than around one-
third of the total employed population. The labor force participation rate in Sri Lanka was 37 percent
for women compared to 75 percent for men in 2017. In addition, the gap in the average monthly
wage between men and women is estimated at 14.9 percent (World Bank, 2018). Based on the
World Economic Forum’s Global Gender Report (2017), Sri Lanka performs well below its peers in
the category of Economic Participation and Opportunity. The surprising outcome is that Sri Lanka’s
performance in this category has been declining in the past decade, not only in terms of economic
participation but also in terms of political empowerment.
1
Prepared by Sarwat Jahan.
26 INTERNATIONAL MONETARY FUNDYou can also read