Development Application Response to Verbal Submissions
←
→
Page content transcription
If your browser does not render page correctly, please read the page content below
Development Application
Response to Verbal Submissions
10 December 2018
Contents
1.     General............................................................................................................................................ 5
     1.1      Quality of application documentation .................................................................................... 5
     1.2      Impact of project on adjoining zones ..................................................................................... 6
2.     Design.............................................................................................................................................. 8
     2.1      Confirmation of WTG dimensions........................................................................................... 8
     2.2      Height of turbines ................................................................................................................. 10
     2.3      Hydrogen production facility ................................................................................................ 11
     2.4      Micro-siting & detailed design .............................................................................................. 11
3.     Operations .................................................................................................................................... 12
     3.1      Communications interference .............................................................................................. 12
       3.1.1          Radio Signal Losses (in general) .................................................................................... 12
       3.1.2          Television ...................................................................................................................... 13
       3.1.3          NBN Wireless Broadband .............................................................................................. 16
       3.1.4          Mobile Phone ................................................................................................................ 18
       3.1.5          AM & FM Radio ............................................................................................................. 22
       3.1.6          Satellite Services ........................................................................................................... 24
       3.1.7          GPS ................................................................................................................................ 24
       3.1.8          Bureau of Meteorology Radar Systems ........................................................................ 25
       3.1.9          Radiation Concerns ....................................................................................................... 27
       3.1.10         Council Comments ........................................................................................................ 27
       3.1.11         Hornsdale Comparisons ................................................................................................ 27
       3.1.12         Lack of Third Party Guarantees ..................................................................................... 27
       3.1.13         Pre-Construction Survey Methodology......................................................................... 28
     3.2      Solar panel microclimatic conditions .................................................................................... 29
4.     Environmental ............................................................................................................................... 31
     4.1      Background noise level measurements and Sonus documentation..................................... 31
     4.2      Noise impacts of larger, more closely-spaced turbines ........................................................ 32
     4.3      Relevance of (South Australian) EPA Guidelines for larger turbines .................................... 33
     4.3      Response to issues raised by Stephen Cooper ..................................................................... 34
     4.4      Infrasound ............................................................................................................................. 34
     4.5      Amplitude modulation .......................................................................................................... 37
     4.5      South Australian Environment, Resources and Development Court .................................... 37
     4.6      Human health studies and findings ...................................................................................... 38

                                                                             2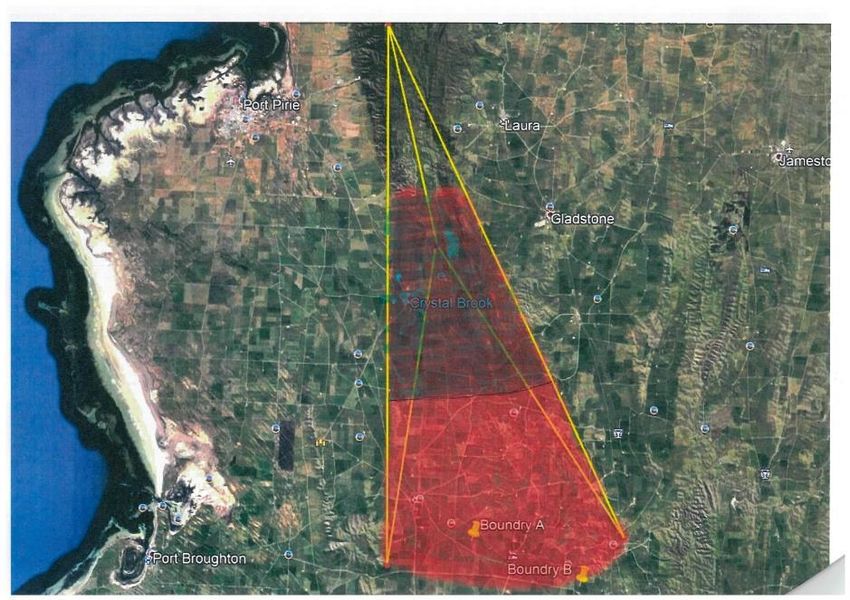
4.7       Submissions of Ms Morris, Ms Laurie and Mr Cooper .......................................................... 39
       4.7.1           Involvement with the Waubra Foundation .................................................................. 39
       4.7.2           Consideration of research in NHMRC study ................................................................. 40
       4.7.3           Consideration of research in Court proceedings .......................................................... 40
       4.7.4           Recent research ............................................................................................................ 42
     4.8       Comparative analysis of interstate guidelines and consistency with South Australia ......... 43
     4.9       Relevance of Development Plan policies for larger turbines ................................................ 45
     4.10      Cumulative visual impact of wind farms in the region ......................................................... 46
5.     Site disturbance and impact on flora and fauna, adequacy of vegetation and fauna studies ..... 47
     5.1       Adequacy of assessments ..................................................................................................... 47
     5.2       Vegetation clearance ............................................................................................................ 47
     5.3       Biodiversity corridors ............................................................................................................ 48
     5.4       Fauna ..................................................................................................................................... 49
     5.5       Access roads .......................................................................................................................... 49
6.     Cable installations within the Rural Landscape Protection Zone ................................................. 50
7.     Preparation of site for solar farm development ........................................................................... 51
8.     Transport and access .................................................................................................................... 52
     8.1       Main site access point ........................................................................................................... 52
     8.2       Aviation impacts.................................................................................................................... 56
       8.2.1           Flight training ................................................................................................................ 56
       8.2.2           Aerial agricultural applications ..................................................................................... 56
       8.2.3           Aerial firefighting .......................................................................................................... 57
9.     Visibility and screening ................................................................................................................. 59
     9.1       Effectiveness of vegetative screening ................................................................................... 59
     9.2       Photomontages ..................................................................................................................... 60
10.         Hazard risk................................................................................................................................. 63
     10.1      Lightning strikes .................................................................................................................... 63
     10.2      Fire management .................................................................................................................. 63
     10.3      CASA recommendations ....................................................................................................... 64
       10.3.1          Turbine heights ............................................................................................................. 64
       10.3.2          Obstacle lighting ........................................................................................................... 65
       10.4        Traffic hazard from solar panel glare ................................................................................ 66
       10.5        Design of solar facilities, including single-axis tracking technology ................................. 67
11.         Socio-Economic Impact ............................................................................................................. 68
     11.1      Heysen Trail........................................................................................................................... 68

                                                                             3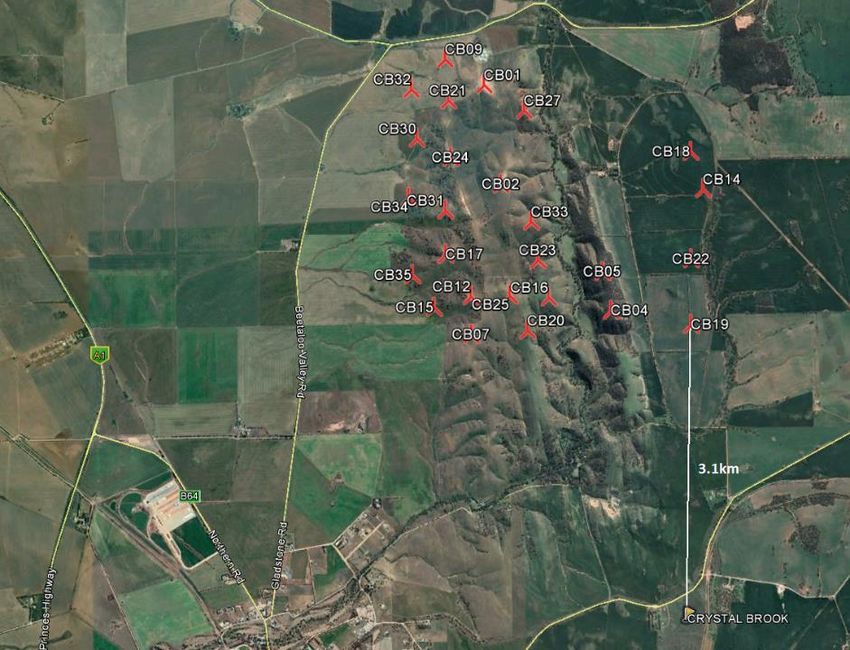
11.2      Community consultation....................................................................................................... 70
     11.2.1        Rigorous process ........................................................................................................... 70
     11.2.2        Engagement in early 2017 ............................................................................................ 72
     11.2.3        Specific individuals or groups........................................................................................ 73
     11.2.4        Engagement with Crystal Brook residents .................................................................... 77
     11.2.5        Community consultation on DA layout ......................................................................... 77
     11.2.6        Project updates ............................................................................................................. 77
     11.2.7        Crown Sponsorship ....................................................................................................... 78
  11.3 Construction impacts on Crystal Brook and surrounds (catchment, local services,
  infrastructure, accommodation)....................................................................................................... 79
  11.4      Impacts on tourism ............................................................................................................... 81
     11.4.1        Pubs/hotels ................................................................................................................... 81
     11.4.2        Crystal Brook Caravan Park ........................................................................................... 81
     11.4.3        Bowman Park ................................................................................................................ 82
     11.4.4        Kupsch Bakery, Vault 35 (café) and Damien & Ginger’s Café, Pizza and Takeaway ..... 82

The following has been prepared as a response to a further information request from the State
Commission Assessment Panel.

Neoen acknowledges the Panel’s invitation to respond to other matters raised by representors at
the hearing in Port Pirie. However, Neoen considers that the Panel’s list of questions for
clarification touches on the vast majority of the material topics which were raised, and, given the
considerable length of this response and the previous response, does not believe that further
additions would add significant value.

                                                                       4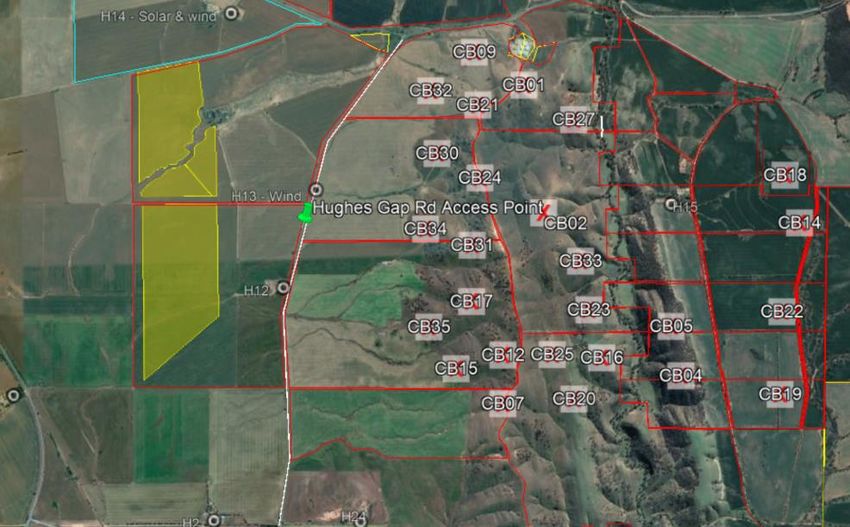
1. General
1.1     Quality of application documentation

Quality of application documentation (noting concerns raised by representors of numerous
errors and inconsistencies in the planning report).

Neoen has addressed this issue in its first response (to written submissions), and makes the
following additional comments.

Neoen considers that the number and significance of errors or inconsistencies in the Development
Application has been greatly overstated by some representors. As noted in the first response, Neoen
acknowledges that the DA contained some errors of material significance, most particularly the
mistaken siting of one turbine approximately 100m inside the Rural Landscape Protection Zone
(noting that the RLP Zone extended into flat cropping land). This error was corrected as soon as it
was brought to Neoen’s attention.

Neoen also acknowledges that there were several typographical, formatting or version-control
errors and inconsistencies in the DA. Most of these errors arose from the complexity of the project
(containing wind, solar, storage and various items of ancillary infrastructure), the number of
contributing authors to the DA (around 8) and the iterative nature of the project’s development;
that is, multiple layouts were communicated to consultants as turbines were incrementally removed
(and as tip height was slightly increased). Not all changes were fully updated by consultants across
successive versions as they prepared final reports; nor (regrettably) were these errors always found
by proof-reading.

Some representors have seized on these minor errors, arguing that they somehow undermine the
validity of the DA or the quality of the project development work itself. This is a specious argument;
the vast majority of these errors are clearly errors on their face, and have no impact on the actual
substance of the conclusions reached in the DA. For example, the traffic report quoted an incorrect
turbine tip height in several places. This error has little bearing on the conclusions reached within
the report, as towers are transported in segments, all of which must comply with applicable road
rules, and none of which will therefore be of a problematic length for road transport regardless of
the actual height of the fully constructed tower.

Neoen also notes that it is common for wind farm projects to receive such criticisms, as is evidenced
by similar issues raised for other wind farm projects and other large scale infrastructure projects in
Australia. This is partly due to the scale and complexity of these types of projects and the
unavoidable unknown factors associated with the final design and construction phase. However, it is
recognised that a development assessment decision requires confidence in the documentation of
the application and Neoen regrets any errors or oversights contained in the Development
Application, material or immaterial.

Neoen confirms that the updated plans lodged for this application are true and accurate. Neoen also
notes that the standard and well-established approach to wind farm conditioning requires that final
plans and a range of management plan are provided prior to construction to address the
complexities of these projects.

                                                   5
1.2       Impact of project on adjoining zones

The windfarm component is located within a section of the Primary Production Zone that is
situated between the Rural Landscape Protection Zone to the north and the Crystal Brook
township to the south (where windfarms are not envisaged). What consideration has been
given to impacts on adjoining zones? These are extremely large structures and will have a
visual impact, for a long time, regardless of any noise or other more scientifically assessed
impacts.

One representor raised the concern that even though CBEP is proposed to be sited on Primary
Production-zoned land, it may create visual impacts on adjoining non-Primary Production zones,
such as the Rural Landscape Protection Zone to the north, and the Rural Living and Residential zones
to the south. This matter has been previously considered by courts, which led to inclusion of policy
in Development Plans to provide for set-backs.

In response, Neoen notes the following:

      1. Turbines specifically envisioned: The project is located in a Primary Production Zone, which
         specifically envisions wind turbines. Turbines are tall structures which may be visible from
         significant distances, and it is a foreseeable outcome that by zoning the proposed CBEP site
         in such a way that they are explicitly envisaged, they may be visible from other zones. This
         would be the case even for smaller, older turbines. Neoen considers that if the planning
         system had wished to prevent visibility of turbines from adjoining Rural Landscape
         Protection or Rural Living zones, the site would have been zoned in such a way that turbines
         were prohibited (or, at the very least, not specifically envisioned).

      2. It is noted that the matter of turbine visibility was previously addressed by the courts which
         led to the policy now continued in the Development Plan that requires minimum setbacks.

      3. Rural Landscape Protection Zone ‘buffer’: The Port Pirie Council Development Plan divides
         the Rural Landscape Protection Zone into two categories – Policy Area 11 and Policy Area 12.
         The differing Desired Characters of these two areas (pages 169-172 of the Port Pirie Council
         Development Plan) show a clear differentiation between their respective landscape values
         and intended usages. Policy Area 11 has a clear conservation and preservation rationale
         (‘high environmental value and…outstanding scenery’), with development to be extremely
         limited. Policy Area 12, by contrast, is acknowledged to have ‘generally been cleared for
         farming, mainly for cropping and grazing purposes in the past’, with development to be
         allowed where consistent with the landscape.

          The southern edge of Policy Area 11 is at ‘Davies Track’, a dirt road approximately 11km
          north of the northernmost proposed CBEP turbine. South of Davies Track, down to the
          Wilkins Highway, the hills are zoned as Policy Area 12. Neoen argues that this designation
          reflects the lesser scenic qualities and more modified, agricultural character of the southern
          hill ranges, and has been put in place in order for Policy Area 12 to act as a ‘buffer’ between
          the Primary Production-zoned land to the south and Policy Area 11 to the north. Relevantly,
          Neoen notes that there is a large quarry in Policy Area 12, clearly visible from the Princes
          Highway.

                                                     6
Figure 1 - Quarry in Rural Landscape Zone Policy Area 12

    This characterisation has also been cemented through Neoen’s verbal discussions with Port
    Pirie Council – see below an extract from a letter sent by Neoen to Council on November 14,
    2017, summarising conclusions reached at an in-person meeting on November 10 (the full
    form of this letter was attached to Neoen’s first response to submissions):

    The effect of this is, Neoen submits, that while there will be some visual impacts on Policy
    Area 12 adjoining the project, these should be viewed in the context of its role as a buffer
    zone between Primary Production Land and the scenic, natural areas covered by Policy Area
    11. Since Policy Area 12 is approximately 11km in length, Neoen considers that it forms an
    effective protection for Policy Area 11 from visual impacts associated with CBEP.

4. Northern Areas Council Rural Landscape Protection Zone: Part of the Rural Landscape
   Protection Zone to the north of CBEP falls under Northern Areas Council management.
   Unlike Port Pirie Council, the Northern Areas Council does not split the Rural Landscape Zone
   into policy areas, instead treating it as one area. Preservation of its natural character is an
   objective; however, Neoen notes that specific allowance is made for an explosives
   manufacturing and testing zone.

    Neoen also notes that in its agency response, the Northern Areas Council has not stated any
    concerns with CBEP’s impact on the adjoining Rural Landscape Zone under its management.

                                                  7
2. Design
2.1       Confirmation of WTG dimensions

Confirmation of WTG dimensions, including base and section diameters

One representor claimed that Neoen has misrepresented the width of the proposed turbine towers,
and that this width should have been portrayed in photomontages as 16 metres. This is incorrect –
the turbine towers will not be greater than 7.5 metres in cross-section at their base (7.5 meters is
likely to be a substantial overestimate). The question of photomontage accuracy is discussed at
greater length in the ‘photomontage’ section of this response.

Please note that Neoen is unable to provide exact dimensions for most turbine components
because:

      (1) detailed design information is proprietary and has been received from manufacturers in
          commercial confidence;
      (2) Neoen has not yet selected a turbine supplier, with components differing in size from
          supplier to supplier, not always directly correlated with generating power or tip/hub heights.
          For example, a 4.8MW machine may still have a smaller nacelle than a 4.2MW machine,
          depending on manufacturer design;
      (3) Manufacturers may slightly alter certain specifications (such as tower cross-section) based
          on detailed site investigations, which cannot be performed until a supplier is selected;
      (4) There are multiple types of foundations which may be used pending detailed geotechnical
          investigation of the site – some are wider and shallower, while others are narrower but
          deeper.

Neoen emphasises that these factors are standard for wind projects at this stage of development.

Neoen notes that turbine dimensions other than tip height, hub height and rotor diameter/blade
length (such as nacelle size and tower cross-section) have only a relatively small range of variation
between turbine models in the 4-5MW range (for example, tower cross-section might range
between 4.5 and 7.5 metres, and nacelle length might range between 12 and 18 metres). It is also
important to emphasise that by comparison with tip height, hub height and blade length, these
dimensions make a negligible contribution to overall visual impact.

Neoen offers the following diagram and table setting out ‘maximum’ and ‘likely’ dimensions for each
component. Please note that the diagram depicts only a generic turbine to clarify which
measurements apply to which component, and is not to scale.

                                                    8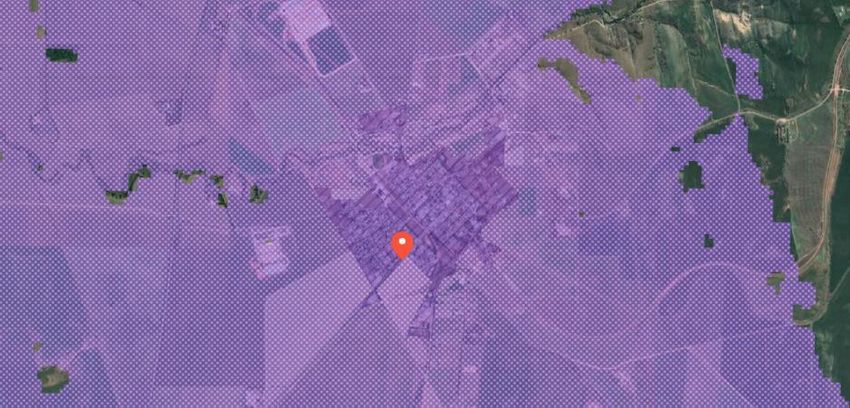
Figure 2 - Typical Wind Turbine

Label        Dimension              Maximum figure (metres)   Likely figure (metres)

 A      Hub height                                161                  161

 B      Rotor diameter                            158                  158

 C      Foundation width                          40                   22

 D      Blade chord                                6                   4.5

 E      Nacelle height                             7                    5

 F      Nacelle length                            20                   16

 G      Nacelle width                              7                    5

 H      Tip height                                240                  240

  I     Tower cross-section                        8                   5.8

                                       9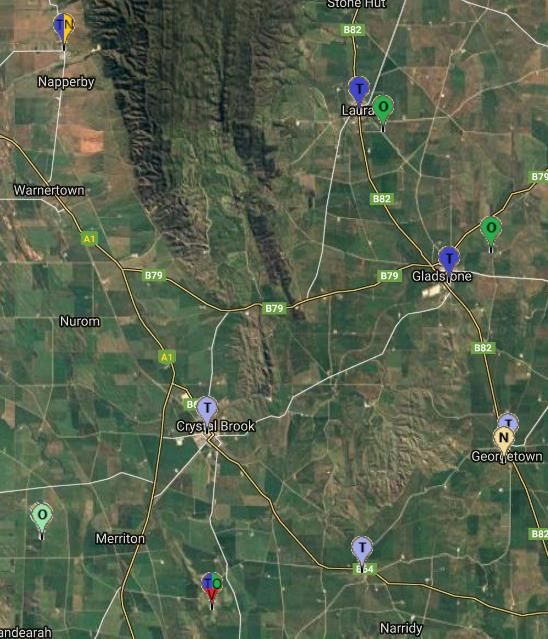
2.2     Height of turbines

Height of towers/turbines and accuracy of information related to these, bearing in mind
these will be the tallest land-based towers in Australia.

It is incorrect to state that the proposed turbines will be the tallest in Australia as this technology has
been approved in Qld on another Neoen project (Kaban Wind Farm). The technology proposed in
this application has been selected to provide a balance between minimising the number of turbines
and achieving the generation levels needed to make the project financially viable. Compared to
other wind farm projects, CBEP is relatively small in terms of the number of turbines.

To enable the transition of the economy away from fossil fuels to renewable energy, and to bring
down power prices in South Australia, it is vital that the cost of renewable energy continues to fall.
In order for this to occur, wind turbines and solar panels must be constantly improved – in the case
of wind turbines, this will typically mean increases in height and blade length. Taller turbines are
able to access higher wind speeds which are present further above the ground, while greater blade
lengths will increase the ‘swept area’, and thus the amount of energy captured by the wind. It is also
far more efficient to install a single large machine than two smaller ones; there are significant
savings in concrete foundations, vehicular movements, construction time and labour. There are also
substantial reductions in the amount of land and vegetation clearance required, including for access
roads and underground cables.

This technology curve means that while it is correct that the turbines proposed at CBEP are among
the tallest onshore models currently proposed in Australia, this is true of most wind projects which
have been built, and will continue to be true of most new projects which are proposed in the future;
it is analogous to saying that each new generation of computer technology is the fastest ever made.
That is, every new project will strive to utilise the latest, largest and most cost-efficient turbine
models available. Projects which do not do this will not produce the cheapest possible electricity,
which will make them uncompetitive and thus unlikely to be built. This is particularly true of smaller
projects such as the 26-turbine Crystal Brook, where the smaller size of the project reduces Neoen’s
ability to leverage scale discounts from turbine manufacturers.

Neoen notes the following other wind developments with comparable turbine heights around
Australia which are at various stages of permitting or approval. Please note that there are most likely
other projects intending to submit Development Applications for 240m or above of which Neoen is
not currently aware.

 Project name               State    Company                           Tip height     Current Status
 Hills of Gold              NSW      Wind Energy Partners Pty Ltd      220m           Prelim Env.
                                                                                      Assessment submitted
 Golden Plains              Vic      Westwind                          230m           Permitted
 Kaban                      Qld      Neoen                             240m           Permitted
 Clark Creek                Qld      Lacour Energy                     220m           Permitted
 Kennedy                    Qld      Windlab                           200m           Turbines installed
 Sapphire Windfarm          NSW      Continental Wind Partners         200m           In operation

                                                    10
2.3 Hydrogen production facility
Hydrogen production facility: is this included or just provision for future application? If a
future proposal, the likely timing of such an application.
As stated in section 3.3.1 of the DA, Neoen confirms that the hydrogen production facility is not
intended to be included in the Crystal Brook Development Application. Reference to this component
was provided with the intention of openly disclosing a possible future project to avoid any later
perception of Neoen having ‘covered up’ the project. The ‘Hydrogen Superhub’ is a proposal which is
still undergoing study and investigation in cooperation with the South Australian Government.
Neoen elected not to include a hydrogen component in the CBEP DA because it remains subject to:
(a) selection of a final location for hydrogen production infrastructure;
(b) a detailed understanding of all potential impacts; and
(c) finalisation of technical and economic feasibility studies.
Consequently, an investment decision remains in the future. If a decision is made to progress the
Hydrogen Superhub, a variation to the CBEP DA or (most likely) an entirely separate DA will be
submitted for assessment via the appropriate planning pathway.
It is not currently possible for Neoen to state when such an application may be made as it is
contingent on a number of factors including the availability, nature and location of a hydrogen
offtaker (that is, purchaser). Once timelines become clearer, Neoen will engage with the community
to provide details of the proposal.
2.4 Micro-siting & detailed design
Developer expectations re: detailed design, micro-siting etc – what is the anticipated level of
change from what people have seen to what is to be built?
Micro-siting is a well-established and accepted technique applied to wind farms and other large
scale infrastructure projects where soil and ground conditions are unknown (and impractical to fully
explore) at the Development Application stage. This approach is also accepted by the Courts.
However, Neoen appreciates that this may create some uncertainty for some members of the public.
Neoen confirms that the visual appearance of CBEP will not vary materially from the proposed
design, unless that variation results in a reduction of visual impact (such as the removal of a turbine
or solar panels).
Neoen proposes a standard micro-siting allowance of 100 metres, subject to the following
parameters:
1. Current setback distances between non-involved dwellings and the closest turbines to those
dwellings must not be reduced. For example:
a. No turbine will be micro-sited closer than 1.6km to dwelling H24;
b. No turbine will be micro-sited closer than 1.31km to dwelling H17;
c. No turbine will be micro-sited closer than 1.5km to dwelling H15;
d. No turbine will be micro-sited closer than 2.85km to dwelling H53.
2. Turbines will not be micro-sited within the 500m Wedge-Tailed Eagle buffer zone.
113. Operations
3.1 Communications interference
Communication interference (TV, radio, mobile phone). There is an acknowledgement of
“minor” service degradation but what does this mean in practice? Further details need to be
provided on the potential effects of windfarm operations on telecommunication services
utilised by residents and primary producers – i.e. Bluff transmission tower, Huddleson Road
ABC antennae, mobile networks (esp. medical / emergency notifications), effectiveness, cost
and timing of mitigation measures if a loss of service or an extended interruption is
experienced (and how a loss of signal loss / interference is determined timeliness of any
response).
Neoen provides the following response, in consultation with its EMI consultant, GHD:
GHD accepts that the technical terminology used within this report has led to confusion over the
extent of the findings.
In particular, the meaning of the terms nil, negligible and minor were left open to interpretation.
This response will clarify these terms in the context of each service type and discuss the difference
between actual degradation to signal (i.e. the signal power level received at the particular receiver)
and perceived degradation to services (i.e. what a person using that service can notice).
This response will address each of the services discussed during the SCAP meeting, to further clarify
the findings of the report included in the application.
As discussed in the next section, there are many sources of radio interference, and as such a precise
calculation of the effect on each resident is impossible. The response is therefore developed by the
application of well-established principles from previous tests and experiences.
3.1.1 Radio Signal Losses (in general)
There are many types of losses that affect the power of a radio signal as it traverses the path from
transmitter to receiving unit. These losses include:
• Free space loss: the diminishing of the signal as it traverses the air. Signal power is inversely
proportional to the square of distance (in free space), so the signal will get exponentially
weaker the further it travels. To allow for losses, practically this can extend to a
1/(distance)3.5 relationship.
• Diffraction: refer report commentary
• Multipath (reflections): refer report commentary
• Absorption (buildings / vegetation / etc.): signals can both reflect, and be absorbed, as they
pass through walls, buildings, furniture, etc. Higher frequency services are more susceptible
to absorption.
• Atmospheric Moisture (rain fade): signal loss can vary due to the weather conditions, such as
moisture in the air. Higher frequency services are more susceptible to rain fade.
• Terrain: different types of terrain can impact the ability of the wave to traverse over it
• Atmospheric reflections: atmospheric layers at certain frequencies (ionosphere for below 50
MHz, troposphere for above 50 MHz) can reflect signals back towards the ground. This can
allow signals to extend beyond the horizon.
12In order to combat the many (uncontrolled) sources of signal loss, radio systems are designed to
incorporate a “fade margin”; an extra amount of signal power required at the transmitter, to allow
for these losses while still receiving the required signal at the receiver.
The wind turbines are expected to cause some losses through diffraction and multipath, however
this is expected to be similar to that caused by existing buildings or trees. The distance to the nearest
residence, at approximately 1.3 km, is not expected to be a concern since the reflected signal will
have travelled a significantly greater distance and hence the reflected signal should be sufficiently
lower in power that it can be filtered out by the inbuilt capabilities of the electronic device receiving
the signal.
While the report acknowledges there will be some level of signal loss introduced by the turbines, it is
not anticipated that the losses will be perceptible to end users, as discussed below for each service
type. The many factors above also make it impossible to accurately predict the expected signal level
at each impacted residence, and as such the EMI report can only assess expected impacts developed
on the basis of experience and data made available by the various service providers.
3.1.2 Television
As shown in the original EMI report, the township of Crystal Brook is in an area of good television
coverage, and there will remain a line of sight between “The Bluff” transmitter tower and the
township.
During the panel, representor Genevieve Wells tabled an email / report prepared by Michael Large
with the following key claims:
• Approximately 2,000 residences may be subjected to digital TV signal interference (with
included image demonstrating).
• Many residences required new infrastructure for the Snowtown development.
• May be a very small impact for 4G services.
13The key factors influencing television reception are as follows (as taken from ITU-R BT.2142-1 – The
effect of the scattering of digital television signals from a turbine):
• The strength and quality of the direct signal from the transmitter to the receiving TV aerial:
Crystal Brook and nearby major towns do not have the wind farm directly blocking the signal
• The strength of the interfering signal, which is caused by reflections of the transmissions by
the wind turbines: Crystal Brook is sufficiently offset from the wind farm to avoid damaging
reflections.
• The location and distance of the receiving TV aerial relative to the wind development: Aerials
outside of line of sight won’t be pointing towards the wind farm. This also means that the
reflected signals will be received at an angle to the directional antenna where the impact of
the signal will be reduced (and effectively ignored) compared to the direct signal.
• Effects can occur at distances up to 13.5 km: This is a significantly smaller area than shown in
Michael Large’s report tabled at the SCAP hearing.
14Considering the 13.5 km area of affect above, alone, we can see the area stated in Michael Large’s
report is overstated compared to reasonable expectation as seen below, assuming still that the
reflection zones presented are in fact correct.
As noted above, the reflection area shown is also likely overstated.
No basis of calculation is provided for this assessment of impact.
The effect (if any) experienced by the vast majority of the 2,000 residences suggested would very
likely be small enough to have no visible (perceived) impact on the image presented on a television.
The report does not state the level of impact expected.
The second reference provided by Michael Large’s report (TV Interference from Wind Turbines,
Salema, Fernandes and Fauro) states in the conclusion that the ITU recommendation states that a
single wind turbine is unlikely to impair reception at more than 0.5 km, a distance that Neoen has
exceeded by more than 200%. The findings of this report assume an omnidirectional antenna (i.e.
the source signal and the ‘noise’ would be received equally). It is reasonable to expect that all TV
antennas in the area surrounding the wind farm are directional.
While Michael’s email mentions issues relating to the Snowtown Wind Farm development, there is
no information with regards to where the location of these properties are in relation to the TV tower
(also Spencer Gulf / The Bluff) and the wind farm (i.e. they may be located behind the wind farm
relative to the transmitter and therefore issues to TV reception would be expected).
Neoen has committed to the installation of new antennas, and in the worst case, satellite television
(discussed later in this response), should residents experience issues caused by the wind farm
development.
153.1.3 NBN Wireless Broadband
Note: It is assumed that respondents who discussed ‘Wi-Fi’ were actually meaning to refer to the
NBN Wireless Broadband service. Wi-Fi within a property has too short a coverage range to be
affected by the turbines.
NBN Fixed Wireless uses a directional antenna pointed towards the NBN tower, the location of
which is shown in the following diagram. As can be seen, the majority of these antennas will be
pointed away from the wind farm, and the wind farm itself sits within a coverage gap between the
Gladstone and Crystal Brook transmitters.
16The majority of the township is serviced by Fibre to the Premises (FTTP), which utilises underground
fibre cables and not radio frequency services to deliver internet services.
It is not expected that NBN Wireless Broadband services will be affected by the wind farm
development, as it is a directional service and no antennas should be pointing in the direction of the
turbines through the wind farm area.
173.1.4 Mobile Phone
The following diagram shows the locations of Telstra (T), Optus (O) and Vodafone (V) towers for 3G
and 4G within the vicinity of the wind farm. As you can see they are located in several locations
within the area, and the range will in practice act as a barrier from one side to the other for signal
propagation.
18The following diagrams show the coverage maps provided by each of the providers for the area.
Optus
19Telstra
20Vodafone
Around the area, it is likely that a mobile phone will be within range to connect to the stronger signal
from the Crystal Brook and Gladstone towers, particularly along Wilkins Highway (for Telstra and
Optus users). If the mobile phone can connect to either of these towers, it will have signal.
There is no reason to believe that there will be an impact on the signal within the townships as the
tower is so close, relative to the wind farm.
There may be some impact along Wilkins Highway, travelling past the wind farm, if the Gladstone
towers for Optus and Telstra do not service that area. Neoen notes that in the experience of its
project managers, reception is already non-existent on the stretch of the Wilkins Highway which is
immediately north of the project. As this information is not released by these providers, we are
unable to definitively state that there will or will not be reception impacts in that area.
Land-line phones will not be affected by the wind turbines as they are delivered by
underground/overhead cable.
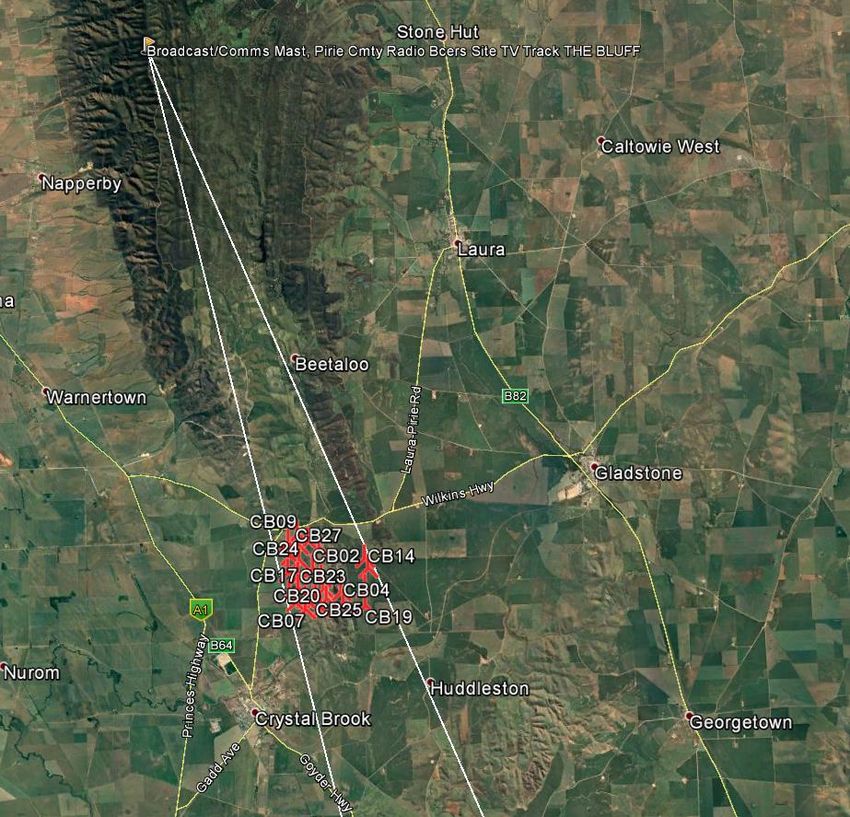
213.1.5 AM & FM Radio
AM waves are not typically affected by wind turbines, as stated in the EMI report, due to their long
wavelength.
The EMI report does not mention the nearby AM tower specifically as it is sufficiently far away from
the closest turbine to not be affected, at over 3.1km as suggested by
https://www.broadcastwind.com/wind-farms-tv-and-radio-interference/ . However, Neoen will
ensure that it engages fully with the owner/operators of the tower, ABC and Broadcast Australia,
and commits to mitigating impacts if any are experienced.
22The following diagram provides a coverage map for ABC 639 radio service.
There is no licencing information showing a direct link between ABC’s Port Pirie facilities and the
Crystal Brook AM repeater tower, as mentioned in a submission by Peter Cousins. It is likely that the
broadcast information is sent via an alternative method rather than a direct point-to-point link.
FM services have been sufficiently covered in the original EMI report.
233.1.6 Satellite Services
The provision of satellite TV or internet services are an option of last resort for Neoen, and all other
viable alternatives will be investigated before resorting to satellite services.
During the SCAP hearing, it was mentioned that there was no local content on satellite television.
This is only partly true. The table below describes the services available on satellite television (VAST)
in South Australia.
Network Channels Content Source
ABC ABC, ABC Kids, ABC Me, ABC News South Australia
SBS SBS, Viceland, Food Network, NITV South Australia
Seven 7, 7mate, 7two South East (Sydney)
Nine 9imparja, 9Gem, 9Go! South East (Sydney)
Ten One, Ten, 11 South East (Melbourne)
SC Spencer Regional News Alternating broadcast of Spencer Gulf
Gulf and Tasmanian news bulletins from
7:05pm through to the next
afternoon
The Adelaide versions of channels for networks Seven, Nine and Ten can be streamed on a variety of
players (such as Apple TV or Chromecast) from their network apps or Freeview apps.
3.1.7 GPS
GPS works through devices connecting to satellites. The requirement for this to function is for “clear
sky”. An example of this is how GPS navigation in a car typically will not connect when inside a
garage, but can function once outside and able to connect with a satellite.
The only possible effect on GPS would be if the receiving unit was situated directly next to / under
the wind turbine, and even then, that would be situational depending on the direction of the blades
relative to the position of the GPS device.
There will be no effect on GPS from the turbines for those outside of the direct wind farm area.
243.1.8 Bureau of Meteorology Radar Systems
During the panel hearing, an image taken from the Bureau website’s radar display feature was
tabled, claiming that the radar showed rain / cloud at the wind farm locations within the mid north
on a day with “clear blue skies”.
GHD has not seen this image, as it was not provided during the panel hearing or subsequently to
that with the remainder of submissions, and is therefore unable to comment specifically on it.
Viewing the radar image at 15/10/2018 at 1:10pm, a generally drizzly day with some rain around,
there is no evidence of rain shown at all in the location of Hornsdale Wind Farm (north of
Jamestown), and nothing at the location of the Hallett Wind Farm. Minor rainfall is shown around
Snowtown Wind Farm however this moves across in the time delay images.
25The following was taken at 8:24am on 16/10/2018 during a rain event in Adelaide’s CBD, again not
showing any rainfall at the wind farm areas of Snowtown, Hornsdale and Hallett:
The following was taken at 3:30pm on 24/10/2018 during which it was mostly sunny, a few clouds in
Adelaide CBD, again not showing any rainfall at the wind farm areas of Snowtown, Hornsdale and
Hallett:
26As part of the EMI study for any wind farm development in Australia, we undertake a process of
consultation with the Bureau to ask them about the impact on the radar should the development be
approved, and to inform them such that they can implement filters should the turbines cause noise
on the radar.
3.1.9 Radiation Concerns
One respondent claimed that the wind turbines would result in radiation from the turbines
propagating into the township of Crystal Brook, to provide a response, we have assumed this is in
reference to the health of residents. There is no scientific basis on which this claim was made and
while what may be considered radiation could reach the town, this will not be a health hazard.
For comparison, there is stronger RF radiation emitted from a mobile phone than from the wind
turbines (as measured at the body).
3.1.10 Council Comments
The council have asked for a nil effect on television, mobile phone, etc. services. Interpreted in the
strictest sense, this is impossible to achieve in terms of absolute signal levels, as the smallest of
disruptions (from any source) can have a small effect on the received signal power.
In accordance with the standards usually applied to significant infrastructure projects, Neoen will
commit to, as best as possible, producing a nil effect on the perceived signals.
3.1.11 Hornsdale Comparisons
Some comparisons were drawn to the impact on services at the Hornsdale Wind Farm site. It should
be noted that the television and mobile phone signal levels in that area are much weaker than at
Crystal Brook. The effected households were on the edge of reception areas. They were also situated
such that the wind farm was placed in the direct line to the transmitters. Neither of these factors
apply to Crystal Brook.
Neoen purchased the Hornsdale project as a ‘brownfield’ project – that is, with the layout already
largely fixed by an existing Development Approval, which was received in 2012 for the first two
stages. Consequently, EMI effects were largely out of Neoen’s control. Neoen has since worked with
the few affected residents at Hornsdale to address unintended impacts. Since that time, the
methodology used to predict such impacts has also improved and Neoen has leveraged this to
improve outcomes at CBEP.
3.1.12 Lack of Third Party Guarantees
One representor noted that Telstra and NBN have refused to promise service with the wind farm
present. While this was presented as potentially meaning that there would be impacts to service in
the surrounding area, in the experience of Neoen’s EMI consultant, GHD, this is a standard response
from those entities to absolve themselves of legal responsibility.
As shown above, we expect very minimal interference, and no perceived change to service within
the township of Crystal Brook.
273.1.13 Pre-Construction Survey Methodology
The methodology for the reception coverage survey would involve the hiring of a sub-contractor
with suitable signal level monitoring equipment. They would drive around the area of interest, with
equipment mounted to their vehicle continuously polling the signal strength at the relevant
frequency for the service of interest. These data points would be logged against a GPS location and
later processed into a coverage map. This would allow for a comparison post turbine installation,
conducted with the same method and ideally in similar climactic conditions to verify claims of signal
disruption.
283.2 Solar panel microclimatic conditions
Do the solar panels (in a farm arrangement) create any microclimatic conditions and if so the
characteristics? This is currently being investigated with other solar projects in cropping
regions.
One representor expressed the concern that solar panels may create ‘microclimates’ which could
impact adjoining parcels of land.
This phenomenon is termed the ‘Photovoltaic Heat Island’ effect (PVHI), and has recently been
subjected to considerable study with the rapid rise in large-scale solar installations around the world,
mostly sited in agricultural areas. This effect, it is claimed, occurs when dark, non-reflective solar
panels absorb and trap heat from sunlight, raising the soil and air temperature within and around
solar arrays and leading to an increase in air temperatures up to 3-4 degrees Celsius.
Findings from recent studies have shown strongly that the PVHI effect may occur within the
perimeter of solar arrays, but does not occur outside of it to any significant extent. Consequently,
use of appropriate setbacks from non-involved property boundaries will prevent any impacts on
non-involved landholders.
These studies were considered by the expert planning panel at Neoen’s Shepparton Solar Farm in
Victoria in 2018. 1 Following this hearing, Neoen’s standard policy on solar farm layouts, and the one
which will be used at Crystal Brook, is a 25-metre setback from solar panels to the edge of
neighbouring non-involved properties.
Shepparton Solar Farm was one of four permit applications for solar energy facilities which were
submitted to Shepparton Council in 2017. In March 2018, a planning panel was appointed to
consider the four permit applications. Under the Planning and Environment Act 1987 (the Act), a
Panel is appointed by the Minister for Planning to hear submissions made about amendments to
planning schemes and to make recommendations or provide advice about whether or not the
amendment should proceed.
In May 2018, a six-day panel hearing took place in Shepparton. Proponents, Council and objectors
gave submissions, including expert evidence, regarding the applicable policies and potential impacts
of the solar energy facilities.
The panel report was released on 23 July 2018, with conclusions and recommendations, including a
recommendation that the Neoen proposal be approved.
The panel had the following to say in relation to the PVHI effect outside the solar array perimeter
(page 38 of their report):
‘’Outside the solar array perimeter
The Panel gave considerable weight to Dr Barron-Gafford’s evidence and it accepts the
results of the Barron-Gafford study related to the extent of any PVHI effect which states:
1
Greater Shepparton Permit Applications 2017-162, 2017-274, 2017-301 and 2017-344 - Panel Report - 23 July
2018, Planning Panels Victoria, Victoria State Government
29… that the PVHI was indistinguishable from air temperatures over native
vegetation when measured at a distance of 30m from the edge of the PV
array. This pattern held true for both daytime and night-time conditions.
Because the PV panels themselves trap the energy from diffuse sunlight
that was able to reach the ground underneath them, air temperatures
remain elevated within a PV array. As you leave this “overstorey” of PV
panels, energy is able to radiate back towards the atmosphere, as it does in
a natural setting, and the PVHI quickly dissipates.
The temperature variation shown in Fthenakis and Yu (2013) for the first 100 metres either
side of the edge of the solar array is broadly consistent with those observed by Dr Barron-
Gafford in Figure 4 of his evidence statement. The Panel was not presented with any
credible evidence to oppose the findings of Fthenakis and Yu (2013) which states:
Analyses of 18 months of detailed data showed that in most days, the solar
array was completely cooled at night, and thus, it is unlikely that a heat
island effect could occur.
There is scientific consensus that a ‘heat island effect’ is unlikely to occur; therefore, the
precautionary principle does not apply for any of the proposed four solar energy facilities.
This is supported by expert consensus that a serious or irreversible effect will not occur. As
outlined in Mr Harriott’s explanation, Mr Guthrie’s recommended 25-metre setback will
‘protect against heat impacts on adjoining landowners’.”
304. Environmental
4.1 Background noise level measurements and Sonus documentation
Clarification around background noise level measurements (and level of documentation
provided by Sonus.
Sonus is the leading acoustic consulting firm in South Australia, and, with regard to wind farm
acoustic modelling, likely the most experienced firm in Australia. They have consulted on the
following wind projects:
• Starfish Hill (SA) • Vincent North (SA)
• Kemmiss Hill (SA) • Taralga (NSW)
• Troubridge Point (SA) • Brown Hill Range (Hallett 1) (SA)
• Waitpinga (SA) • Badgingarra (WA)
• Snowtown II (SA) • Willogoleche (SA)
• Barunga (SA) • Nilgen (WA)
• Clements Gap (SA) • The Bluff Range (Hallett 5) (SA)
• Nalpa • Yaloak Estate (Vic)
• Canunda (SA) • North Brown Hill (SA)
• Carmody's Hill (SA) • Naroghid (Vic)
• Wattle Point (SA) • Mt Bryan (Hallett 3) (SA)
• Barn Hill (SA) • Ararat (Vic)
• Hallett Hill (Hallett 2) (SA) • Woolsthorpe (Vic)
Background noise levels are measured in the vicinity of a wind farm during the planning stage of a
project to increase the allowable noise level. This practice is in recognition that the background
noise levels (generated by sources such wind in the trees) at a dwelling will typically increase with an
increase in wind speeds. This increase in background noise levels can “mask” the noise from the
wind farm and reduce its impacts. Therefore, if the background noise levels are measured to be
sufficiently high, the authorities allow the assessment criteria to be relaxed.
The South Australian EPA Wind Farms Environmental Noise Guidelines July 2009 (the EPA Guidelines)
utilise such an approach and establish the assessment criteria to be a baseline level of 40 dB(A) or
the background noise level plus 5 dB(A), whichever is the greater. Based on the above, the
measurement of background noise levels is not an essential component of a planning assessment if
the wind farm can be designed to achieve 40 dB(A) or less.
Background noise monitoring has been conducted at 5 locations in the vicinity of the Crystal Brook
Energy Park. The locations were selected to be representative of the existing background noise
environment in all directions from the wind farm. The selection of the locations and the monitoring
methodology were consistent with the requirements of the EPA Guidelines.
Whilst the background noise level results indicate that the assessment criteria can be increased
above the baseline level of 40 dB(A) at some dwellings at higher wind speeds, the wind farm has
been designed to achieve 40 dB(A) at any dwelling not associated with the wind farm. In other
words, acoustic modelling conducted for CBEP does not rely on the background noise monitoring
results to adjust the compliance threshold.
314.2 Noise impacts of larger, more closely-spaced turbines
Cumulative noise impact of larger, more closely spaced turbines (26) – including potential
health and sleep disturbance impacts from infrasound noise (esp. amplitude modulation,
pulsating, inaudible, low frequency noise).
The SA EPA guidelines have been reviewed and tested on many previous occasions in relation to a
range of wind farm projects with different technology, spacing, numbers and settings across South
Australia. The key aim of the guidelines is to ensure that noise levels at sensitive receivers can be
limited to a level that reflects appropriate health and amenity targets regardless of the wind farm
design or setting.
The noise from wind farms is predicted by using measurements close to the proposed turbines in
accordance with an international standard. A three-dimensional computer model is then used to
extrapolate the level of noise from the cumulative effect of all turbines to dwelling locations. Inputs
to the model include the inherent noise generating properties of the turbine (taking account of its
size), the proposed turbine locations, the topography, an assumption of all turbines operating with
the wind blowing from that turbine to the residence location (obviously a conservative ‘worst case
scenario’ assumption) and a range of meteorological conditions. That is, the noise associated with
the size, number and location of the turbines is inherently covered by the noise measurement and
the location (including spacing) of turbines is included in the noise model.
As stated in Neoen’s first response, whether turbines are closely spaced or not makes no qualitative
difference to acoustic emissions. Neither Neoen nor Sonus are aware of evidence for any ‘clustering
effect’, and do not accept that such effect exists.
324.3 Relevance of (South Australian) EPA Guidelines for larger turbines
Relevance of EPA Windfarm Guidelines and Development Plan policies for larger / higher
powered turbines and cumulative impact of windfarms in the region (and comparative
analysis of interstate guidelines and their consistency with SA). The adequacy of current
standards was raised as an issue by a number of representors at the public hearing.
The South Australian (SA) EPA Guidelines were the first wind farm specific guidelines to be
developed in an Australian jurisdiction, with the first version published in 2003. The EPA Guidelines
have been reviewed and developed over time and are considered to provide a contemporary and
stringent approach which has formed the basis for the assessment approach in other jurisdictions,
including NSW, WA and Queensland.
Specifically, the EPA Guidelines have been:
1. Developed over a period of 17 years (including their development period) accounting for a
range of available input and research data including that provided by Senate hearings,
National Health and Medical Research Council (NHMRC) investigations, a dedicated EPA
review, the EPA’s own investigations into infrasound and low frequency noise and recent
operational wind farm measurements in South Australia;
2. Considered and upheld as suitable standards in the wake of available input and research
data in four wind farm cases in the Environment, Resources and Development Court (the
ERD Court) for the Allendale, Mt Bryan, Stony Gap and Palmer wind farms; and
3. Developed to ensure that wind farms do not unreasonably impact on the acoustic amenity
of surrounding dwellings.
The Crystal Brook Energy Park has been assessed against the EPA Guidelines and the assessment
concludes that the wind farm can be readily designed to achieve the Guidelines.
The EPA guidelines are based on establishing external noise level criteria at which a wind farm will
not unreasonably interfere with the amenity of nearby residents. Therefore, the size, shape and type
of wind turbine do not influence the efficacy of the EPA Guidelines, provided the particular
arrangement can achieve the criteria (further information on how the size and layout of a wind farm
is accounted for in the assessment process is provided below).
Where achieved, the criteria ensure any audible wind farm noise (whether it be from a large, small,
distant, relatively close, high hub height, large diameter, small diameter or any other potential wind
farm variable) is low enough in level within the existing background noise environment so as to not
unreasonably impact on the health or amenity of the community.
The EPA has conducted recent and extensive research and testing with the finding that the EPA
Guidelines provide an appropriate tool for a contemporary wind farm environmental noise
assessment. Further, the World Health Organisation (WHO) has very recently released
recommendations for noise from wind farms (during the SCAP hearing). Although the noise
descriptors are different, a wind farm complying with the EPA Guidelines will also comply with the
WHO Guidelines (more detail on this is provided below).
33You can also read


