A review of the Land Degradation Neutrality Process - By Ben Gilbey - University of Sussex - IUCN
←
→
Page content transcription
If your browser does not render page correctly, please read the page content below
A review of the Land Degradation
Neutrality Process
By Ben Gilbey – University of Sussex

ECOSYSTEM PROGRAMME, GLOBAL DRYLANDS INITIATIVE
About IUCN
IUCN is a membership Union uniquely composed of both government and civil society
organizations. It provides public, private and non-governmental organizations with the
knowledge and tools that enable human progress, economic development and nature
conservation to take place together.

IUCN provides a neutral space in which diverse stakeholders including governments, NGOs,
scientists, businesses, local communities, indigenous people’s organizations and others can
work together to forge and implement solutions to environmental challenges and achieve
sustainable development.

Working with many partners and supporters, IUCN implements a large and diverse portfolio
of conservation projects worldwide. Combining the latest science with the traditional
knowledge of local communities, these projects work to reverse habitat loss, restore
ecosystems and    improve people’s well-being.

www.iucn.org

https://twitter.com/IUCN/

                                                                                 ii | P a g e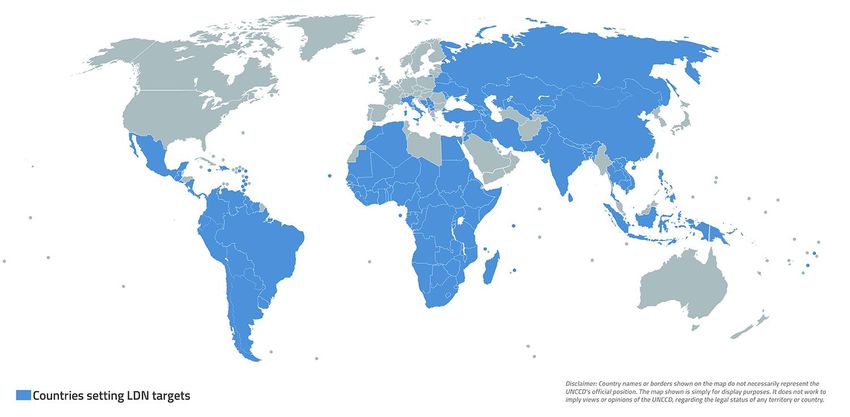
A review of the Land Degradation
Neutrality Process
By Ben Gilbey – University of Sussex
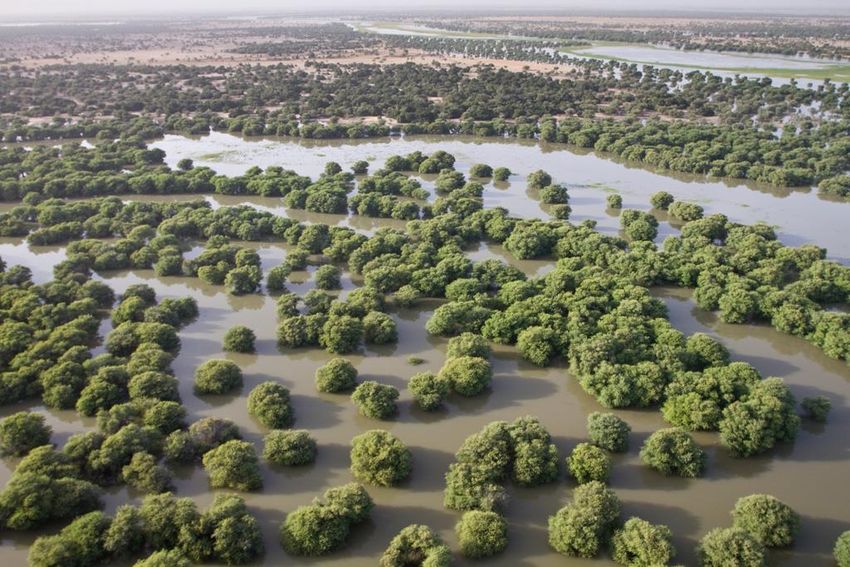
Cover photo: Jean Marc Garreau
Available from: IUCN, International Union for Conservation of Nature
Global Drylands Initiative
P.O. Box 68200, 00200 Nairobi, Kenya
Office Mobile: +254 724 256804/0734 768770
Office No.: +254 (20) 2493561/ (20) 2493565
www.iucn.org/ecosystem-management/global-drylands-initiative
The views expressed in this publication do not necessarily reflect those of IUCN.
iii | P a g e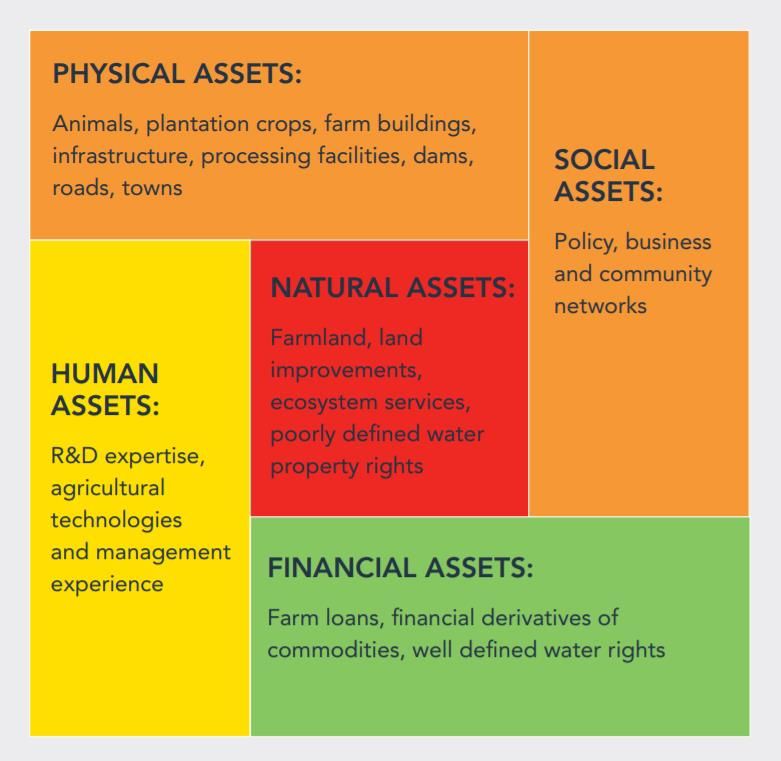
Objectives of the Report
This report seeks to provide a review of the Land Degradation Neutrality (LDN) process to
inform the membership of the International Union for the Conservation of Nature (IUCN). The
report seeks to review how countries have followed recommended guidelines in the LDN
Target Setting Process and will provide recommendations for moving forward in LDN target
setting, monitoring and implementation. It will review the uptake of the recommendations
made in the IUCN (2015) Technical Brief in the LDN process to date. It hopes to inform the
ongoing review process of the LDN Target Setting Process.

Report Methodology
This review draws upon three main sources of data:
1. Semi-structured interviews with 29 actors involved in the LDN process including:
       a.   UNCCD country focal points/LDN national consultants
       b.   UNCCD staff
       c.   Members of the UNCCD Science-Policy Interface
       d.   FAO staff
       e.   IUCN Offices and Commissions
       f.   Economics of Land Degradation Initiative staff
       g.   LDN Fund staff
       h.   Relevant civil society organisations
2. Relevant documentation including the LDN Scientific-Conceptual Framework, the LDN
   Target Setting Guide, the IUCN Technical Brief on LDN and some national LDN target
   setting reports.
3. Academic and grey literature on LDN. Academic literature was located through the
   Google Scholar and Scopus search engines, whilst grey literature was located primarily
   from the UNCCD Knowledge Hub and interviewees recommendations.
This research also informed the author’s master’s dissertation submitted to the University of
Sussex.

                                                                                  iv | P a g e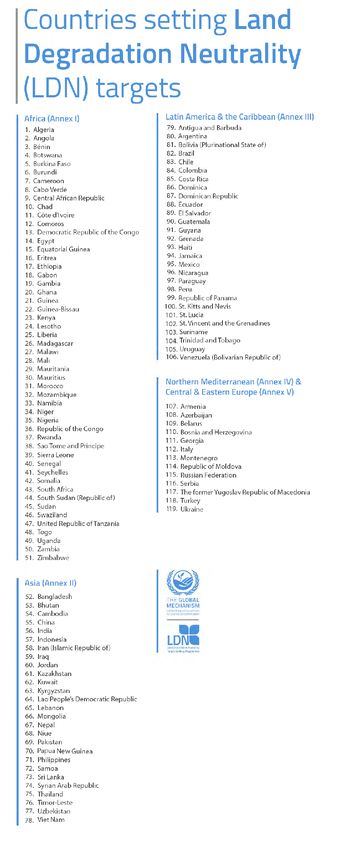
Key Recommendations
Use of adequate evidence
LDN target setting has proceeded on the basis of the three agreed indicators, which
provides a minimum standard that can be applied in all countries. It is recommended
that countries which are yet to set their targets consider applying additional national
data that can strengthen their analysis of land degradation. Countries that have
already established LDN targets will benefit from further validation of those targets,
particularly at the sub-national level where more detailed assessment may be
required to guide investors.
Consultation of key stakeholders
The degree of consultation has been variable: consultation between public sectors has
generally been strong but consultation with nongovernmental actors has been
weaker. Governments are recommended to strengthen consultation and outreach
during LDN implementation in order to generate stronger buy-in and to avoid the risk
of the LDN process being discredited. The success of LDN – as a target that covers all
land within a country – lies in the diversity of actors who adopt LDN as a target.
Application of Integrated Ecosystem Management
Many principles of ecosystem management are implicit in the LDN Scientific and
Conceptual Framework, however, there is still work to be done to incorporate
ecosystem management into LDN implementation. It is crucial to ensure that
ecosystem management is decentralised to the lowest appropriate level which may
prove challenging when targets are set at the national scale. Greater attention is
needed to foster cross-sectoral action and interdisciplinary approaches for LDN, and
to ensure LDN targets are owned and delivered at the sub-national level.
Strengthening of natural resource governance and equity
Land tenure is widely agreed to be important for achieving LDN, as it provides security
for investing in land to financiers and farmers, and additionally, land tenure is central
to ensuring local people, especially the most marginalised, benefit from efforts to
achieve LDN. Governments should ensure that investments in LDN achievement
contribute to strengthening and upholding land tenure and should take action to
monitor the impact on the ground. Time and resources should be allocated during LDN
planning processes for gender assessments of LDN projects, and LDN-activities which
empower women should be encouraged.
Application of the Response Hierarchy
The LDN Response Hierarchy addresses a range of actions (protection, sustainable
management and restoration) that are relevant to different actors, highlighting the
importance of engaging multiple stakeholders in the LDN process. LDN
implementation plans need to reflect this diversity of responses: they should include
clear measures to ensure that response are prioritised appropriately and they need to
mobilise appropriate actors for different response measures. One way of doing this
would be to instate the response hierarchy as a principle into land use planning.
v|Page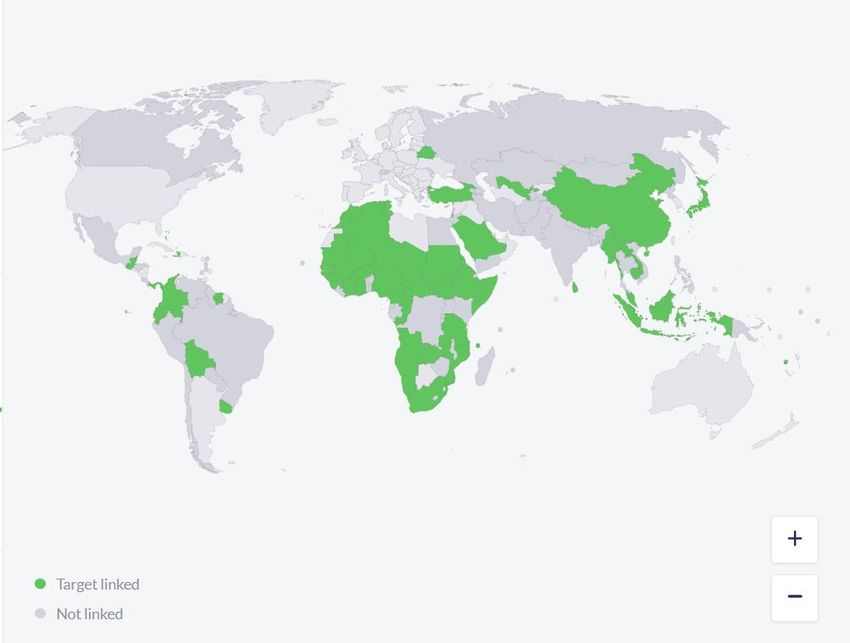
Use of synergies
Synergies clearly exist between LDN, climate change mitigation and adaptation and
biodiversity conservation (as well as many other development goals). Greater efforts
are needed to capture the multiple benefits of LDN actions, for stronger socio-
economic outcomes and greater value for money. It is recommended to capitalise
more effectively on these synergies in policy, investment and in reporting.
Development of innovative funding
Increased efforts are needed to ensure that finance breaks with business-as-usual and
is channelled to verifiable sustainable land management. In particular, a
proportionate amount of LDN finance should be directed to smallholder famers and
livestock keepers.
vi | P a g e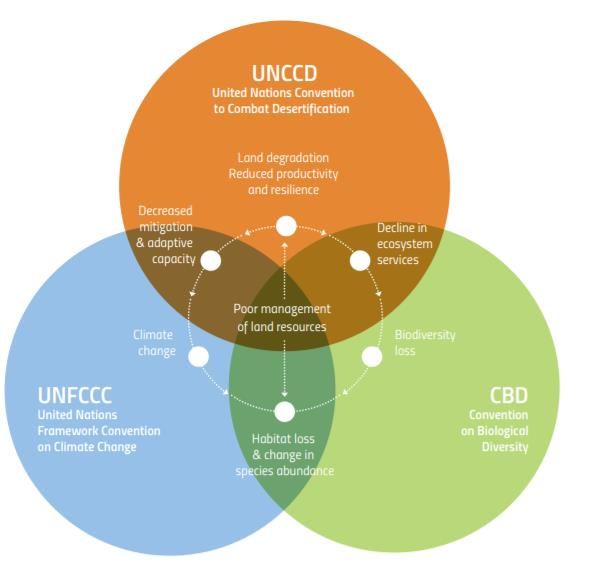
Table of Contents

Objectives of the Report ............................................................................................................ ii
Report Methodology................................................................................................................. iv
Key Recommendations .............................................................................................................. v
1.1 The issue of Land Degradation ........................................................................................... 3
1.2 The LDN Concept ................................................................................................................ 5
1.3 The LDN Pilot Project.......................................................................................................... 8
1.4 The LDN Target Setting Program ........................................................................................ 9
1.5 IUCN and Land Degradation Neutrality ............................................................................ 10
2. Uptake of recommendations in the LDN Process ............................................................ 11
2.1 Use of adequate evidence ................................................................................................ 13
    2.1.1 Findings .................................................................................................................. 15
    2.1.2 2.1.2 Recommendations ........................................................................................ 22
2.2 Consultation of key stakeholders ..................................................................................... 22
    2.2.1 Findings .................................................................................................................. 24
    2.2.2 Recommendations ................................................................................................. 27
2.3 Integrated Ecosystem Management ................................................................................ 27
    2.3.1 Findings .................................................................................................................. 28
    2.3.2 Recommendations ................................................................................................. 30
2.4 Natural Resource Governance and Equity ....................................................................... 30
    2.4.1 Findings - Land Tenure ........................................................................................... 32
    2.4.2 Findings - Gender ................................................................................................... 36
    2.4.3 Recommendations ................................................................................................. 38
2.5 The Response Hierarchy ................................................................................................... 39
    2.5.1 Findings .................................................................................................................. 41
    2.5.2 Recommendations ................................................................................................. 42
2.6 Synergies........................................................................................................................... 43
    2.6.1 Findings .................................................................................................................. 44
    2.6.2 Recommendations ................................................................................................. 48
2.7 Innovative funding............................................................................................................ 48
    2.7.1 Findings .................................................................................................................. 49
    2.7.2 Recommendations ................................................................................................. 53
3. Conclusions ....................................................................................................................... 53
References ............................................................................................................................... 56
Appendices............................................................................................................................... 64
Appendix 1 – list of pilot countries .......................................................................................... 64
Appendix 2 – List of countries setting LDN targets as of September 2018 ............................. 65
Appendix 3 - Identification of principles of the ecosystem approach in the LDN-SCF ............ 66

                                                                                                                             1|Page
List of tables
Table 1 The UNCCD progress indicators from which the LDN pilot project. ............................. 9
Table 2 Key recommendations for the LDN process evaluated by this report........................ 12
Table 3 Available datasets for the three LDN Indicators ......................................................... 16
Table 4 Inclusion of adequate evidence in seven LDN Target Setting Reports according to
LDN Target Setting criteria ....................................................................................................... 19
Table 5 Stakeholder participation in the LDN target setting process. ..................................... 23
Table 6 Comparison of land degradation challenges for women, men and youth in Ethiopia.
.................................................................................................................................................. 31
Table 7 ILC’s indicators to assess ‘locally managed ecosystems’ in its Dashboard monitoring
tool (the Dashboard is being piloted so indicators may be reviewed). Source: personal
correspondence. ...................................................................................................................... 35
Table 8 Women’s representation at UNCCD COP 11. Source Prebble et al. (2015)................ 36
Table 9 Gender Procedures checklist from IUCN’s (IUCN 2017a) gender-responsive
restoration guidelines .............................................................................................................. 37
Table 10 Reasons for failure of plans and policies to avoid impacts on biodiversity and
ecosystem services. ................................................................................................................. 40
Table 11 SDG targets and associated indicators that could inform LDN monitoring. ............. 45
List of Figures
Figure 1 Map of the extent of land degradation in different global ecosystems, overlaid with
a map showing the degree of agreement in the literature about these estimates. ................. 5
Figure 2. Intertwined threats and the objectives of the Rio conventions. ................................ 6
Figure 3. World map showing the 119 countries which have committed to setting LDN
targets. ..................................................................................................................................... 15
Figure 4 Map showing countries in which NDCs are linked to SDG Target 15.3. .................... 44
Figure 5 Agricultural assets at risk from land degradation, with colours indicating degree of
vulnerability, from red (high vulnerability) to green (low vulnerability). ................................ 50
2|Page1. Introduction
1.1 The issue of Land Degradation
Land degradation refers to the reduction or loss of the biological or economic productivity
and complexity of land (UNCCD 2016a). This entails reduced food production, water storage,
biodiversity and carbon sequestered in soils and vegetation (IUCN 2015; Laban, Metternicht,
and Davies 2018).
The Intergovernmental Science-Policy Platform on Biodiversity and Ecosystem Services
(IPBES) recently provided a comprehensive assessment of land degradation, declaring it to be
a ‘pervasive and systematic phenomenon’ that ‘occurs in all parts of the terrestrial world’
(IPBES 2018). Consequently, land degradation’s impact upon people is vast. 1.3 billion people
live on degrading agricultural land (UNCCD 2017b), and land degradation negatively impacts
the well-being of at least 3.2 billion people globally (IPBES 2018). Land degrading processes
such as deforestation or soil erosion also contribute to climate change (IPBES 2018), with 25%
of anthropogenic greenhouse gas emissions resulting from Agriculture, Forestry and Other
Land Use (IPCC 2014). Additionally, land degradation reduces the adaptive capacity of
societies and ecosystems to cope with climate change impacts (IPBES 2018). Land degradation
may also increase food insecurity, by reducing production and increasing uncertainty, thereby
leading to higher food prices (Davies 2016). The Economics of Land Degradation (ELD)
initiative estimates the cost of lost ecosystem services to land degradation to be between 6.3
and 10.6 trillion US$ per year, equivalent to 10-17 per cent of global GDP1 (ELD 2015).
Estimates of the extent of land degradation have varied hugely due to divergent definitions
of degradation and different approaches to measurement (IUCN 2015). Divergent definitions
emerge in part because the concept of land degradation ‘is a context-specific and value-laden
concept’ (Caspari et al. 2014). Whilst deforestation may be seen as degradation by ecologists,
cattle ranchers may perceive it as increasing the productivity of land (Blaikie and Brookfield
1987). Therefore, any assessment of degradation implies valuation against a subjectively
determined value of land (Hobbs 2016; Blaikie and Brookfield 1987). Indeed, degradation of
agricultural lands has predominantly been judged against a particular production function
(Caspari et al. 2014). For example, woody-plant encroachment increases aboveground and
belowground carbon, which is often used as an indicator of land degradation, but from the
socioeconomic perspective of livestock production, the increase in woody plant is perceived
as degradation as it reduces the carry capacity for livestock and exposes the soil to processes
of wind and water erosion (Angerer et al. 2016).
Further disagreements emerge around finding the appropriate way to measure land
degradation. Land degradation is often assessed through measurements of net primary
productivity (NPP), which captures how much energy plants fix as biomass through
photosynthesis (Caspari et al. 2014). However, this assumes that all increases in vegetation
are positive, when some forms of vegetation increase may lead to a reduction in the
ecological complexity and land productivity of certain land types (IUCN 2015). Consequently,
1
This is based on valuation of ecosystem services which are currently unvalued or undervalued in the global
economy. The lower estimate of 6.3 trillion is derived from a proxy measure based on human appropriation of
net primary productivity (NPP). The higher estimate of 10.6 trillion is based on a proxy measurement which
compares actual NPP with potential NPP of land. See ELD (ELD 2015) Chapter 3a.
3|Pagefalse positive results of land productivity may arise from this measurement, such as around
bush encroachment in rangelands in Southern Africa (Minelli, Erlewein, and Castillo 2017).
Additionally, assessments of global land degradation, such as the one used in the World Atlas
of Desertification, have used assessments taken at a single point in time, ‘rather than being
based on change in key variables over a known period’ (Mortimore 2016). This is problematic
because its implicit basis is in equilibrium ecology, which suggests ecologies are in a self-
regulating equilibrium state, unless there is human interference (Mortimore 2016). This has
frequently led to the blaming of local populations for land degradation, with explanations
often attributing degradation to communal management systems which are seen to cause
overgrazing in these tragedy of the commons type arguments (Vetter 2005). In some cases,
this has led to populations expulsion and exclusion from land under the assumption it will
return to its original pre-disturbance state (Andersson, Brogaard, and Olsson 2011).
Orthodox thinking on land degradation and desertification has been challenged by insights on
non-equilibrium ecological systems, which have highlighted that many ecologies are strongly
influenced by disturbance from factors such as variable rainfall, fire or human influence
(Briske, Illius, and Anderies 2017; Vetter 2005; Mortimore 2016). Dryland ecologies in
particular are influenced by non-equilibrium dynamics, meaning any dryland degradation
measurement taken over a short time period, is inadequate, as it cannot account for this
dynamism (Reynolds et al. 2007; Mortimore 2016). In response to these changes, ecosystems
may not return to their original equilibrium point and instead may reorganise around an
alternative state (Miller et al. 2011; Briske, Illius, and Anderies 2017).
Recognising this dynamism, the objective of environmental management becomes the
facilitation of ecological resilience ‘defined as the capacity of systems to absorb disturbances
and reorganize while undergoing change so as to still retain essentially the same function,
structure, identity, and feedbacks’ (Briske, Illius, and Anderies 2017). This emphasis on
resilience often incorporates farmers and pastoralists’ environmental knowledge and
livelihood strategies as enabling adaptation to ecological state-changes (Reynolds et al. 2007;
Mortimore 2016). However, severe disturbance may take a system beyond a resilience
threshold from which they cannot regenerate earlier ecosystem structure and function
(Escribano et al. 2017; Bestelmeyer et al. 2015).
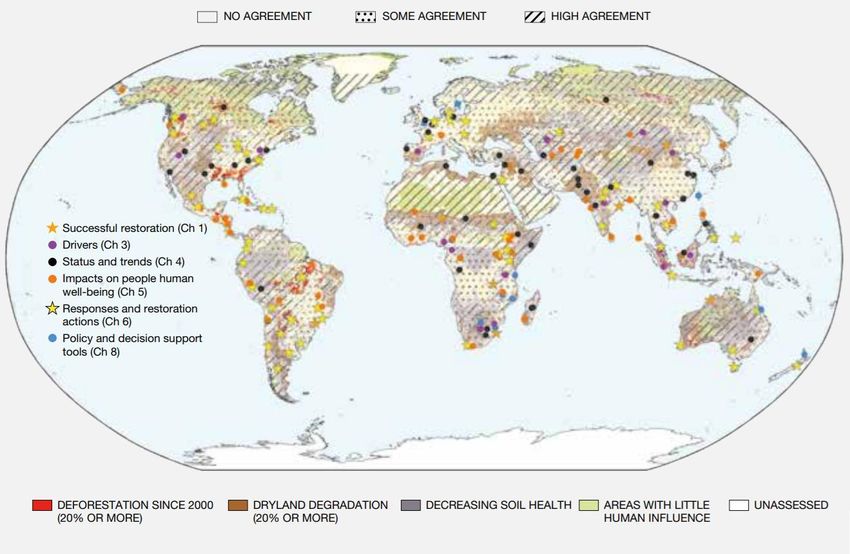
Whilst no widely-accepted, global map of land degradation exists, the IPBES (IPBES 2018)
assessment report complies several peer-reviewed, best practice maps of the main types of
land degradation. This map, reproduced in Figure 1, also incorporates Gibbs and Salmon’s
(Gibbs and Salmon 2015) map of the degree of agreement in the literature.
4|PageFigure 1 Map of the extent of land degradation in different global ecosystems, overlaid with a map showing the degree of agreement in
the literature about these estimates.
Source: IPBES (2018)
1.2 The LDN Concept
Following the 1992 Rio Earth Summit, the international community established three
conventions to enable sustainable development: The United Nations Framework Convention
on Climate Change (UNFCCC); the Convention on Biological Diversity (CBD); and the United
Nations Convention to Combat Desertification (UNCCD). As Figure 2 shows, each of these
conventions addresses unsustainable use of land resources. However, the land degradation
issue has been most central to the activities of the UNCCD, as desertification is understood as
‘land degradation in arid, semi-arid and dry sub-humid areas’ (UNCCD 2016a). Therefore, the
UNCCD’s mandate on land degradation is primarily limited to the drylands (Boer and Hannam
2017). Commentators have noted that compared to the CBD and UNFCCC, the UNCCD is ‘a
forgotten stepsister’ (Welton, Biasutti, and Gerrard 2015), with a ‘low profile and scant
resources’ (Safriel 2017). However, the LDN concept is raising the profile of the UNCCD and
the challenge of land degradation.
The LDN concept was first brought to international attention in 2012 through the document
‘Zero Net Land Degradation: A New Sustainable Development Goal (SDG) for Rio+20’ (Lal,
Safriel, and Boer 2012). The UNCCD used this document to advocate the inclusion of a
reference to the LDN in the Rio+20 outcome document ‘The Future We Want’ (Chasek et al.
2015; UN 2012). This inclusion was significant because this document formed the basis for
the discussion of the Sustainable Development Goal (SDG) targets (Chasek et al. 2015).
5|PageFigure 2. Intertwined threats and the objectives of the Rio conventions.
ined
objectives
ntions.
2017b)
Source: UNCCD (2017b).
This paved the way for LDN to be adopted as SDG Target 15.3 which states ‘By 2030, combat
desertification, restore degraded land and soil, including land affected by desertification,
drought and floods, and strive to achieve a land degradation-neutral world’ (UN 2015). The
12th Conference of the Parties to the UNCCD (COP 12) subsequently integrated LDN into the
UNCCD process in October 2015. The UNCCD secretariat has since become the custodian
agency for SDG indicator 15.3.1 on LDN, meaning that national LDN reports for the UNCCD
are also used to report to the High-level Political Forum on Sustainable Development (UNCCD
2017d).
An intergovernmental working group (IWG) was established at COP 11 to provide clarity on
the LDN concept. This defined LDN as ‘a state whereby the amount and quality of land
resources necessary to support ecosystem functions and services and enhance food security
remain stable or increase within specified temporal and spatial scales and ecosystems’ (ICCD
2016). This definition was then endorsed at COP 12 (decision 3) (ICCD 2016). The IWG also
6|Pagenoted that there are two ways to implement LDN: ‘“(a) Prevent, avoid or minimize land
degradation [...] through, inter alia: (i) national and local land use planning that fully accounts
for the potential and resilience of land resources; (ii) the adoption of sustainable land
management practices”; and as the second basic pathway: “(b) Rehabilitate or restore
degraded land [...] by reducing the drivers and impacts of current land degradation processes
and by the implementation of projects and other measures for rehabilitation and recovery”
(Minelli, Erlewein, and Castillo 2017).
COP 12 then requested the UNCCD Science-Policy Interface (SPI) to develop the “Scientific
Conceptual Framework for Land Degradation Neutrality” (LDN-SCF) on the basis of the IWG’s
definition and guidance. The LDN-SCF seeks ‘to provide a scientifically-sound basis for
understanding and implementing LDN and to inform the development of practical guidance
for pursuing LDN and monitoring progress towards the LDN target’ (Cowie et al. 2018). As the
most authoritative document on the LDN concept, the LDN-SCF will be examined throughout
this review.
As Safriel (Safriel 2017) suggests, the emergence of LDN as a mechanism to address land
degradation globally was triggered by the failures of the UNCCD to reduce desertification. The
difficulties of measuring and defining land degradation and desertification mean the UNCCD
has long been undermined by ‘the absence of a clear overarching goal and quantitative
targets that could guide action and make progress measurable’ (Minelli, Erlewein, and Castillo
2017). Additionally the UNCCD was founded in 1994 as the ‘Convention to Combat
Desertification in Countries Experiencing Serious Drought and/or Desertification, Particularly
in Africa’ (Boer and Hannam 2017), meaning its geographic focus was confined to drylands
suffering from drought and desertification. This, along with a lack of a quantifiable target led
to ‘an implicit denial of land degradation as an issue of global concern, and to a low
appreciation of the UNCCD as an instrument worthy of substantial support’ (Chasek et al.
2015).
The low recognition of land degradation may explain why Millennium Development Goal
(MDG) 7 on environmental sustainability referred to both biodiversity and climate change,
but not to land degradation (Chasek et al. 2015). Indeed, the MDGs had limited impact on the
drylands, with one report calling the poor people of the drylands ‘The Forgotten Billion’
(Middleton et al. 2011).
Several features of the LDN concept enable it to reposition the issue of land degradation as
an international policy priority. Firstly, in developing the concept the UNCCD drew inspiration
from the UNFCCC and CBD and incorporated an offsetting mechanism (Safriel 2017). The
target of land degradation neutrality is significant, because it galvanises support around a
target of ‘no net loss’ of land to degradation, rather than seeking to prevent land degradation
entirely (Orr et al. 2017). This recognises that the multiple pressures on land mean that
completely preventing land degradation is ‘currently too ambitious and hence not likely to be
attainable’, but that land productivity and ecosystem services can be restored (Chasek et al.
2015). According to the LDN-SCF (Orr et al. 2017), this is the ‘novel aspect’ of LDN that
distinguishes it from previous attempts to combat land degradation, and is achieved through
the ‘mechanism for neutrality’ where land use decision-makers can counterbalance losses to
degradation by equivalent gains through restoration.
Some land use policy programmes already incorporate an offsetting principle, for example
wetland mitigation banking programmes in the United States or the international reducing
7|Pageemission from deforestation and forest degradation (REDD+) program (Welton, Biasutti, and
Gerrard 2015). However, as Welton et al. (Welton, Biasutti, and Gerrard 2015) notes, whilst
these were limited to a particular land type, LDN ‘capaciously includes all types of land
degradation within its purview’. This means LDN surpasses these programs in scope and
ambition.
Another element of the LDN concept that is helping it reposition the land degradation issue
is its global character. SDG Target 15.3 aims for a ‘land degradation neutral-world’, which
acknowledges that land degradation is a problem common to all regions of the terrestrial
world (UN 2015). This is consistent with the universal character of the SDGs, which unlike the
MDGs include developed countries, recognising ‘that no country is truly ‘developed’ in terms
of sustainable development’ (Stafford-Smith et al. 2017). Indeed, the LDN-SCF was developed
to be ‘applicable across all land types, land uses and ecosystem services’ (Cowie et al. 2018).
Whilst SDG target 15.3 aspires to an LDN world, to achieve this countries must voluntarily
adopt LDN targets at the national level, and determine the policies, rules and funding
mechanisms that enable LDN-related activities to be achieved on the ground (Orr et al. 2017).
1.3 The LDN Pilot Project
LDN’s potential to ‘tie states to tangible targets and force the UNCCD to be treated with a
greater degree of seriousness’ has created some controversy (UNCCD 2015). At COP 11 in
September 2013, delegates raised concerns about the lack of clarity around the concept and
its potential to expand the UNCCD’s remit beyond drylands (Welton, Biasutti, and Gerrard
2015) One state even proposed the deletion of any reference to zero net land degradation or
a land degradation neutral world in UNCCD outcome documents (Welton, Biasutti, and
Gerrard 2015). Interviewees highlighted that some countries were wary of LDN due to
concerns of the pressure it might place on domestic industries such as forestry and
agriculture.
To overcome such concerns and reach agreement amongst parties to the convention, the
UNCCD initiated a LDN pilot project in 2014 (Safriel 2017). The pilot was designed to meet
three objectives (UNCCD 2016b). Firstly, to identify and test relevant indicators for monitoring
and planning LDN. Secondly, to formulate LDN national voluntary targets and measures to
meet them. Thirdly, to integrate the targets into national sustainable development policies,
including UNCCD National Action Programmes (NAPs) and UNFCCC Nationally Determined
Contributions (NDCs). By creating national LDN targets ahead of formal agreement on LDN’s
status within the convention the pilot project sought to create ‘political momentum’ to ‘push
the concept along’ (UNCCD 2015).
The pilot project selected three of the six official UNCCD official indicators (see Table 1). The
three selected were trends in land cover, land productivity and carbon stocks above and
below ground (UNCCD 2016b). According to the pilot project coordinator, these where
chosen as they were ‘the three that were tangible and measurable’ unlike indicators such as
the one on poverty which ‘you can’t rely on in a reliable and meaningful manner’2. Targets
were successfully set in 12 out of the 14 pilot countries before COP 12 in 2015 (see Appendix
1 for a list of pilot countries). This was significant because the pilot ‘demonstrated the
possibility of setting a target and the feasibility of an approach to achieving it’, thus ‘moving
LDN beyond something which states could give purely rhetorical support to’ (UNCCD 2015).
2
Quotes from interviewees have been italicised to differentiate them from quotes from written sources.
8|PageAdditionally, the pilot demonstrated it was possible to create a measurement of land
degradation in countries with very limited data monitoring and analysis capacity, through
providing them with adequate global datasets where national datasets were insufficient
(UNCCD 2016a).
Table 1 The UNCCD progress indicators from which the LDN pilot project.
Related Strategic Objective: Indicator Metrics/Proxies
Strategic objective 1: To Trends in population living Poverty severity
improve the living below the relative poverty or
conditions of affected line and/or income
populations inequality in affected areas Income inequality
Trends in access to safe Proportion of population
drinking water in affected using an improved drinking
areas water source
Strategic objective 2: To Trends in land cover Vegetative land cover
improve the conditions of
Trends in land productivity Land productivity dynamics
ecosystems
or function of the land
Strategic objective 3: To Trends in carbon stocks Soil organic carbon stock
generate global benefits above and below ground
through effective
Trends in abundance and Global Wild Bird Index
implementation of the
distribution of selected
UNCCD
species
Source: (UNCCD, 2008, 2013a).
The inclusion of an indicator on soil organic carbon was important for showing the synergies
between achieving land degradation neutrality and climate change mitigation. Benefits were
highlighted in terms of monitoring, with one pilot country, Italy, using the IPCC’s methodology
to report soil organic carbon to both the UNCCD and the UNFCCC. Advantages were also
shown with NDCs, with Belarus using peatland restoration to help meet both LDN and climate
change mitigation targets (UNCCD 2016b). Furthermore, the pilot LDN targets include actions
that contribute to national obligations under the CBD, as well as other national commitments
on sustainable development (UNCCD 2016a). Such synergies in the goals, implementation and
monitoring of different sustainable development goals is important to ensuring LDN is not
seen as an additional burden to countries (Orr et al. 2017).
1.4 The LDN Target Setting Program
Following the momentum created by the adoption of LDN as SDG Target 15.3, SDG 15.3 (LDN)
was integrated into the UNCCD at COP 12 in October 2015 (decision 3) as ‘a strong vehicle to
drive the implementation of the UNCCD’ (ICCD 2016). The key question then became how to
translate the SDG target on LDN into national plans and policies (Minelli, Erlewein, and Castillo
2017).
As a first step towards implementing LDN, COP 12 invited country parties ‘to formulate
voluntary targets to achieve LDN in accordance with their specific national circumstances and
development priorities’ (ICCD 2016). Crucially, all countries were invited to set LDN targets,
rather than just parties categorised as ‘affected’ under the convention, making the UNCCD’s
9|Pagework the guiding framework for addressing land degradation globally (Minelli, Erlewein, and
Castillo 2017).
Parties of the Convention instructed the UNCCD secretariat to further develop and facilitate
the use of the UNCCD indicator framework to establish national baselines and measures to
achieve LDN (Minelli, Erlewein, and Castillo 2017). Consequently, the UNCCD’s Global
Mechanism established the ‘LDN Target Setting Programme’ (LDN-TSP) at the end of 2015.
The LDN-TSP issued comprehensive guidance to countries on how to establish LDN Targets in
its technical guide (see UNCCD, 2016a).
The SDG 15.3 (LDN) indicator is the ‘Proportion of land that is degraded over total land area’
(UNCCD 2016a). This is computed using the three sub-indicators the pilot project selected
from the UNCCD’s already established indicator framework (shown in Table 1): land cover and
land cover change; land productivity; and carbon stocks above and below ground. The pilot
project demonstrated these were measurable diverse biophysical contexts, and with limited
data collection capacities. Furthermore, global datasets and corresponding methodologies
exist to compute the data where national data is inadequate. The provision of this global
“default” data and related methodologies has been one of the core responsibilities of the
LDN-TSP (Minelli, Erlewein, and Castillo 2017). The LDN-TSP also aids countries in national
data collection and identification of land degradation drivers and appropriate counter-
measures (Minelli, Erlewein, and Castillo 2017).
Additionally, the LDN-TSP aims to develop and support large-scale initiatives that will
contribute to LDN, which are labelled ‘LDN transformative projects and programmes’ (UNCCD
2017c). These, along with ‘innovative finance’, are seen by UNCCD Executive Secretary
Monique Barbut as ‘at the core of successful action to achieve Land Degradation Neutrality’
(UNCCD 2017c). The UNCCD (UNCCD 2017c) identify five features to such projects. Firstly,
they consider LDN data and contribute to LDN targets. Secondly, they deliver multiple benefits
to the SDGs and the objectives of three Rio Conventions. Thirdly, they build on good practices
and promote uptake of technologies to scale up what already works. Fourthly, they enhance
national capacity, through institutional improvements and participatory decision-making.
Fifthly, they leverage finance including public funds, climate finance and seek to use blended
finance to deploy private capital.
The progress towards target setting is currently being reported and will be reviewed at the
17th session of the Committee for the Review of the Implementation of the Convention (CRIC)
in January 2019 (IISD, n.d.). This review hopes to inform reflection on the LDN process in the
run up to the CRIC.
1.5 IUCN and Land Degradation Neutrality
As one of the UNCCD’s partner organisations, IUCN plays a key role in implementing the
convention and in highlighting the role biodiversity and conservation play in combatting land
degradation. This reflects IUCN’s mandate as the largest professional global conservation
network with more than 1,200 member organisations including 200+ government and 900+
non-government organisations, as well as 11,000 voluntary scientists and experts.
IUCN’s engagement in the LDN process began with a major event organised at the second
UNCCD Science Conference in Bonn in 2012. In response to concerns raised at this event by
IUCN members, further consultations were held with members and commissions, leading to
10 | P a g ethe publication in 2013 of the Technical Guide “Land Degradation Neutrality: implications and
opportunities for conservation”. This was updated in a second edition in 2015.
This technical brief was important in voicing the concerns and priorities of conservation actors
in the development of the LDN-SCF by the UNCCD SPI. It was circulated amongst SPI members
before the initial workshops on the development of the LDN-SCF and key concerns from it
were highlighted by the IUCN official observer to the SPI. The report made a number of
recommendations, many of which were reflected in the final LDN-SCF. The primary goal of
this review is to evaluate the uptake of key recommendations from the IUCN (IUCN 2015)
Technical Brief, as well as other key recommendations formulated in the LDN Target Setting
Guide (UNCCD 2016a) and the LDN-SCF (Orr et al. 2017), in national LDN target setting
processes.
The central goal of the joint IUCN-UNCCD work plan for 2015-2020 is to: ‘Support progress
towards policies and programmes that deliver Land Degradation Neutrality through the
application of Nature Based Solutions (at national and sub national levels)’ (IUCN 2016). IUCN
and UNCCD have worked together to strengthen policy and institutional support for LDN
implementation, collaborating primarily on issues of gender and governance. Since 2017,
IUCN has received Global Environmental Facility (GEF) funding to help implement 75 LDN
country target setting processes (IUCN 2017b). Additionally, IUCN’s Global Gender Office
recently received funding from the Swedish International Development Cooperation Agency
(SIDA) to mainstream gender in LDN target setting and implementation and has set up a help
desk to advise countries on gender sensitivity in their national LDN target setting processes
and implementation. IUCN and the UNCCD are also seeking to progress in using available IUCN
datasets and methodologies to strengthen LDN target setting, as well as developing large
scale transformative initiatives on landscape restoration (IUCN 2017b).
2. Uptake of recommendations in the LDN Process
The aim of this report is to evaluate IUCN’s influence on the LDN process and to report on
how LDN standards and implementation compares with IUCN’s recommendations and other
key recommendations. There are inevitable challenges of attribution between LDN outcomes
and IUCN’s recommendations. Table 2 shows the key recommendations under review in this
report and their source in the IUCN (IUCN 2015) technical brief, the LDN Target Setting
Technical Guide (UNCCD 2016a), or the LDN-SCF (Orr et al. 2017). The following seven sections
will evaluate the extent to which these concerns have been addressed in the LDN process,
primarily in the LDN target setting process, but also in LDN guidance from the UNCCD, in the
LDN Fund and the implementation of projects and programmes to meet the LDN target. This
review is intended to be indicative to help inform future IUCN engagement with LDN, and the
UNCCD’s ongoing evaluation of the LDN target setting programme will provide a more
extensive evaluation of the LDN target setting process.
11 | P a g eTable 2 Key recommendations for the LDN process evaluated by this report
Key recommendations Source
identified
Use of adequate evidence in ‘LDN should proceed on the basis of adequate evidence
setting LDN targets and monitoring, without evidence-collection becoming a
barrier to attaining the LDN goals.’ (IUCN 2015).
‘Principles related to monitoring…
Monitoring and reporting should be primarily based on
national data sources, including aggregated sub-national
data…
Make use of additional national and sub-national
indicators…
Apply in-situ validation and local knowledge’ (Orr et al.
2017)
Consultation of key ‘Stakeholders should ideally be integrated into all stages
stakeholders of the LDN target setting process’ (UNCCD 2016a)
‘For any LDN project to be effective, governments must
develop inclusive, participatory consultation and
outreach programmes to engage stakeholders in the co-
production of knowledge and mutual learning at both
the national and local levels, which could be
accomplished through the establishment or leveraging of
multi-stakeholder platforms at each relevant scale, with
established links across scales’ (Orr et al. 2017)
Inclusion of integrated ‘Integrated ecosystem management approaches should
ecosystem management be central to achieving LDN.’ (IUCN 2015)
‘Apply an integrated land use planning principle that
embeds the neutrality mechanism in land use planning’
(Orr et al. 2017)
Strengthening natural ‘Natural resource governance should be strengthened to
resource governance and enable equitable LDN outcomes.’ (IUCN 2015)
equity ‘The objectives of LDN are:… reinforce responsible and
inclusive governance of land’ (Orr et al. 2017)
Adoption of the ‘It is preferable to adopt a mitigation hierarchy for
response/mitigation hierarchy biodiversity and ecosystem impacts with priority placed
first on prevention or avoidance of land degradation,
followed by minimisation through improved land
management practices, and then restoration.’ (IUCN
2015)
‘The LDN response hierarchy is an overarching principle
that guides decision-makers in planning measures to
achieve LDN.’ LDN-SCF (Orr et al. 2017)
12 | P a g eEstablishment of synergies ‘Achieving LDN should build on the synergy with other
with other conservation and conservation approaches and targets’ (IUCN 2015).
development approaches and ‘The objectives of LDN are:… seek synergies with other
targets social, economic and environmental objectives’ LDN-SCF
(Orr et al. 2017)
Leveraging of innovative ‘Innovative funding should be developed to support
funding implementation of action towards LDN.’ (IUCN 2015)
‘The achievement of LDN is linked to sufficient financing.
Successful implementation of LDN initiatives depends on
the effective mobilization of resources from all sources,
including national budgets, external donors and
innovative sources of finance, ideally concurrent with
local and national programming.’ (Orr et al. 2017)
Source: IUCN (2015), (Orr et al. 2017; Cowie et al. 2018); (UNCCD 2016a)
2.1 Use of adequate evidence
‘LDN should proceed on the basis of adequate evidence and monitoring, without evidence-
collection becoming a barrier to attaining the LDN goals.’ IUCN Technical Brief 2015
One of the key concerns in IUCN’s (IUCN 2015) technical brief was that LDN should proceed
on the ‘basis of adequate evidence and monitoring, without evidence collection becoming a
barrier to attaining LDN goals’. This recommendation highlighted the challenge of ensuring
adequate rigour without making rigour a barrier to progress. Adequate evidence and
monitoring must track LDN progress, unwanted externalities from restoration and sustainable
land management (SLM), and the impact of SLM and land restoration on biodiversity and
social outcomes (IUCN 2015). This challenge is compounded by the difficulties noted in
section 1.1 in defining and measuring degradation, given it is a highly contextual and value-
laden concept.
The three indicators for LDN are land cover, land productivity and carbon stocks, whilst their
corresponding metrics are land cover change, net primary productivity and soil organic
carbon (Orr et al. 2017). Together these three biophysical indicators can be used to monitor
the quantity and quality of land-based natural capital and the ecosystem services that flow
from that land base (UNCCD 2016a). Due to the limited availability of datasets for these
metrics in some countries, the UNCCD (UNCCD 2016a) recommends a ‘tiered approach’ for
countries to compute the three indicators, which can use data from three levels. Tier 1 is data
from global or regional Earth observation, whilst tier 2 comprises national statistics acquired
for administrative purposes, and tier 3 is acquired from field surveys, assessments and ground
measurements. By integrating data from these three tiers, this approach seeks to allow
‘national authorities to use methods consistent with their capacities, resources and data
availability’, whilst still producing data that is comparable at the global scale (UNCCD 2016a).
This tiered approach to data collection on LDN is not to be confused with the classification of
SDG indicators into three tiers3, on the basis of their level of methodological development
3
The LDN tiered approach to data collection will be referred to using numbers, i.e. Tier 1, Tier 2 and Tier 3;
whilst the classification of SDG indicators methodological development and data availability will be referred to
using roman numerals, i.e. Tier I, Tier II and Tier III, to differentiate between them.
13 | P a g eand the availability of data at the global level. The SDG indicator 15.3.1 - proportion of land
that is degraded over total land area – is comprised of the three (sub)-indicators noted above:
land cover, land productivity and carbon stocks. 15.3.1 currently has Tier II status, meaning it
is conceptually clear and there is a standardised methodology to measure it globally (IAEG-
SDGs, 2018). However, 15.3.1 can be expected to move to Tier I status after the end of the
current reporting phase to the UNCCD, as Tier I status is granted when 50% of UN member
countries submit data for the indicator regularly (Sylla and Nairesiae 2018). This is a success
for the LDN process, as under the SDG data-driven development agenda there is always a risk
that only ‘what gets measured, gets managed’ (Chattopadhyay 2016)
One of the major components of the LDN-TSP is to provide the default global data (tier 1) to
countries for their use and validation where national data was lacking. The default data on
land cover was provided by the European Space Agency Climate Change Initiative Land cover
dataset and defined by land cover classes derived from the Food and Agriculture
Organisation’s (FAO) Land Cover Meta Language hierarchical classification (UNCCD 2016a).
The default data for land productivity, measured by net primary productivity, used the Joint
Research Centre’s Land Productivity Dynamics dataset, which takes a Normalised Difference
Vegetation Index (NDVI) measured at 10-day intervals between 1999 and 2013 (UNCCD
2016a). Finally, the default data provides a SOC baseline from the ISRIC’s SoilGrids250m global
soil mapping product and uses IPCC methodology to predict changes (UNCCD 2016a). The
baseline for all three indicators is calculated over 10-15 years, usually between 2000 and
2015, as ‘the condition of land is highly variable both spatially and temporally, due to climate
variability and the variety of human activities on the land’ (UNCCD 2016a). This is an
improvement over past assessments of land degradation based on a single measurement in
time and can better assess degradation in non-equilibrium ecologies (Mortimore 2016).
The trends in the default (tier 1) data should be compared with tier 2 and tier 3 data wherever
possible to facilitate interpretation and validation with national or local information (UNCCD
2016a). It is particularly important changes in land cover are contextualised with national or
local information. This was highlighted by Namibia’s experience in the pilot, where
measurement of NPP created false positives, as bush encroachment increased NPP despite
reducing ecological complexity (UNCCD 2016b). False negative results may also occur, for
example, when NPP is lowered due to conversion of irrigated agriculture to dryland
pastoralism for water management purposes (Cowie et al. 2018).
The necessity for such local interpretation and validation of land degradation trends is partly
why the LDN-SCF encourages the establishment of national or subnational indicators (Orr et
al. 2017). Furthermore, complementary indicators may be useful if countries wish to track
progress towards other SDGS or other national indicators in LDN projects and monitoring (Orr
et al. 2017).
The LDN-SCF (Orr et al. 2017) suggests countries include assessments of biodiversity through
IUCN’s Red List Index, adopting the suggestion made in IUCN’s (IUCN 2015) technical brief.
Spatial data from the Red List of Threatened Ecosystems and the Red List of Threatened
Species could be overlaid or compared with maps of land degradation produced through LDN
target setting. These could then inform land use planning in designing LDN interventions that
target conservation of threatened ecosystems and species as well as combatting land
degradation. The Red List Index was used by Visconti et al. (2015) to model the impacts of
biodiversity of different development scenarios. The Red List Index also provides information
of the threats and conservation actions for each threatened ecosystem and species.
14 | P a g eTherefore, if used alongside data from LDN target setting, the Red List Index could be used to
model the best development scenarios for combatting land degradation and conserving
biodiversity. Additionally, the Red List Index is used as an indicator in the CBD’s 2011-2020
Strategic Plan for Biodiversity (CBD, 2014), so its incorporation into LDN would strengthen
synergies with the CBD’s goals.
2.1.1 Findings
Establishment of LDN Targets:
119 countries have committed to setting LDN targets as of September 2019. Figure 3 provides
a map of which countries these are, whilst a full list can be found in Appendix 2. Of these 60+
countries have set national targets which have been validated by a multi-stakeholder process.
An estimated 30 of these countries have adopted these targets at the government level.
In the seven national LDN target setting reports analysed (see Table 4), LDN targets had been
set at the national level, with three also setting targets at the subnational and district level.
Some of these had set targets that went beyond achieving LDN and aimed for net gains by
2030. Others used specific targets related to the sustainable use and rehabilitation of
particular land classes and regions.
Figure 3. World map showing the 119 countries which have committed to setting LDN targets.
Measurement of three LDN indicators:
A number of global datasets are coming online which provide data which could be used to
compute the three LDN indicators. See Table 2 for a list. However, one interviewee
highlighted that there was significant difference between ISRIC’s SoilGrids250m product
assessment of SOC, which relied more on remote sensing, and FAO’s Global Soil Organic
Carbon map’s (GSOC), which centred on a much greater number of sample plots (1 million).
Of the 60 countries who have set national baselines, roughly half used the default data
exclusively. National data has been used most frequently for land cover and least for SOC. The
UNCCD (UNCCD 2016a) suggest that assessment of the default data ‘can be substituted or
complemented by national official data series on the same indicators’. In keeping with this
advice, where national data exist but does not provide full coverage or does not conform to
15 | P a g eUNCCD’s reporting needs, countries have compared the default data against this national
data to identify discrepancies and to assess land degradation trends.
Two main barriers to using national datasets were identified by interviewees. Firstly, lack of
national datasets, or lack of datasets with full national coverage. Secondly, datasets might
exist for the three indicators but were measured using categories or at scales incompatible
with the LDN reporting process. For example, one interviewee reported comprehensive
national data on land cover existed in South Africa but could not be used in reporting to the
UNCCD, because it did not conform to the FAO land cover classes used by the UNCCD for LDN
reporting.
Table 3 Available datasets for the three LDN Indicators
Land Cover Land productivity dynamics Soil Organic Carbon
(LPD)
European Space Agency European Commission’s International Soil Reference
Climate Change Initiative Joint Research Centre (JRC) and Information Centre’s
Land Cover [Default dataset] LPD datasets at 1km (ISRIC) SoilGrids250m8
resolution [Default dataset]/ (adapted for the UNCCD)
JRC’s dataset 250m
resolution for Small Island
Developing States (SIDA)
[Default dataset for SIDA]
Globeland30 Enhanced Vegetation Index International Soil Reference
(EVI) and Information Centre
(ISRIC) Soil Grids)
JRC TREES-3 – only forest Soil-Adjusted Total Land Degradation
land cover within tropical Vegetation index Surveillance Framework
(humid) areas
JRC Phenology based land The Normalised Cumulative JRC’s Threats to Soil
cover classification – under Rain-Use Efficiency Index
development
Terra-I (for monitoring MODIS MOD17A3 Global Harmonised World Soils
deforestation) NPP Model Database
The Land Potential Fractional Cover Models Global Soil Map
Knowledge System
Land Degradation Collect Earth Global Soil Organic Carbon
Surveillance Framework Map
Global Land Cover Share Flux Tower data
From Global Land Cover
Sources (Aynekulu et al. 2017; Mattina et al. 2018; Sims et al. 2017)
16 | P a g eThe FAO land cover classes were seen as inadequate for understanding land degradation in
South Africa because they fail to differentiate between forest and Savannah. Consequently,
South Africa used default data for reporting to the UNCCD but used national land cover on
ecological biomes which was seen as more relevant and well understood in the country.
Monitoring and reporting requirements for LDN, as well as NDCs, is creating demand for
national datasets on SOC, with national datasets being developed in China and Ghana.
One interviewee highlighted that little guidance existed for how to bring local or traditional
knowledge into target setting.
Complementary indicators
Complementary indicators were not used in the seven LDN target setting reports analysed
(see Table 4). However, interviewees reported that some complementary indicators had been
established at the national level, including ones on sand storms, bush encroachment, drought
and managing drought, soil salinity, soil erosion, soil compaction. An indicator on bush
encroachment has been established in Namibia to avoid false positive results on degradation
assessments based on the NDVI land productivity indicator.
Interviewees from civil society highlighted that targets and indicators related to social,
economic or cultural outcomes of LDN are lacking, which would help orient LDN activities to
achieve its third objective of reinforcing responsible and inclusive governance of land (Orr et
al. 2017). Crossland et al. (2018) suggest developing complementary metrics for measuring
productivity at local scales through discussion with land users, who might identify socio-
economic factors, such as labour availability and current household needs that contribute to
their productivity. This fits with Gnacadja and Wiese’s (2016, 87) suggestion that LDN
indicators should encompass ‘increases in livelihood stemming from restoration’.
However, progress has been made in developing other SDG indicators related to land
governance that could be integrated into LDN targets and monitoring. SDG Indicator 1.4.2 on
tenure rights is relevant, as is indicator 5.a.1 on women’s ownership and access to agricultural
land, and indicator 5.a.2 which measures the extent to which women’s land rights are secured
in national legal frameworks (Sylla and Nairesiae 2018).
The LDN-SCF suggests incorporating IUCN’s Red List Index as an indicator to ensure
threatened species and ecosystems are not overlooked. However, this study saw no sign of
this currently being used in LDN target setting and planning (this may be due to the limits of
this study). However, an interviewee from Italy highlighted they were striving to find an
appropriate biodiversity indicator.
Strengths, Weaknesses, Opportunities and Threats (SWOT) analysis and identification
of drivers
In keeping with UNCCD (UNCCD 2016a) guidance, LDN national working groups conducted a
SWOT analysis, in the seven LDN target setting reports analysed (see Table 4). This was used
to help assess land degradation trends, identify drivers, and identify appropriate measures to
achieve LDN. One interviewee highlighted that the SWOT analysis was important for
identifying the weaknesses in their country’s institutional and legal environment that would
have to be addressed to achieve LDN.
Each target setting report also analysed direct and indirect drivers of land degradation in their
country. Identifying and addressing such drivers is likely to be essential to achieving LDN, for
17 | P a g eYou can also read