2014 JRC wind status report - Technology, market and economic aspects of wind energy in Europe - JRC Publications Repository
←
→
Page content transcription
If your browser does not render page correctly, please read the page content below

2014 JRC wind status report

                      Technology, market and
                      economic aspects of wind
                      energy in Europe
                      Roberto LACAL ARÁNTEGUI

                      Javier SERRANO GONZÁLEZ

                      2015

                                                Report EUR 27254 EN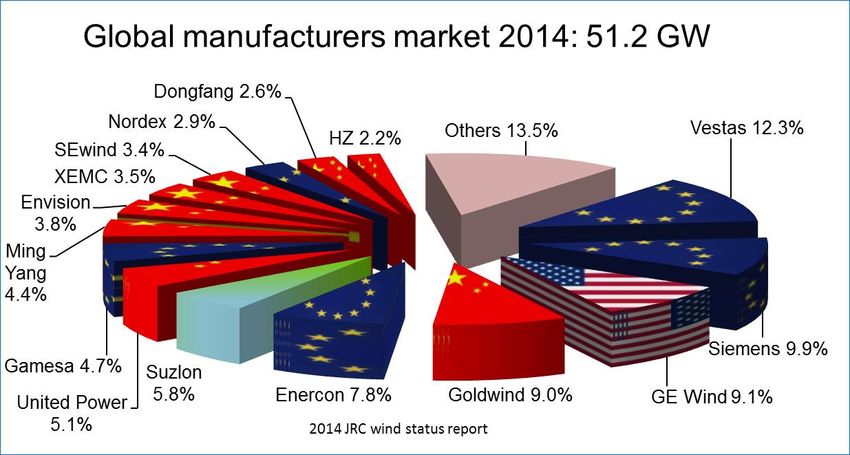
Cover picture: Looking up. © Jos Beurskens.

European Commission
Joint Research Centre
Institute for Energy and Transport

Contact information
Roberto LACAL ARÁNTEGUI
Address: Joint Research Centre, Institute for Energy and Transport, Westerduinweg 3, 1755 LE Petten, the Netherlands
E-mail: roberto.lacal-arantegui@ec.europa.eu
Tel. +31 224565-390
Fax +31 224565-616

JRC Science Hub
https://ec.europa.eu/jrc

Legal Notice
This publication is a Science and Policy Report by the Joint Research Centre, the European Commission’s in-house science
service. It aims to provide evidence-based scientific support to the European policymaking process. The scientific output
expressed does not imply a policy position of the European Commission. Neither the European Commission nor any person
acting on behalf of the Commission is responsible for the use which might be made of this publication.

All images © European Union 2015, except where indicated

JRC96184

EUR 27254 EN

ISBN 978-92-79-48380-6 (PDF)
ISBN 978-92-79-48381-3 (print)

ISSN 1831-9424 (online)
ISSN 1018-5593 (print)

doi:10.2790/676580 (online)

Luxembourg: Publications Office of the European Union, 2015

© European Union, 2015
Reproduction is authorised provided the source is acknowledged.

Abstract
This report presents key technology, market and economic aspects of wind energy in Europe and beyond. During 2014 the wind
energy sector saw a new record in actual installations in a context of healthy manufacturer balance sheet and downward trend
in prices. The global market reached 52.8 GW of installed capacity in 2014 of which 2.7 GW offshore, whereas in Europe 11.8
GW were installed. Global cumulative installed capacity reached 370 GW at the end of 2014 and in Europe 130 GW. The
installed capacity at the end of 2014 in the EU produces 265 TWh of electricity in an average year.
From a technology point of view in 2014 larger turbines were sold and in particular those with larger rotors relative to their
electricity generator, designed for sites with lower wind resources.
In 2014 both turbine and project prices onshore dropped. Energy costs (levelised cost of energy, LCoE) for projects with final
investment decision in 2016/7 are estimated between EUR 90 and 150 per MWh, with main influences being water depth and
whether offshore substation and connection to the onshore grid costs are included or not. Onshore, recent research suggest
European LCoE in 2012 between EUR 45 (Denmark) and EUR 97 (Germany, low wind area) per MWh, with a clear trend to lower
prices. Recent turbine prices are estimated to vary from EUR 770 to 880 per kW.

Joint Research Centre                                                    2014 JRC wind status report

           JRC scientific and policy
                   reports
                                          EUR 27254 EN

   2014 JRC wind status report

  Technology, market, economic and regulatory aspects of
                  wind energy in Europe

                        Roberto LACAL ARÁNTEGUI, Javier SERRANO GONZÁLEZ

            Energy Technology Policy Outlook Unit, Institute for Energy and Transport

                            Joint Research Centre, European Commission

                                                1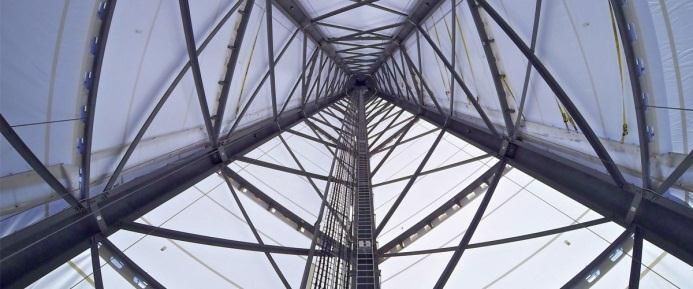
Joint Research Centre                                   2014 JRC wind status report

                        Page intentionally left blank

                                     2
Joint Research Centre                                                                                                             2014 JRC wind status report

Contents
Abbreviations and acronyms: .................................................................................................................................... 7
Executive summary ........................................................................................................................................................ 9
1. Introduction ........................................................................................................................................................... 11
2. Technology status.............................................................................................................................................. 13
  2.1.    Wind turbine design ............................................................................................................................... 13
  2.2.    Towers ........................................................................................................................................................... 16
  2.3.    Blades ............................................................................................................................................................ 17
  2.4.    Drive train .................................................................................................................................................... 20
    2.4.1.     Drive train configuration ........................................................................................................... 20
    2.4.2.     Electric generator .......................................................................................................................... 22
    2.4.3.     Gearbox .............................................................................................................................................. 23
    2.4.4.     Power converter ............................................................................................................................. 25
  2.5.    Offshore foundations ............................................................................................................................ 25
  2.6.    Offshore installation .............................................................................................................................. 27
3. Wind energy market status .......................................................................................................................... 29
  3.1.    Global market status ............................................................................................................................. 31
    3.1.1.     The European Union and beyond in Europe .................................................................... 31
    3.1.2.     China .................................................................................................................................................... 32
    3.1.3.     North America ................................................................................................................................. 32
    3.1.4.     Rest of the world ........................................................................................................................... 32
    3.1.5.     The offshore market ................................................................................................................... 33
  3.2.    Analysis and projections ...................................................................................................................... 34
    3.2.1.     Short-term perspectives ............................................................................................................ 34
    3.2.2.     Long-term deployment scenarios......................................................................................... 35
    3.2.3.     Progress towards the European Union 2020 goals .................................................... 37
    3.2.4.     EU Member State analysis ....................................................................................................... 38
  3.3.    Turbine manufacture market ............................................................................................................ 42
  3.4.    Globalisation of turbine manufacturers ...................................................................................... 45
  3.5.    The 2014 ‘harvest’.................................................................................................................................. 46
  3.6.    Repowering ................................................................................................................................................. 50
4. Economic impacts of wind energy ............................................................................................................ 51
  4.1.    Cost of capital — evolution of main factors ............................................................................. 51
  4.2.    Prices of raw materials ........................................................................................................................ 53
  4.3.    Evolution of turbine prices .................................................................................................................. 54
  4.4.    Capital expenditure (CapEx), onshore and offshore .............................................................. 55
  4.5.    Offshore wind turbine installation — cost reduction potential ........................................ 57
  4.6.    Operational expenditure (OpEx) ....................................................................................................... 58
  4.7.    Electricity generation and capacity factors ................................................................................ 60
    4.7.1.     Electricity generation .................................................................................................................. 60

                                                                                      3
Joint Research Centre                                                                                                                 2014 JRC wind status report

    4.7.2.        Capacity factors ............................................................................................................................. 61
  4.8.   Cost of energy ........................................................................................................................................... 62
    4.8.1.        Cost of energy onshore.............................................................................................................. 63
    4.8.2.        Cost of energy offshore ............................................................................................................ 64
5. The regulatory framework............................................................................................................................. 67
  5.1.   Introduction................................................................................................................................................. 67
  5.2.   Support schemes ..................................................................................................................................... 67
  5.3.   Support schemes for onshore wind energy ............................................................................... 68
  5.4.   Suspension of support schemes and retrospective measures......................................... 70
  5.5.   Specific support schemes for offshore wind energy in EU MSs...................................... 70
  5.6.   Grid issues ................................................................................................................................................... 71
  5.7.   Operation and use of the grid by wind energy generators ................................................ 73
  5.8.   Potential barriers for wind energy deployment ....................................................................... 73
  5.9.   Evolution of support schemes, installed capacity and current state in order to
  meet the 2020 targets. ........................................................................................................................................ 75
  5.10. Conclusions ................................................................................................................................................. 81
Annex: Onshore wind installations in the EU .................................................................................................. 82
References........................................................................................................................................................................ 83

                                                                                         4
Joint Research Centre                                               2014 JRC wind status report

Acknowledgements
The authors would like to thank the internal and external experts who reviewed the draft
report and contributed with their ideas to its improvement. These are: Dr Ryan Wiser
(Lawrence Berkeley National Laboratory, US), Sebastian Hald Buhl (DONG Energy,
Denmark), Dr Jos Beurskens (SET Analysis, the Netherlands), Dr Ignacio Cruz Cruz (CIEMAT,
Spain), Daniel Román Barriopedro (Technology Department, Gamesa, Spain), Erik Kjaer
(Danish Energy Agency, Denmark) and Dr Hannele Holttinen (VTT, Finland). Internal,
European Commission, reviewers were Mr Roberto Gambi (DG Energy), Dr Ir. Matthijs Soede,
(DG Research and Innovation), Dr Fabio Monforti-Ferrario and Dr Alberto Moro (DG JRC).

Citation:

Suggested citation: Lacal-Arántegui, R. and Serrano-González, J., 2015: 2014 JRC wind status
report. Joint Research Centre of the European Commission. ISBN 978-92-79-48380-6

                                             5
Joint Research Centre                                   2014 JRC wind status report

                        Page intentionally left blank

                                     6
Joint Research Centre                                               2014 JRC wind status report

ABBREVIATIONS AND ACRONYMS:
Throughout this report 2-letter country codes are used as per the International Organisation
for Standardisation: http://www.iso.org/iso/country_names_and_code_elements. Other
abbreviations and acronyms are:

bn              Billion (1 000 million)
BoP             Balance of plant
CapEx           Capital expenditure, or capital cost
CF              Capacity factor
CfD             Contract for difference
CIEMAT          Centro de Investigaciones Energéticas, Medioambientales y Tecnológicas
                (Spain)
CoE             Cost of energy
DD              Direct-drive
DG              Directorate General (of the European Commission)
DFI             Development Financial Institutions
DFIG            Doubly-fed induction generator
DSCR            Debt service coverage ratio
EBIT            Earnings before interest and tax
EBRD            European Bank for Reconstruction and Development
ECA             Export credit agencies
EEA             European Economic Area, includes the EU plus Iceland, Liechtenstein and
                Norway
EIB             European Investment Bank
EMG             Electromagnet generator
EPO             European Patent Office
ERDF            European Regional Development Fund
EU              European Union
FID             Final investment decision
FiP             Feed-in premium (scheme)
FiT             Feed-in tariff (scheme)
FP              Framework Programme (of the EU) for Research and Technological
                Innovation
GO              Grid Operator
GW              Gigawatt (= 1 000 000 000 watts)
HTS             High-temperature superconductor
IEA             International Energy Agency
IEAWind         International Energy Agency Implementing Agreement for Cooperation in the
                Research, Development, and Deployment of Wind Energy Systems
IEE             Intelligent Energy Europe programme of the European Commission
IGBT            Insulated-gate bipolar transistor
IRR             Internal rate of return
JRC             Joint Research Centre, a directorate-general of the European Commission
JTI             Joint Technology Initiative
KfW             Kreditanstalt für Wiederaufbau, a German development bank
kW              Kilowatt (= 1 000 watts)
LCCC            Low-Carbon Contracts Company
LCoE            Levelised cost of energy

                                             7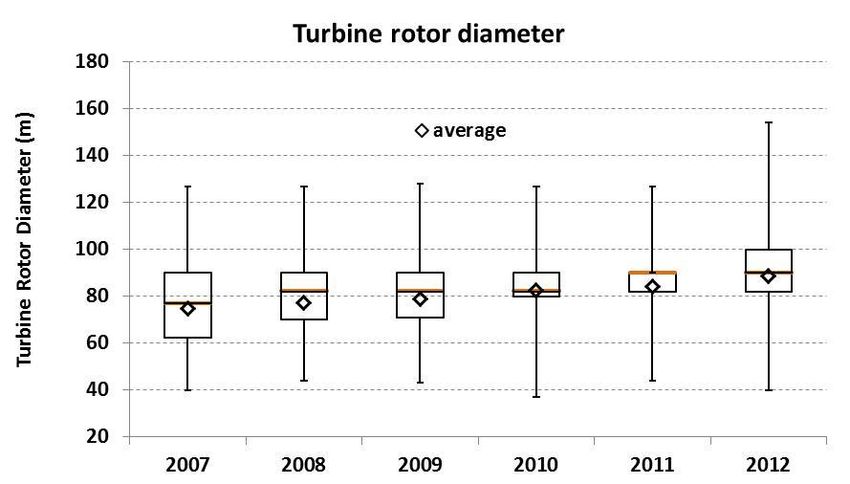
Joint Research Centre                                                2014 JRC wind status report

m               Million, metres
MS              Member State (of the EU)
MW              Megawatt (= 1 000 000 watts)
MWh             Megawatt-hour
NPV             Net present value
NREAP           National Renewable Energy Action Plan
O&M             Operations and maintenance
OEM             Original equipment manufacturer, in the context of this report OEM is the
                wind turbine manufacturer.
OpEx            Operational expenditure or O&M cost
PCSD            Price contract by signature date
PD              Plant Developer
PM              Permanent magnet
PMG             Permanent magnet generator
PTC             Production Tax Credit
R&D             Research and development
RD&D            Research, development and demonstration
RES             Renewable energy system/source
RoI             Return on investment
RoW             Rest of the world
RPM             Revolutions per minute
SCIG            Squirrel-cage induction (or asynchronous) generator
SET-Plan        (European) Strategic Energy Technology Plan
TGC             Tradable green certificates
TPA             Turbine purchase agreement
TWh             Terawatt-hour
VTT             Technical Research Centre of Finland
WACC            Weighted-average cost of capital
WIPO            World Intellectual Patent Organisation
WRIG            Wound-rotor induction (or asynchronous) generator
y-o-y           Year-on-year
yr              Year

In addition to the euro the following currencies were used:
BRL             Brazilian Real
BGN             Bulgarian Lev
DKK             Danish Krone
GBP             British Pound Sterling
PLN             Polish Zloty
RON             Romanian Leu
SEK             Swedish Krona
USD             United States Dollar

                                              8
Joint Research Centre 2014 JRC wind status report
EXECUTIVE SUMMARY
The year 2014 was overall a good year for the wind energy sector. The level of installations
represented a new record and turbine manufacturers — some of whom were in a poor
economic condition over the previous 2 years — saw healthy economic indicators.
Turbines commissioned in 2014/15 are larger and taller than ever. European onshore
turbines in this group average 2.71 MW of rated power (+ 20 % on 2012 installations),
106.4 metres rotor diameter (+ 20 % as well), and 113.2 metres hub height (+ 17 %). The
evolution in blade design is enabling an increasing trend to low-wind turbines, with larger
rotors and moderated rated power. Drive train configurations are evolving towards the
employment of full converters whereas doubly-fed induction generators are losing ground
in the market. In Europe, permanent magnets are mostly employed in geared wind turbines
(mainly because less rare earths are required), whereas direct drive with permanent
magnets-based generators are increasingly common in Asia.
The global market in 2014 reached 52.8 GW of newly installed capacity, of which 1.45 GW
offshore were connected to the grid and 1.2 GW were not (1). In the European Union 13 GW
of new turbines were installed, of which 11.8 GW were connected to the grid. Global
cumulative installed capacity thus reached 370 GW whereas the EU connected cumulative
capacity reached 129 GW and will produce 265 TWh of electricity in an average year, which
is equivalent to the full demand of Belgium, the Netherlands, Greece and Ireland.
The 2014 manufacturers market saw the return of the traditional leader Vestas to the top
position in terms of installed capacity, followed this time by another European company,
Siemens. As in 2010–12, four Chinese firms were included among the top 10 in 2014, but
it was only in 2013 and 2014 that eight Chinese firms were in the top 15.
In 2014 both turbine and project prices onshore continued to drop, and 2015 showed the
first results of the way to a 40 % reduction in offshore costs for wind farms with final
investment decision (FID) in 2020. Energy costs (levelised cost of energy, LCoE) for projects
with FID in 2016/7 are estimated between EUR 90 and 150 per MWh, with main
influences being water depth and whether offshore substation and export cable costs are
included or not. Onshore, recent research suggest European LCoE in 2012 between EUR
45 (Denmark) and EUR 97 (Germany, low wind area) per MWh, with a clear trend to
lower prices. Recent turbine prices are estimated to vary from EUR 770 to 880 per kW.
With the increasing need to integrate large amounts of variable renewable electricity into
the electricity system and market, 2014 saw regulatory support for wind swinging towards
market-linked and/or market-like structures (e.g. tenders/auctions) to replace feed-in tariffs.
This report discusses the technology, economics and market aspects of wind energy in
Europe and beyond — because the wind energy sector is a global sector. Its intended
audience includes policymaking and support officers in the European institutions and
Member States and the wind energy sector from developers through manufacturers to
academia.
(1) In most cases the connection exporting electricity to the onshore substation was not yet commissioned.
9Joint Research Centre 2014 JRC wind status report
Page intentionally left blank
10Joint Research Centre 2014 JRC wind status report
1. INTRODUCTION
This report presents the
technology, market and
economics of the wind energy
sector with a focus on the
European Union.
Wind power has seen an
impressing deployment over
the last two decades, from
3.5 GW in 1994 to around
370 GW of cumulative global
capacity at the end of 2014 of
Figure 1: Wind farm at sunset. Courtesy of Vestas. which 130 GW are installed
(although not all connected to
the grid) in the EU. This was a year when Denmark generated enough wind electricity to
cover 40 % of its internal demand, in Ireland, Portugal and Spain the share of wind reached
between 19 % and 25 % of final consumption, and 15 other EU Member States generated
4 % or more electricity from wind. Wind energy will provide at least 12 % of European
electricity by 2020, which is a very significant contribution to the 20-20-20 targets of the
European energy and climate policy.
This report focuses on the wind energy sector in Europe but, because this sector is a global
industry, some sections have a global scope. The report is based on industry annual reports
and other declarations; on the JRC research work in wind technology; on JRC databases of
wind turbines and installations, models and other internal research; on research by key
players from industry and academia; and on direct industry consultation.
The report comprises regular sections and ad hoc research chapters focusing on specific
technology issues. Section 2 investigates the technological situation: state of the art of
wind turbines and of their main components, research and innovations, and its possible
future evolution, with a focus on technological changes brought about during 2014, or
those hinted at by industry and research institutions as the possible future. Section 3
analyses the market situation, what happened in 2014 plus the longer-term trends that
emerge; proposes some deployment scenarios and analyses industrial strategies as made
public by manufacturers and developers. Section 4 focuses on the economics of wind
projects: financing, project and turbine capital expenditure (CapEx), operational expenditure
(OpEx), energy produced and cost of energy (CoE). The ad hoc research in Section 5 this
year focuses on the regulatory situation in the EU Member States (MS).
11Joint Research Centre 2014 JRC wind status report
Page intentionally left blank
12Joint Research Centre 2014 JRC wind status report
2. TECHNOLOGY STATUS
A wind turbine starts to capture energy at the cut-in speeds of 3–5 m/s (11–18 km/h) and
the energy produced increases initially in relation to the cubed wind speed until levelling off
at the turbine rated power of around 12 m/s (43 km/h), then remaining constant until
strong winds force the turbine rotor to slow down, e.g. at around 25–28 m/s (90–100 km/h)
in order to avoid putting at risk its mechanical stability. At higher wind speeds the wind
turbines are switched to idle mode to withstand wind speeds of up to 70 m/s (252 km/h).
The exact values depend on the wind regime the wind turbine is designed for.
2.1. Wind turbine design
Out of a wide variety of wind turbines, in the 1980s the Danish three-bladed, single fixed
speed, stall-regulated turbine became the dominant model in the market at rated power
levels of less than 200 kW. Since then, turbine dimensions, both in terms of generator
capacity and of rotor diameter, have grown steadily and currently 2–3 MW/97–117 m rotor
diameter wind turbines are commonly installed in onshore projects and 3–8 MW/112–164
in offshore wind farms.
The main technological characteristics of current turbines are:
• Steel, concrete or hybrid towers reaching 150 m in height.
• An upwind rotor with three blades, active yaw system, preserving alignment with the
wind direction. Rotor efficiency, acoustic noise, costs and visual impact are important
design factors. Some turbine designs have only two blades.
• High-wind-speed control. Pitch regulation, an active control where the blades are
pitched along their axis (flapwise) to regulate the extracted power and reduce loads.
• Variable rotor speed. This was introduced to allow the rotor and wind speed to be
matched more efficiently in particular at lower wind speeds, reduce mechanical loads and
to facilitate an output according more with the needs of the electricity grid.
• A drive train system. Three main drive train configurations are currently adopted: (i)
fast-rotating electric generator with a gearbox to adapt the slow-rotating rotor to the
higher rotational speed of the electric generator, (ii) low-speed generator directly coupled
to the turbine rotor (i.e. without a gearbox) and (iii) a medium-speed generator with a
gearbox.
The main wind turbine design driving goal is to reduce the levelised costs of energy through
lower capital and operating costs, increased reliability and higher energy production, which
translate into: specific designs for low and high wind sites, grid compatibility; low noise,
good aerodynamic performance and redundancy of systems in offshore machines.
Generally, utility-scale
wind farms require Wind class turbine I II III IV
minimum average wind Annual average wind speed (m/s) 10.0 8.5 7.5 6
speed of 5.5 m/s for Extreme 50 year-gust (m/s) 70 59.5 52.5 42
profitable operation. A: 18 18 18 18
Turbulence classes (%)
Table 1 shows the B: 16 16 16 16
classification of wind Table 1: Main features of wind classes according to IEC 61400. Class S is
turbine classes at manufacturer's disposal
depending on wind
13Joint Research Centre 2014 JRC wind status report
conditions. As a general rule, wind turbines aimed for low wind locations are equipped with
larger and more slender rotors that have higher aerodynamic efficiency, as well as taller
towers and moderate rated power (as a compromise between equipment costs and energy
output). Overall, wind turbines aimed at low wind-speed sites imply higher specific (per
rated power) capital costs than turbine designs aimed at high wind sites. Nevertheless, the
higher costs of larger rotors and taller towers is partly compensated by smaller electric
generators, power converters and gearboxes (if applicable) enabling low wind turbines to be
competitive in locations with less favourable wind resources.
European Union
100
80
Capacity (%)
60
IEC I
40
IEC I/II
20
IEC II
0
2005 2006 2007 2008 Year 2009 2010 2011 2012
IEC II/III
Asia 2014 JRC wind status report
100 IEC III
80 IEC IV
Capacity (%)
60 IEC S
40
20
0
2005 2006 2007 2008
Year 2009 2010 2011 2012
Figure 2: Evolution of the share of onshore installed capacity by wind classes (Source: JRC Database).
See Table 1 for a definition of wind classes according to IEC 61400.
In order to cope with different site conditions, manufacturers are adopting a modular
approach to enhance product flexibility, at the same time as component production is
standardised. With this aim, two main strategies are being implemented (de Vries, 2013): (i)
using the same platform (using the same/similar power rating, i.e. using the same electric
generator, converter and/or gearbox) that can be combined with different rotor diameters
and hub heights (this strategy is implemented by manufacturers Alstom, Gamesa or
Siemens) and (ii) the same rotor diameter can be used in several platforms (e.g. Nordex
implements this strategy), or both.
Figure 2 shows the evolution of onshore installed capacity share according to the different
wind classes. As can be observed, Class I wind turbines are progressively losing ground in
the European Union in favour of Class II and Class III wind turbines. Nevertheless, even
though this is a general trend in EU MSs, this is an evolution highly dependent on the
specific conditions of each MS. In particular, Germany is increasingly becoming a low-wind
market (80 % of installed capacity in 2012 was Class II and III turbines (Lüers, et al.,
2015b) as a consequence of the reduced availability of high wind locations along with the
implementation of a support scheme tailored to the local wind resource quality. Conversely,
the UK onshore market is intrinsically a high wind market (76 % of installed capacity in
2012 was Class I).
14Joint Research Centre 2014 JRC wind status report
Manufacturer Model Size: MW/m Market IEC Class Status SP W/m2
Enercon E126-7.5 7.58/127 Onshore Ia Commercially available (2010) 598
Senvion 6.2M126 6.15/126 On/Offshore Ib Commercially available (2009) 493
XEMC-Darwind XE/D115 5.0/115 Offshore Ic Commercially available (2013) 481
Areva M5000/116 5.0/116 Offshore Ia Commercially available (2009) 473
Sinovel SL6000 6.0/128 Offshore I Commercially available (2011) 466
Ming Yang 6.5MW SCD 6.5/140 Offshore Prototype installed (2015) 422
Guodian UP UP6000 6.0/136 Onshore IIa Prototype installed (2012) 413
Gamesa G128/5.0 5.0/128 Offshore IIa Prototype installed (2013) 389
Vestas V164-8.0 8.0/164 Offshore S Prototype installed (2014) 379
Siemens SWT-7.0-154 7.0/154 Offshore Ib Prototype installed (2015) 376
Areva M5000/135 5.0/135 Offshore I Prototype installed (2013) 349
Alstom Haliade 150 6.0/150 Offshore Ib Certification received (2015) 340
Senvion 6.2M152 6.15/152 Offshore S Prototype installed (2014) 339
Siemens SWT-6.0-154 6.0/154 Offshore Ia Commercially available (2014) 322
Mitsubishi SeaAngel 7.0/167 Offshore S Prototype installed (2015) 320
Samsung S7.0 7.0/171 Offshore Ia Prototype installed (2014) 305
Vestas V126-3.3 MW 3.3/126 Onshore IIIa Commercially available (2013) 264
Acciona AW125/3000 3.0/125 Onshore III Commercially available (2013) 244
General Electric GE 2.75-120 2.75/120 Onshore IIIb Commercially available (2014) 243
Senvion 3.0M122 2.0/122 Onshore IIIa Commercially available (2013) 235
Nordex N131/3000 3.0/131 Onshore IIIa Commercially available (2014) 223
Vestas V110-2.0 MW 2.0/110 Onshore IIIa Commercially available (2013) 210
Gamesa G114-2.0 MW 2.0/114 Onshore IIa / IIIa Commercially available (2014) 196
Leitwind LTW77/800 0.85/77 Onshore IIIa Commercially available 173
Table 2: Sample of largest wind turbines in the market or being introduced, sorted according to specific power
(SP). Size includes the electric generator rating (MW) and the rotor diameter (metres). The small Leitwind
LTW77/800 was included because it is the utility-level turbine with the lowest specific power. Sources: Turbine
technical specifications.
Class III wind turbines predominate in the Asian market mainly because of the prevailing
low-wind resource in large parts of China and India. On the other hand, the North American
market was mainly dominated by Class II turbines to 2012, but in 2013 and 2014 there
has been a further swing to Class III turbines (Wiser, 2015).
Table 2 includes a selection of commercial or recently presented/announced large turbines
sorted according to their specific power (2). The upper part of the table refers to the larger
wind turbines for high wind locations, whereas larger wind turbines with the lower specific
power (W/m2) are presented below. As can be observed, large wind turbines with high
specific power are generally aimed at the offshore market which is usually gifted with high
wind resource. Figure 3 shows the annual evolution of specific power for new wind turbines
installed in the world from 2000 to 2012. A trend can be identified in this figure: the
average specific power of new installed turbines progressively decreased.
(2) A wind turbine’s specific power is the ratio of its rated power to its rotor-swept area. All else being equal, a decline in
specific power should lead to an increase in capacity factor (Wiser and Bolinger, 2014).
15Joint Research Centre 2014 JRC wind status report
Figure 3: Boxplot representation of specific power (W/m2) for onshore wind turbines annually installed in
the world. Bottom and top sides of each rectangle refers to the 25th and 75th percentiles. The horizontal
line inside each rectangle represents the median and the lower and upper horizontal lines outside the
rectangles are the minimum and maximum values. Source: JRC wind farm database.
2.2. Towers
Figure 4 represents the hub heights of new wind turbines annually installed in Europe
during 2007–12. The trend to taller towers is clear, and it is mainly motivated by the larger
rotor diameters deployed in recent years (as shown later in Figure 6 and the emerging
demand for low wind turbines, since the increase of wind speed with height is generally
more pronounced in low wind locations (e.g. forested areas).
Tubular steel towers have been the most widespread solution, but the growing demand for
taller towers is encouraging the development of alternative tower designs. As the diameter
of the towers increase with height, wind turbines taller than 100 m usually require a base
diameter above 4 m, which may pose a transport problem.
The increase in hub heights is ensuring that concrete towers increasingly emerge as an
alternative to tubular steel
towers supported by lower
cost in particular for greater
heights and markets with
high local content. Another
solution, based on hybrid
steel–concrete towers, is
offered by manufacturers
such as Gamesa, Enercon,
Nordex or Senvion. The base
of the tower is made in
concrete (either cast on site
or composed by precast
elements) and the upper
part of the tower is
compounded using tubular
steel sections. Figure 4: Boxplot representation of hub heights of onshore wind
turbines installed each year in EU MS. Source: JRC wind farm database.
16Joint Research Centre 2014 JRC wind status report
Bolted steel shell
Steel tower Concrete tower Hybrid tower Space frame tower
tower
Figure 5: Different kinds of towers. Courtesy: Siemens, Acciona, GRI Renewable Industries and General Electric.
Some innovative solutions for taller towers include (de Vries, 2014a) (i) the bolted steel
shell tower (used by Siemens and Lagerwey), consisting of multiple sections made out of
steel shells which are assembled on site, (ii) the space frame tower proposed by General
Electric, based on a steel lattice design covered with polyester cover, and (iii) the large
diameter steel tower, where the bottom section is larger but of thinner walls, that is
delivered in three lengthways segments which are transported on a flatbed truck.
Innovative vertical flanges allow the reassembly of parts on site, thus easing the limitations
of standard road transport (Vestas, 2014).
2.3. Blades
Blade technology has developed to be at the leading edge of wind energy technology
development. Blades are made (using moulds) of fibre-reinforced polymers (resins) in the
form of laminates and/or sandwich substructure. Traditionally blades were made of glass
fibre and polyester resin. Current materials include, as well, epoxy resins reinforced mainly
with glass fibre, and to some
extent with the lighter but more
expensive carbon fibres in
selected areas or points
Turbine rotor diameter (m)
sustaining high loads (e.g. spar
caps).
In the evolution to longer blades
(see Figure 7) carbon fibre was
expected to be a key component
in order to keep the blade light 2014 JRC wind status report
at the same time as stiff and
slender. However, higher costs
of carbon fibre and difficulties Figure 6: Boxplot representation of rotor diameters of onshore
in the manufacturing process wind turbines installed each year in EU MS. (Source: JRC wind farm
are preventing its generalised database).
use (BNEF, 2014). New
17Joint Research Centre 2014 JRC wind status report
New materials and processes that allow the design materials generally have higher
and manufacture of more slender blades include: efficiency (in terms of Cp/CT
ratio), but they also present
new fabrics with higher modulus and better some structural challenges that
performance; are continuously being
new matrix (resins) that enhance the overcome (see box).
performance against inter-laminate loads and
efforts, and with better properties in the fabric- There are several ongoing
matrix junction; research projects on new
materials for blades. LM Wind
new technologies or processes for the inclusion of
Power announced ongoing
carbon fibre in the ‘hybrid’ glass–carbon blades,
research on new carbon hybrid
that could solve issues related to the different
materials. The European-funded
modulus and the different coefficient of thermal
projects, WALiD and MARE-
expansion (this is key for curing processes);
WINT, aim at researching new
new processes for the positioning or design of the
material for offshore wind
layup, and laminates to make the most of the
turbines. The CARBOPREC
materials, through their optimum use.
project started in January 2014
Source: Daniel Román-Barriopedro, Gamesa with the objective of producing
Technology Department, personal communication. cost-effective carbon fibres
from raw materials widely
available in Europe, such as lignin and cellulose.
A non-blade technological development that has also enabled the design of more slender
blades is the new load control algorithms.
The increasing size of rotors has resulted in new challenges with regard to manufacturing
(requiring larger moulds and costlier processes) and ground transportation. To overcome
these challenges, manufacturers such as Gamesa (G128/5.0 MW) and Enercon (E126/7.58
MW) commercialise segmented blades that can be transported in two pieces and
assembled on site. General Electric (GE) proposes blade extension by cutting the blades in
half and adding a new section (General Electric, 2014). Thus, the area swept by the rotor is
increased and, therefore, the more energy would be generated especially in moderate wind
conditions. LM Wind Power is leading a Dutch-supported project to develop a new flexible
blade length concept, based on
a standard basic blade part
plus variable tip sections (LM
Wind Power, 2014). This
approach would lead to tailored
solutions according to the local
wind conditions of each
individual wind turbine; at the
same time the manufacturing
process can lead to a modular
product. A different approach is
pursued by the Blademaker
project (founded by the
German Federal Ministry for
Figure 7: Blade weight relationship with length. (Source: BNEF and
the Environment) aiming at JRC wind turbines database).
developing new concepts to
automate the blades manufacturing process.
18Joint Research Centre 2014 JRC wind status report
Other innovations are aimed at improving aerodynamic efficiency. Generally, the root of the
blade is designed attending to structural requirements rather than maximising the
aerodynamic performance. In order to improve lift in this part of the blade, some
manufacturers are including vortex generators to reduce the flow separation. As an
example, Senvion equips the 3.2 M114 and 3.4 M114 wind turbines with vortex generators.
Siemens offers vortex generators in the form of add-ons as a part of the Power Curve
Upgrade services (Siemens Wind Power, 2012).
A lot of effort is also being put into anti-icing
Cumulative capacity by end of 2012 (MW)
systems. This is very relevant as about a
Low Light icing Moderate to
quarter of the world wind installed capacity of
temperature heavy icing
wind power is located in areas which are prone 18 945 41 079 11 478
to icing conditions. Icing reduces efficiency and
Total 69 000
can severely impact energy yields; shortens life
expectancy of the turbines and increases safety Table 3: Total installed capacity in cold
risks due to potential ice throw. Table 3 shows climates. Source: IEAWind (2014).
installed and forecast capacity in cold climates
(IEAWind, 2014) (3).
Icing protection has two orientations: preventing and removing ice formation, anti- and de-
icing respectively:
Passive anti-icing systems based on hydrophobic coatings to prevent the formation of
ice. The European project HYDROBOND is researching on the development of new
hydrophobic coatings based on spraying nanoparticles. In another example, Gamesa’s
Bladeshield™ coating (Gamesa, 2014) is a result of the Spanish-supported AZIMUT
research project.
Active systems based on thermal solutions, such as distributing hot air throughout the
blades (introduced by Enercon in 2011 and also used by Vestas, Gamesa and Senvion) or
including heating mats selectively embedded in areas of the blade (e.g. Nordex and
Siemens). However, heating from the inside, while the heat is needed at the outside, has
shortcomings with respect to material properties and energy consumption. That is why
also other technologies are being explored.
A dual system developed by VTT of Finland incorporates ‘a thermo-resistive carbon fibre
mesh in the critical areas of the blade’s leading edge during the manufacturing process’.
The IPS is activated when ice could start building up on the blade, thus it acts as anti-
icing system, but it can also be operated as a de-icing system using the ‘thermo-
resistive elements integrated into the structure’ (Gamesa, 2014).
The reduction of noise is another objective that can influence (and is aided by) the
technology and design of blades. The most common solution consists of including
serrations at the trailing edge of the blade (Enercon, Gamesa and Siemens). Also, there are
other solutions (not based on the design of the blade) to reduce noise emission.
Manufacturers including Gamesa, Nordex, Senvion or Siemens offer a solution to mitigate
sound emission consisting of control strategies to de-rating the wind turbine under certain
noise requirements.
Advances have also been made in remote sensing systems to measure the blade deflection
under operating conditions. A better knowledge of blade deformation enables the
(3) Cold climate refers to sites that have either conditions favourable for icing to occur or temperatures that are lower
than the operational limits of standard wind turbines.
19Joint Research Centre 2014 JRC wind status report
development of improved control strategies to maximise the energy output and reduce
mechanical stress. LM Wind Power is researching on a monitoring system based on radio-
based sensors. Part of the European-funded project MARE-WINT aims at simulating the
airflow in the near-blade area in order to develop algorithms for the effective aeroelastic
analysis of large offshore wind turbines.
Finally, aeroelastic tailored blade (ATB) technology, based on computer-intensive
multidisciplinary design optimisation (Martins, 2013), offers the perspective of better
blades more adapted to different wind conditions. Siemens offers this option since the B53
blade, but other manufacturers are exploring the technology (Siemens Wind Power, 2015a).
2.4. Drive train
For the purpose of this assessment the main components of the drive train are the gearbox,
the electric generator and the power converter.
2.4.1. Drive train configuration
The drive train converts the mechanical power captured by the rotor into electric power. The
steps involved in this conversion, and hence the drive train components, depend on the
configuration:
Geared wind turbine with doubly-fed induction generator (DFIG). Under this
arrangement, the gearbox converts the slow rotating speed of the blades (usually
around 4.5–20 rpm) into the high rotational speed required by standard induction
generators (600–1 800 rpm). A partial power converter allows the control of the electric
generator speed so that it can be adapted to the rotational speed of the mechanical
system.
Gearless or direct-drive configuration. A synchronous generator, either electrically
excited or using permanent magnets (PMG) is directly coupled to the main shaft without
gearbox (i.e. spinning at the same speed as the turbine rotor). The electric generator is
connected to the grid through a full power converter that adapts the variable
frequency/voltage of the electricity generated to the grid frequency.
Hybrid configuration. Slow rotating electric generators require a large number of poles
which are translated into larger generator diameters (and hence heavier machines). This
issue is even more pronounced in large wind turbines where the rotational speed of the
blades is slower. Alternatively, in the case of geared wind turbines, higher speed
conversion ratios imply more demanding operating conditions for the gearbox
components and bearings. A compromise solution can be achieved by this hybrid
configuration equipped with a gearbox — which converts the slow rotational speed of
the blades to medium speed, around 60–600 rpm — and a generator coupled with a full
converter.
Geared wind generators have the advantage of lower upfront costs, since they do not
require a full power converter and the generator is significantly smaller than a direct-drive
one. However, direct-drive generators overcome the reliability issues related to the gearbox;
even though power electronics have also a relatively high failure rate, the typical repair
time is much lower than in case of gearbox failures (Tavner, et al., 2008), and offer more
flexibility thanks to a full power converter, thus allowing easier compliance with the most
demanding grid ‘fault ride-through’ capabilities as well as frequency regulation required by
recent grid codes.
20Joint Research Centre 2014 JRC wind status report
The wind turbine classification defined by Hansen et al. (2004) is essentially based on drive
train configuration.
Type A. Fixed-speed generator. The rotational speed of the electric generator
(asynchronous generator) is the same as the spinning speed of the blades with very
limited range response to variations in wind speed. No power converter nor other speed
regulation techniques are employed in this configuration (NEG Micon N48 and Vestas
V27 are examples of wind turbines employing this configuration).
Type B. The speed of the asynchronous generator is controlled by a variable resistance
that enables modification of the circulating current in the rotor of the electrical
generator. This solution provides higher control flexibility than Type A. However, the
electrical losses are relatively high and the response to grid requirements is limited
(Vestas V52 and Suzlon S82 are the main representatives of Type B wind turbine in the
market).
Type C. This configuration is known as doubly-fed induction generator (DFIG). The
current in the electric generator’s rotor is controlled by a power converter. Thus,
electrical losses are lower and the response to grid requirements is enhanced. Since the
power converter is only connected to the rotor of the generator, the rated power of the
converter is around 30 % of the rated power of the wind turbine (Vestas V90, Gamesa
G80 and General Electric GE 1.5 are some representative models of this configuration).
Type D. A full power converter enables decoupling the generator from grid frequency, so
that frequency (and hence rotational speed) of the generator can be freely controlled
and the use of a gearbox can be avoided. Additionally, the full converter provides
enhanced grid services. Enercon is the dominant manufacturer in direct drive wind
turbines based on a synchronous generator, whereas the Goldwin GW 1.5 is the
predominant wind turbine in the market employing direct drive combined with
permanent magnet-based generator.
Hansen’s Type D configuration covers either direct drive or gearbox-equipped wind turbines
as well as synchronous (both permanent magnet or electrically excited) or asynchronous
generator (Hansen, et al., 2004). However, the market has changed and recent years have
seen the development of new turbine models with increasing variations on the Type D
configuration, which under the original definition would now be a kind of box for ‘all other’
configurations in the market other than Type C (as shown later in Figure 9). This market
evolution suggests that the different configurations currently classified as Type D may (or
perhaps we should say "should"?) be redefined in several categories for market-analysis
purposes. Therefore, hereafter when we refer to Type D we consider only full-converter,
direct-drive machines with either PMG or EEG, and define the following categories to cover
for gearbox-equipped full-converter drive trains:
Type E. Gearbox-equipped wind turbine with a full converter and medium-speed
synchronous generator (PM or EE). In practice (with the exception of the old model
Made AE-52), all Type E wind turbines use permanent magnets (Gamesa G128-4.5
MW pioneered and Vestas V112-3.0 are perhaps representative of this wind turbine
configuration).
Type F. Gearbox-equipped wind turbine with a full converter and high-speed
asynchronous generator. As the full converter enables the speed to be controlled by
modifying the operating frequency, a squirrel cage induction generator (SCIG) is
21Joint Research Centre 2014 JRC wind status report
generally employed under this configuration. Siemens employs this technology in
the SWT-2.3 and SWT-3.6 series.
2.4.2. Electric generator
According to the above-introduced classification, conventional geared wind turbines are
equipped with induction (asynchronous) generators that can be arranged in four different
forms (Types A, B, C and F). Likewise, synchronous generators are used in two
configurations (Type D and Type E).
As shown in Figure 8 Types A and B have become marginal, the market being dominated by
type C, and to a lesser extent by type D but with an increasing trend. Nevertheless, Types E
and F are gaining more market share (in particular Type E in European countries and Type F
in the North American market). This trend is expected to continue in the following years as
the grid codes are becoming more demanding.
Figure 8: Evolution of the share of installed capacity by wind turbine configuration (Source: JRC
Database). PM: permanent magnet, EE: electromagnetic excitation.
The share of PMG installed has increased in the recent years and, especially in the case of
the Asian market, where most installed Type D generators are based on permanent
magnets. PMG are more efficient than the traditional doubly-fed induction generators
(DFIG) when operating at partial loads, which happens more often with lower winds (and
turbines are increasingly being deployed in low-wind areas). Additionally, PMG have fewer
moving parts than DFIG and moving parts require more maintenance, thus the evolution
from DFIG to PMG is expected to continue, which would reduce O&M costs.
22Joint Research Centre 2014 JRC wind status report
The main problem faced by a PM generator is the high variability in the price of its basic
elements, namely the rare earths needed to manufacture permanent magnets, mostly
neodymium (Nd) and dysprosium (Dy) (Lacal-Arántegui, 2015). The price of the latter
increased in 2011 to reach more than 20 times above its previous 5-year average (a more
detailed analysis can be found in the 2013 issue of this report and in Section 2.2 of Lacal-
Arántegui (2015)). The effect of this spike in prices is reflected by the reduction in the
share of installed wind turbines employing permanent magnets during the following years,
mostly in the European and North American markets. A further problem with rare earths is
the double risk associated with the high geographical concentration of the supply of rare
earth elements, with about 90 % of them extracted in China.
There is a clear and seemingly successful trend towards permanent magnets with lower
rare earth content, in particular of the scarcer heavy group (e.g. Dy). Neorem Magnets
introduced several manufacturing innovations, based on transversal pressing, which
resulted in improved alignment of magnetic particles and increased yield and effectiveness
of magnets (Naukkarinen, 2014). Another way of reducing the dysprosium content consists
of keeping the magnets at lower operating temperature, which can be achieved by better
electric generator design. Siemens is working on permanent magnets with reduced
dysprosium (Semmer & Urda, 2012). Although this solution would not be free of rare earth
metal (it would use neodymium), the higher scarcity of dysprosium implies that its price will
likely further increase in the next years. For example, Siemens claims that the development
of stronger permanent magnets has enabled it to upgrade the 3 MW platform to 3.2 MW
while maintaining the same stator dimensions (de Vries, 2014b), and the 6 MW offshore
turbine to 7 MW (Siemens Wind Power, 2015b).
There are several ongoing projects financed by the European Union under the FP7 research
programme with the objective of reducing the usage of rare earths in permanent magnets.
The ROMEO project aims at developing new microstructural-engineering strategies to
improve the properties of magnets based purely on light rare earth elements and,
eventually, developing a totally rare-earth-free magnet.
The Suprapower project aims at developing a superconductor-based generator by using the
superconducting properties of magnesium diboride (MgB2) wires. Task 3.1 in work package
3 (Electromechanical Conversion) of INNWIND.EU has as its main objective the design and
analysis of superconducting direct drive generators, based on the analysis of different
superconducting wires, several electromagnetic generator designs, and different cryogenic
cooling systems. Finally, the EcoSwing Horizon 2020 project aims at demonstrating a
superconductor generator on a direct-drive 3.6 MW wind turbine by 2019.
2.4.3. Gearbox
A gearbox consists of several (usually three) planetary or helical gears. Three-stage
gearboxes (two parallel and one helical gears) are typical for wind turbines of moderate
size (below 1 MW). However, planetary gears provide a reduction in volume for higher
speed ratios. For this reason, bigger wind turbines employ one or two planetary gears
combined with (two or one, respectively) helical gears.
Gearboxes are seen as the least reliable part of high-speed wind turbine configurations,
although most often it is the third stage (the fastest one) that is problematic. Several
studies, including the European project Reliawind, concluded that the electrical systems
(including the power converter) and the pitch system cause more failures. It was also found
23Joint Research Centre 2014 JRC wind status report
that electrical system failures are not necessarily the costlier, nor do they cause more
downtime that any other turbine sub-assembly (Wilkinson, et al., 2011).
In addition, research shows that gearbox failures are most often due to unexpected loads
originating somewhere else, e.g. in the turbine rotor or in its control system as a
consequence of forcing the generator to maintain grid frequency. More detailed data are
needed to improve the designs and, for example, sensors originally from the automobile
industry are now available which can be used for this. System aspects which protect the
Figure 9: Drive train features classified according to wind turbine rated power. Data corresponding to
installations in EU MS during 2012. Source: JRC Database.
gearbox and lengthen their life include using a full converter which reduces grid-induced
loads or individual-blade pitch feeding which reduces loads when the blades reach the
extreme positions (vertical up or down).
New gearbox designs aim at lighter gearboxes, higher reliability and efficiency to reduce
both CapEx and OpEx. For example, bearings that are reinforced at the exact points where
they support the highest loads and better transfer of loads to the tower (thus by-passing
the gearbox), also help in improving gearbox reliability.
Winergy disclosed in 2014 the development of a new gearbox concept including journal
bearings (4). This solution would be an alternative to rolling element bearings by reducing
wear, noise and vibration. Also, efforts are being made in order to reduce the weight and
size of the gearbox. In this sense, Moventas presented the ongoing developments in a new
gearbox with higher ratio torque-weight.
Figure 9 shows the type of drive train employed in wind turbines installed in European
Union Member States during 2012, classified according to wind turbine rated power.
Onshore installations were mainly dominated by wind turbines in the range 1–3 MW,
whereas turbines with higher rated power (in the range 3–7 MW) are employed for offshore
installations as well. As regards drive train configuration, a 3-stage gearbox coupled with
an asynchronous generator (Type C) is the most common arrangement for wind turbines
(4) Unlike ball bearings, this bearing type does not employ rolling-elements. The shaft directly slides over the bearing
surface.
24Joint Research Centre 2014 JRC wind status report
under 3 MW. However, Type D (either direct drive or hybrid configuration) is the prevailing
arrangement for wind turbines specifically in the 2–3 MW range. Looking at the offshore
market, most wind turbines installed during 2012 were Type F with a three-stage gearbox
and a full converter, the Siemens machines. Nevertheless, this scenario is expected to
change as most wind turbines addressed to the offshore market introduced in recent years
are based on permanent magnets either direct drive (Type D) or hybrid drive train (Type E).
Incidentally, Figure 9 shows a clear segmentation — in terms of rated power — of wind
turbines aimed at the onshore and offshore market.
2.4.4. Power converter
The power converter is a key element in modern wind turbines that acts as an interface
between the electric generator and the power grid. On the generator side, converters enable
the control of the rotating speed and the output power. On the grid side, the converter has
the ability to control the reactive power and response to fast demand changes on the active
power (Blaabjerg, et al., 2012). This flexibility introduced is even higher in case of full
converters, being both sides — generator and grid — fully decoupled and operation is
possible with any ratio reactive to active power. The main drawbacks of power converters
are (i) they are expensive, (ii) reliability, (iii) relatively low efficiency at partial loads and
(iv) they distort the electrical waveform (especially because of the emission of high
frequency harmonics).
New grid code demands include a longer low-voltage ride through of up to one second in
Germany, improved reactive energy output and remote control by system operator
(Obando-Montaño, et al., 2014). Power converter innovations can realise this whether the
turbine uses a partial converter (e.g. Gamesa) or a full converter (e.g. XEMC Darwin). New
converters resist better weak grid situations.
Research on power electronics is also focused on improving reliability. The OHMWIT project
funded under the FP7 programme aims at creating a new online condition monitoring
system for generators and power converters. The WINDTRUST project (also funded under
the FP7 programme) aims at improving the reliability of key components of the turbine.
With regard to power electronics, the objective is reducing the number of components and
interfaces by using new assembly technologies such as all sintered modules and by
reducing the volume of the inverter by 30 %.
The SPEED project researches on developing a new generation of high power semiconductor
based on Silicon carbide (SiC), in order to improve the efficiency of power electronics
employed in power generation, transmission, and distribution. With regard to wind energy, a
semiconductor able to operate at voltages above 10 kV would be crucial to reduce the cost
of power electronics at the same time as enhancing its performance.
2.5. Offshore foundations
The most popular foundations for offshore wind farms are monopiles and, to a lesser
extent, jacket foundations for shallow-to-medium water depths.
Figure 10 shows the breakdown of installed foundations per type. Even though the most
suitable foundation type also depends on the different site conditions, monopiles have
proved to be the most popular solution.
25You can also read


