Decarbonisation and Disruption - Understanding the financial risks of a disorderly transition using climate scenarios - UNEP FI
←
→
Page content transcription
If your browser does not render page correctly, please read the page content below

Decarbonisation
and Disruption
Understanding the financial risks of a
disorderly transition using climate scenarios

                                    Decarbonisation and Disruption | | 1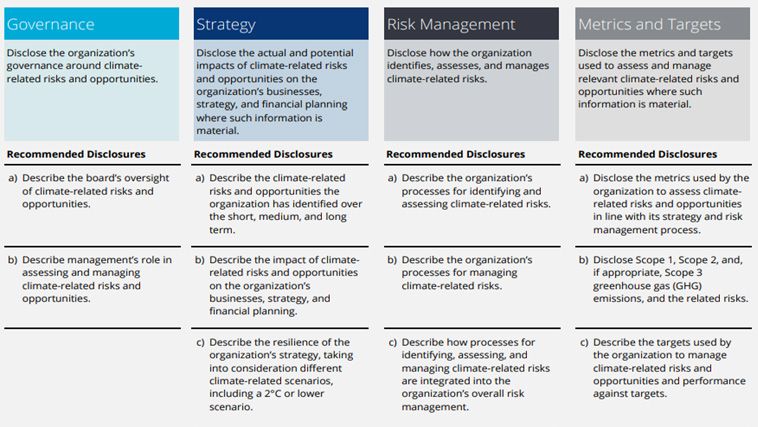
Acknowledgements
The pilot project was led by a Working Group of thirty-nine   Authors
banks convened by the UN Environment Programme Finance
                                                              UNEP FI
Initiative:
                                                              David Carlin, TCFD Programme Lead (david.carlin@un.org)
ABN-AMRO             Deutsche Bank       NIB
ABSA                 DNB                 Nomura               Oliver Wyman
Access Bank          EBRD                Nordea               Caroline Gourri, Knowledge Expert, Team Manager
Bank of Ireland      FirstRand           Rabobank             (caroline.gourri@oliverwyman.com)
Barclays             ING                 RBS                  Project Management
BMO                  Intesa Sanpaolo     Santander            The project was set up, managed, and coordinated by the
Bradesco             Itau                Scotia Bank          UN Environment Finance Initiative, specifically: Remco Fischer
CaixaBank            KBC                 Shinhan              (kai.fischer@un.org) and David Carlin (david.carlin@un.org)
CIBC                 Lloyds              Standard Bank
CIMB                 Mizuho              Standard Chartered
Citibanamex          MUFG                TD Bank
Credit Suisse        NAB                 TSKB
Danske Bank          Nedbank             UBS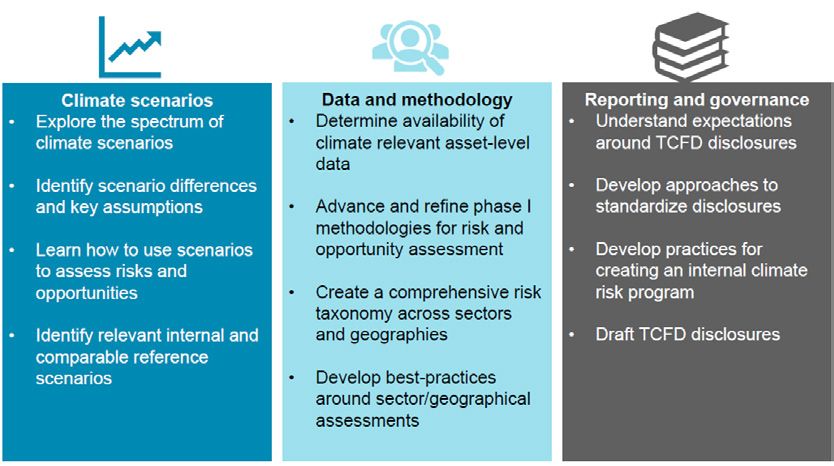
Disclaimer
This report was commissioned by the UN Environment Programme Finance Initiative (“UNEP FI”)
TCFD Banking Program Working Group, which includes the following thirty-nine banks: ABN-AMRO,
ABSA, Access Bank, Bank of Ireland, Barclays, BMO, Bradesco, CaixaBank, CIBC, CIMB, Citibana-
mex, Credit Suisse, Danske Bank, Deutsche Bank, DNB, EBRD, FirstRand, ING, Intesa Sanpaolo, Itau,
KBC, Lloyds, Mizuho, MUFG, NAB, Nat West, Nedbank, NIB, Nomura, Nordea, Rabobank, Santander,
Scotia Bank, Shinhan, Standard Bank, Standard Chartered, TD Bank, TSKB, UBS (the “Working
Group”), to provide an overview of climate risk applications throughout the financial sector and
specific guidance on good practice. This report extends the work of UNEP FI and the participating
banks in Phase I of UNEP FI’s TCFD banking program. UNEP FI and the Working Group shall not
have any liability to any third party in respect of this report or any actions taken or decisions made
as a consequence of the results, advice or recommendations set forth herein. This report does not
represent investment advice or provide an opinion regarding the fairness of any transaction to any
and all parties. The opinions expressed herein are valid only for the purpose stated herein and as
of the date hereof. Information furnished by others, upon which all or portions of this report are
based, is believed to be reliable but has not been verified. No warranty is given as to the accuracy
of such information. Public information and industry and statistical data are from sources UNEP
FI and the Working Group deem to be reliable; however, UNEP FI and the Working Group make
no representation as to the accuracy or completeness of such information and has accepted the
information without further verification. No responsibility is taken for changes in market conditions
or laws or regulations and no obligation is assumed to revise this report to reflect changes, events
or conditions, which occur subsequent to the date hereof. This document may contain predictions,
forecasts, or hypothetical outcomes based on current data and historical trends and hypothetical
scenarios. Any such predictions, forecasts, or hypothetical outcomes are subject to inherent risks
and uncertainties. In particular, actual results could be impacted by future events which cannot
be predicted or controlled, including, without limitation, changes in business strategies, the devel-
opment of future products and services, changes in market and industry conditions, the outcome
of contingencies, changes in management, changes in law or regulations, as well as other exter-
nal factors outside of our control. UNEP FI and the Working Group accept no responsibility for
actual results or future events. UNEP FI and the Working Group shall have no responsibility for
any modifications to, or derivative works based upon, the methodology made by any third party.
This publication may be reproduced in whole or in part for educational or non-profit purposes,
provided acknowledgment of the source is made. The designations employed and the presenta-
tion of the material in this publication do not imply the expression of any opinion whatsoever on
the part of UN Environment Programme concerning the legal status of any country, territory, city
or area or of its authorities, or concerning delimitation of its frontiers or boundaries. Moreover, the
views expressed do not necessarily represent the decision or the stated policy of UN Environment
Programme, nor does citing of trade names or commercial processes constitute endorsement.

Copyright
Copyright © UN Environment Programme, January 2021 This publication may be reproduced in
whole or in part and in any form for educational or non-profit purposes without special permis-
sion from the copyright holder, provided acknowledgement of the source is made. UN Environment
Programme would appreciate receiving a copy of any publication that uses this publication as a
source. No use of this publication may be made for resale or for any other commercial purpose
whatsoever without prior permission in writing from the UN Environment Programme.
Contents
                                       1. Introduction........................................................................................ 1
                                            1.1.   Context for this paper.............................................................................................. 1
                                            1.2.   Risks of a disorderly transition................................................................................. 3
                                            1.3.   Climate scenarios for disorderly transitions............................................................ 5
                                            1.4.   Case study assessment methodology..................................................................... 8

                                       2. The oil and gas sector........................................................................... 9
                                            2.1.   Market trends........................................................................................................... 9
                                            2.2.   The potential impacts of a disruptive transition.................................................... 10
                                            2.3.   Ensuring an orderly transition................................................................................ 11
                                            2.4.   Climate scenario analysis of the disorderly transition........................................... 12

                                       3. Utilities and power generation sector.....................................................15
                                            3.1.   Market trends......................................................................................................... 15
                                            3.2.   The potential impacts of a disruptive transition.................................................... 19
                                            3.3.   Ensuring an orderly transition................................................................................ 20
                                            3.4.   Climate scenario analysis of the disorderly transition........................................... 20

                                       4. Metals and mining (industrials) sector....................................................22
                                            4.1.   Market trends......................................................................................................... 22
                                            4.2.   The potential impacts of a disruptive transition.................................................... 23
                                            4.3.   Ensuring an orderly transition................................................................................ 23
                                            4.4.   Climate scenario analysis of the disorderly transition........................................... 23

                                       5. Agriculture sector...............................................................................26
                                            5.1.   Market trends......................................................................................................... 26
                                            5.2.   The potential impacts of a disruptive transition.................................................... 26
                                            5.3.   Ensuring an orderly transition................................................................................ 27
                                            5.4.   Climate scenario analysis of the disorderly transition........................................... 27

                                       6. Participant case studies.......................................................................29

                                       7. Conclusions.......................................................................................40
                                            7.1.   A looming threat..................................................................................................... 40
                                            7.2.   The right tools for the job....................................................................................... 40

                                       8. Bibliography.......................................................................................42

4 | Decarbonisation and Disruption | Contents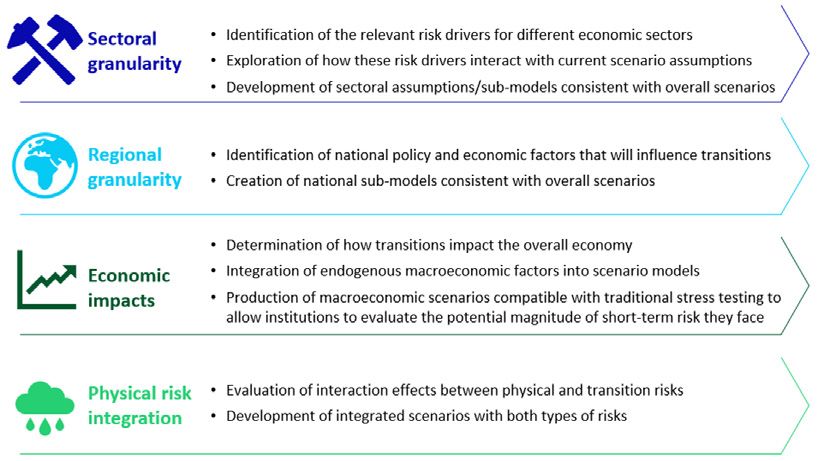
1. Introduction
1.1.        Context for this paper
In 2015, the Task Force on Climate-related Financial Disclosures (TCFD) was created by the Finan-
cial Stability Board (FSB) to support the disclosure of climate-related financial risks. The creation of
the TCFD acknowledged the fact that climate risks are financial risks and firms, markets, and regu-
lators need to prepare accordingly. A key aspect of that preparation would be the assessment and
disclosure of climate risks in a decision-useful format for financial actors. To that end, in 2017, the
TCFD published guidance on climate risk disclosures, with four guiding pillars and eleven recom-
mended disclosures as shown below in Figure 1 (TCFD 2017).
Figure 1: TCFD pillars and recommended disclosures

Following the TCFD’s guidance on climate risk disclosures, the United Nations Environment
Programme Finance Initiative (UNEP FI) convened a consortium of banks to implement these
new recommendations. In a yearlong program, which became known as UNEP FI’s TCFD Bank-
ing Program- Phase I, sixteen international banks collaborated with leading climate modelers and
expert consultancies to develop approaches for assessing climate risks and opportunities in their
portfolios. The banks engaged Oliver Wyman, a global management consulting firm, to develop
an approach for evaluating corporate lending portfolio exposure to transition risk under different
climate scenarios (UNEP FI 2018). The methodology developed for transition risk assessment is
detailed in the UNEP FI report, Extending Our Horizons, and is reviewed again briefly in this report
(UNEP FI; Oliver Wyman 2018). A similar effort was conducted to develop a physical risk assess-
ment methodology in collaboration with Acclimatise, a climate-focused consultancy.

                                                                                               Decarbonisation and Disruption | Introduction | 1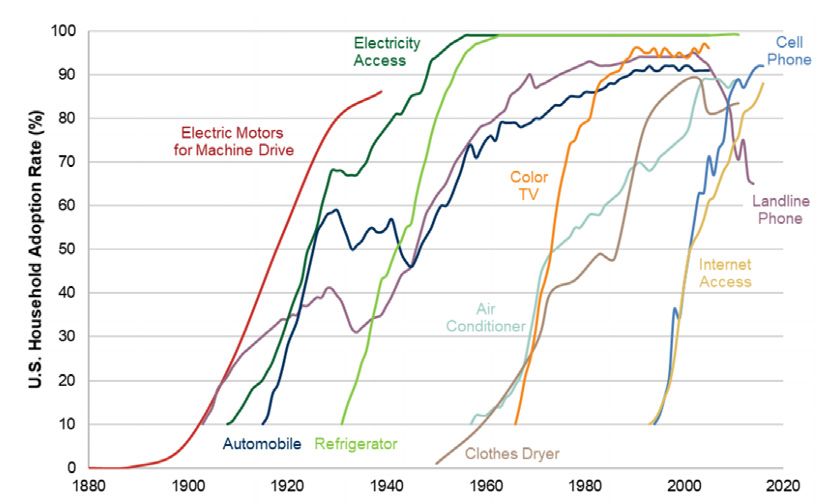
Since 2017, significant advancements have taken place in the areas of climate risk assessment
                                        and disclosure. These changes have included greater knowledge and awareness by financial
                                        actors, increased regulatory requirements for disclosure, and new tools and scenarios for conduct-
                                        ing climate assessments. As a result, UNEP FI decided to convene another yearlong TCFD banking
                                        program in 2019. Termed “Phase II,” this new program sought to increase climate knowledge at
                                        financial institutions and provide an expanded toolkit for climate risk assessment and disclosure.
                                        Phase II saw a marked expansion in the number of participants, thirty-nine global institutions from
                                        six continents. Not only did this larger group support the goal of increasing global engagement, but
                                        it also provided a wide range of perspectives more representative of the financial sector overall. As
                                        a result, the program worked to propose industry-wide good practices for climate risk assessment
                                        and disclosure.
                                        Phase II was divided into three major topic areas. These areas included climate scenarios, data
                                        and methodology, and reporting and governance. Each area was supported by a set of objectives
                                        as shown in Figure 1.

Figure 2: TCFD program key areas of focus- Phase II

                                        In Phase II, the participating banks also explored the climate science and the dire implications of
                                        uncontrolled warming on physical, biological, and societal systems. A robust body of scientific
                                        research on the urgent need to limit warming was compiled by the Intergovernmental Panel on
                                        Climate Change (IPCC) in 2018 as the Special Report on 1.5°C (SR 15). This report explored the
                                        already growing harms of climate change and the importance of aiming for 1.5°C rather than a
                                        2°C target. A few key takeaways from SR15 follow:

2 | Decarbonisation and Disruption | Introduction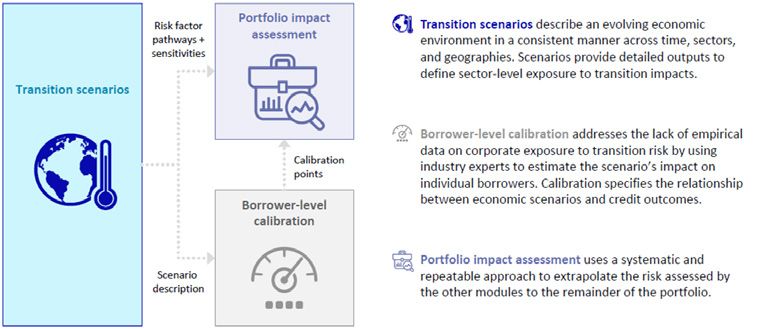
“One of the key messages that comes out very strongly from this report is that we are already
 seeing the consequences of 1°C of global warming through more extreme weather, rising sea
 levels and diminishing Arctic sea ice, among other changes.”

“Limiting global warming to 1.5°C compared with 2°C would reduce challenging impacts on
 ecosystems, human health and well-being, making it easier to achieve the United Nations
 Sustainable Development Goals.”

“Every extra bit of warming matters, especially since warming of 1.5°C or higher increases
 the risk associated with long-lasting or irreversible changes, such as the loss of some
 ecosystems.”
IPCC 2018.

However, given rising temperatures and atmospheric greenhouse gas concentrations, limiting
warming to 1.5°C demands “unprecedented changes.” These changes will not be limited to certain
industries and sectors but will require wholesale transformation of the wider economy. Further-
more, given the little time remaining to curtail emissions and further warming, this transformation
must be undertaken rapidly and aggressively. The emissions reductions consistent with a 1.5° C
pathway demand reductions of nearly 8% annually in global emissions according to the UN Envi-
ronment Programme’s Emissions Gap Report (UNEP 2019). For context, scientists estimate that
the emissions reductions due to the COVID-19 pandemic will be comparable to that 8% figure.
The degree of climate ambition necessary to avoid levels of catastrophic warming is great. Only
through concerted action from public and private sector actors will climate goals be attained.
These changes will be affected through policy shifts, market movements, evolving consumer
demands, and technological progress. These factors will alter all industries in profound ways.
Financial institutions must understand the ways in which this transition can proceed and the risks
it poses to their portfolio companies. Only through a keen understanding of transition pathways
across sectors and geographies, can financial institutions manage their own climate risks and play
a positive role in the low-carbon transition.
This paper examines sector specific drivers of an orderly versus disorderly transition to net zero
emissions. In doing so, UNEP FI makes a case that climate transition risk is a significant near-term
threat to a wide range of sectors and by extension to the financial industry and financial stability.
This paper examines the potential drivers of a disorderly low-carbon transition in multiple sectors
and considers the chaotic implications. Beyond identifying these risk factors in the real economy,
this paper explores how these factors are (or are not) modelled in the climate scenarios used by
financial institutions. These scenarios include both orderly and disorderly transition pathways,
which are assessed through comparative analyses and case studies by banks that participated in
UNEP FI’s TCFD program.

1.2.         Risks of a disorderly transition
The low-carbon transition, whether disorderly or orderly, will cost less in the long run than no transi-
tion at all. The damage caused by unabated emissions and a corresponding acceleration in climate
change impacts. Climate science indicates that the transition to a low-carbon economy is a neces-
sary one, and technology suggests this is possible (Council for Science and Technology 2020).
However, a disorderly transition could have devastating yet avoidable ramifications for the global
financial system. To better understand what can be done to avoid a disorderly transition, it is valu-
able to consider and quantify the possible consequences of climate disorder across the economy.
A disorderly transition, in which the transition to a low-carbon economy occurs in unexpected and
chaotic ways, would present significant economic challenges. Companies would have little time
to adapt to market changes by adjusting their portfolios and/or activities in line with the projected
transition pathway. This is not to say that starting the low-carbon transition soon would spell disas-
ter. The low-carbon transition is already underway. Rather, it is necessary for financial institutions
to begin acting as early as possible to build the capacity to keep pace with technology-led change,
and to have the management systems in place to respond to and adapt to a policy catch-up
scenario. Firms who cannot manage the pace of change will face major losses, as seen in the
telecoms sector and more recently in global coal markets. Some organizations could be impacted

                                                                                               Decarbonisation and Disruption | Introduction | 3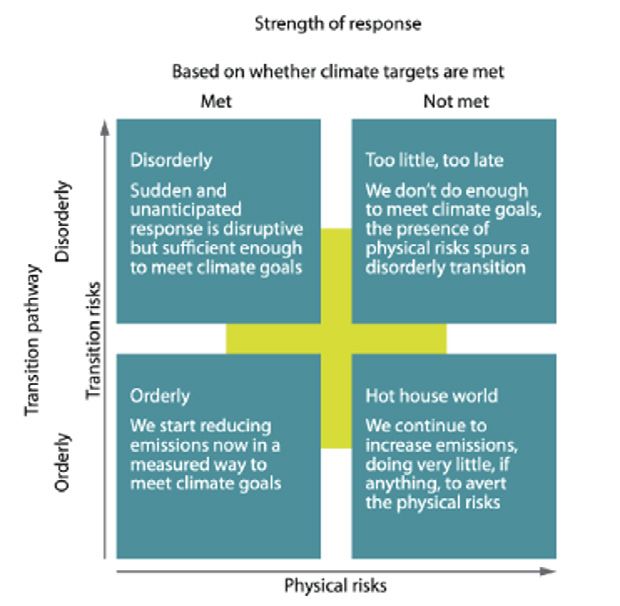
by both physical and transition risks, thereby magnifying potential losses. Lack of readiness could
                                        trigger market panic and lessen international cooperation as organizations and nations focus more
                                        on the risks immediately relevant to them. The resulting failure to collaboratively mitigate climate
                                        risk impacts could lead to shocks:
                                        Transition shocks will likely emerge as the global economy moves away from industries reliant
                                         on non-renewable resources, such as the coal industry. Financial institutions could incur losses
                                         on exposures to such firms with business models not built around the economics of an accel-
                                         erated low carbon transition. These firms could see their earnings decline, businesses disrupted,
                                         and funding costs increase due to policy action, technological change, and shifts in consumer and
                                         investor behaviour. Risks can materialize especially if the shift to a low-carbon economy is abrupt
                                        - as a consequence of prior inaction, poorly designed policy frameworks, or uncoordinated globally
                                         (Adrian, Morsink, and Schumacher).
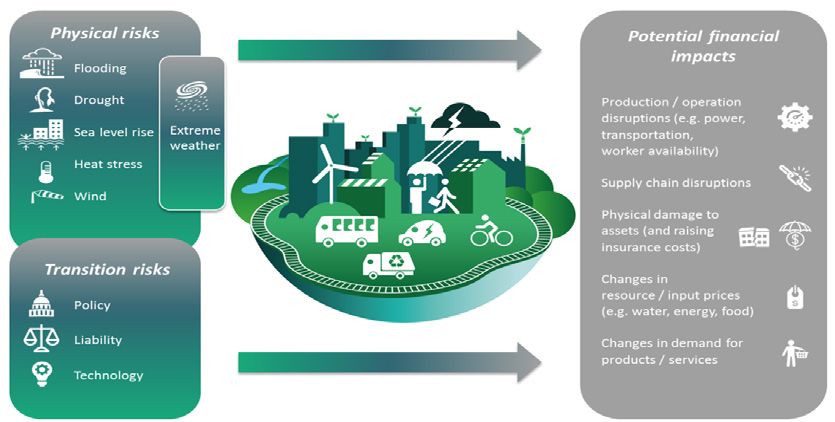
                                        Although the public is often focused on the physical impacts of climate change, economic transi-
                                        tions carry their own potential to significantly weaken firm-level and market integrity. Influenced by
                                        the shift to a low-carbon economy, disruptions in production and operations, changes in resource
                                        input prices, and shifting demand for products and services all have the potential to cause chal-
                                        lenges for financial actors (CICERO 2017).

Figure 3: Scope of climate risks and financial impacts

                                        The risk of a disorderly transition has increased in recent years, as governments, businesses, and
                                        society begin to recognize the damage done by long-term inaction on climate and the limited time
                                        remaining to hit scientifically critical climate goals.
                                        In addition, the rise of climate realpolitik could exacerbate market disruptions, with the imple-
                                        mentation of border climate tax adjustments (Bloomberg 2020) and divergences in the transition
                                        pathways of the world’s largest economies already apparent (Financial Times 2020). The route the
                                        world follows to net-zero emissions will have major implications for the level of transition risks
                                        faced by financial institutions and the wider economy.

4 | Decarbonisation and Disruption | Introduction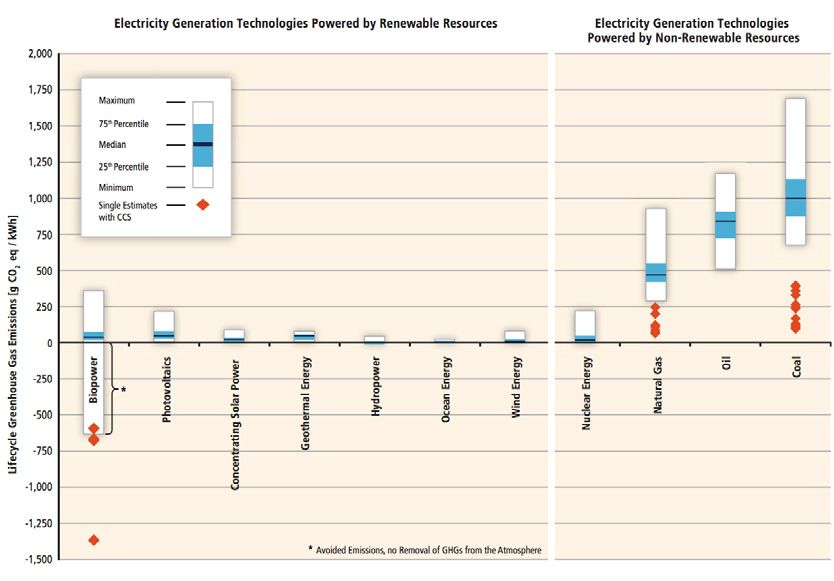
1.3.        Climate scenarios for disorderly transitions
Financial regulators have increasingly recognized climate risk as a financial risk. The Network for
Greening the Financial System (NGFS), a global collection of regulators and supervisors, takes the
view that the combination of climate-driven physical and transition risks could have significant
impacts on global financial systems.
In an expanding acknowledgement of the potential damage of a disorderly transition, micro and
macroprudential regulatory bodies are increasingly acting to better understand individual and
systemic climate transition risk. A growing number of jurisdictions have announced plans to create
or explore climate stress tests in the next two years, alongside mandatory TCFD reporting for
financial institutions and other large companies.
In Europe, several central banks and prudential regulators have made major progress with their
climate risk stress tests. The Bank of France will define climate stress test parameters this year
(Environmental Finance 2020); the Netherlands launched and analysed climate risk stress tests
in 2019 (DNB 2020); Norway’s central bank announced a new requirement to integrate climate risk
into its assessment of regulation entities’ financial health (Norges Bank 2020); Denmark is continu-
ing to develop stress testing tools; and the Rijksbank, the Swedish Central Bank has divested from
Alberta provincial bonds on the basis of climate risk (The Guardian 2020). The Bank of England
is also proceeding with these enquiries (Financial Times 2020). In the Americas, the US Senate
has proposed a ‘Climate Change Financial Risk Act’ that would mandate climate risk disclosures,
and the Commodities and Futures Trading Commission, the US derivatives regulator, published an
assessment of climate risks and opportunities in that market (CFTC 2020). With the global total
notional amount outstanding for global derivative contracts estimated at $640 trillion by the Bank
for International Settlements, bringing climate risk calculations into this market could be trans-
formative (BIS 2020). The Canadian central bank has announced an intention to develop climate
stress tests, and the Bank of Mexico is leading the continent with sophisticated climate risk
models and networked financial valuation analysis (Battiston 2019). In Asia, the Monetary Author-
ity of Singapore will begin climate stress testing regulated banks and insurers and the Australian
Prudential Authority has put climate stress testing on the list of priorities for 2020.
Other regulations coming to the fore involve the way firms assess and manage climate risk. In
the UK, the Bank of England’s Prudential Regulation Authority (PRA), who are at the forefront of
this movement, have proposed supervisory expectations on climate risk management (Bank of
England 2020). These expectations would require regulated financial institutions to consider and
report on how certain climate-related scenarios would affect their business. This would include
analysis on transition risks, as economies decarbonize to meet the climate targets agreed to in
the Paris Agreement, and physical risks linked to increasingly severe climate (e.g. heat waves) and
weather-related events (e.g. forest fires).
Prudential regulators, led by NGFS members, are also moving forward by developing an analyti-
cal framework for assessing climate-related risks in order to assess the potential impact of these
risks on both the economy and financial stability. These actions include reviewing the various
outcomes of climate change and the policies required to mitigate, whilst assessing what the finan-
cial impacts and the timeframe at which these risks could materialize.
In the US, a growing number of cities and states are adopting new climate laws to align financial
market regulation and fiscal spending plans with the Paris Agreement. For example, a 2019 bill in
New York, proposed a target of net zero greenhouse gas emissions by 2050 (Environment America
2020).
The simultaneous demand and supply shocks on fossil fuels during the COVID-19 crisis have
pushed transition risk concerns into the mainstream by triggering write-downs and consolidation
within the world’s largest fossil companies. COVID-19 has shown how energy market trends can
rapidly accelerate, and that environmental factors can prove to be remarkably disruptive to estab-
lished markets. A significant proportion of delinquent or defaulted assets held by global banks are
from these fossil fuel companies as of Q3 2020, as a report from think-tank Carbon Tracker states
(Carbon Tracker 2020).
Transition risks were already of increasing concern to regulators and financial institutions, but the
acceleration of the energy transition through the pandemic period has been acutely felt in high
emissions sectors such as coal, steel, aviation, shipping and upstream oil and gas. Such funda-
mental changes will inevitably impact the balance sheet and the lending and underwriting oper-

                                                                                             Decarbonisation and Disruption | Introduction | 5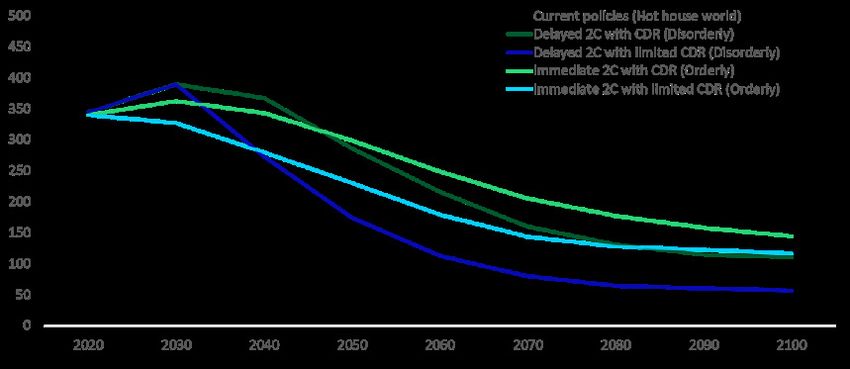
ations of banks, leading to both risks and opportunities. For example, while mortgage portfolios
                                        in coastal areas may be exposed to the physical impact of climate change through rising sea
                                        levels and increased incidence and severity of flooding, massive amounts of capital and new
                                        financial products will be required to fund the transition and finance climate resilience, creating
                                        new demand for bank services (Morgan Stanley 2020). In any structural change to the economic
                                        system, there will be winners and losers. This means that banks and other financial institutions
                                        must be ready to manage the risks linked to incumbents entering secular decline and the opportu-
                                        nity for new players to grow into a changing energy landscape. The best way to ensure that banks
                                        will be capable of staying abreast of system-level changes will be to keep the low-carbon transition
                                        orderly and begin it as early as possible across key sectors of the economy.
                                        An early transition to net-zero emissions will enable a smoother process, mitigating some of the
                                        risks associated with the transition. The key to an early transition is not just more transparent and
                                        systemic risk disclosure as described in the TCFD recommendations (FSB)—it also requires an
                                        understanding of financial institutions’ portfolio-level exposure to transition impacts. Confidence
                                        that risk modelling and scenario analysis is detailed enough to capture these risks:
                                        Scenario analysis of a transition to a low-carbon economy is about more than just disclosure;
                                        transition risks are already an evolving reality for the banks and their clients. Just in the past year,
                                        climate policy has evolved in ways that could impact bank portfolios… Understanding the impact
                                        of potentially more aggressive policies and disruptive technologies on banks’ portfolios is critical
                                        from a risk management perspective (UNEP FI; Oliver Wyman 2018).
                                        The NGFS has recognized the importance of climate scenario analysis in enabling financial actors
                                        and markets to evaluate and manage climate risks. In June 2020, the NGFS developed climate
                                        scenario guidance for regulators as well as a standard set of “reference” scenarios. The NGFS
                                        reference scenarios were developed with leading climate modelers (Potsdam Institute for Climate
                                        Impact Research (PIK), International Institute for Applied Systems Analysis (IIASA), and the Pacific
                                        Northwest National Laboratories and University of Maryland) and will increase comparability of
                                        scenario analyses (NGFS 2020). The climate research institutions involved and the integrated
                                        assessment models they use to produce the scenarios are:
                                        ◾ Potsdam Institute for Climate Impact Research (PIK)- Regional Model of Investment and Devel-
                                          opment (REMIND-MAgPIE 1.7-3.0)
                                        ◾ International Institute for Applied Systems Analysis (IIASA)- Model of Energy Supply Systems
                                          and their General Environmental Impact (MESSAGEix-GLOBIOM_1.0)
                                        ◾ Pacific Northwest National Laboratories and University of Maryland (PNNL-UMD)- Global
                                          Change Analysis Model (GCAM 5.2)
                                        The NGFS scenarios explore different climate futures including both orderly and disorderly tran-
                                        sition scenarios. For each type of scenario, there is a specific storyline that has implications for
                                        the low-carbon transition, such as different temperature targets or different deployment of nega-
                                        tive emissions technologies. Figure 4 and Figure 5 show the different scenario classifications and
                                        storylines within the NGFS reference scenarios.

6 | Decarbonisation and Disruption | Introduction
Figure 4: NGFS scenario classifications
Figure 5: NGFS scenario storylines
Decarbonisation and Disruption | Introduction | 7These reference scenarios will be applied by financial institutions conducting climate scenario
analysis and by regulators designing climate stress tests. The wide application of these reference
scenarios reflects the growing importance of climate scenario analysis for evaluating climate risks
in the financial sector. As a result, it has become necessary that firms appreciate the assumptions
and design of these scenarios. Through the comparison of different transition pathways, this
report hopes to assist financial users in acquiring a deeper understanding of these scenarios and
their suitable use cases, while also suggesting areas for future scenario enhancement.
1.4. Case study assessment methodology
In this paper, participating banks in UNEP FI’s TCFD program provided case studies to explore and
compare orderly and disorderly transition scenarios. These case studies offer unique perspectives
on how these scenarios are applied by financial institutions to conduct risk analysis. They also
enable the reader to see some of the challenges with climate scenario analysis and suggest areas
for future enhancement of climate scenario models.
In order to produce these case studies, the contributing banks applied the transition risk methodol-
ogy developed in Phase I of the TCFD banking program. While extensive details about the method-
ology can be found within UNEP FI’s Extending Our Horizons report, the following overview of the
methodology is provided to orient the reader (UNEP FI; Oliver Wyman 2018).
During Phase I, UNEP FI and a consortium of 16 banks collaborated with Oliver Wyman, a global
management consulting firm, to develop an approach for evaluating corporate lending portfolio
exposure to transition risk across various climate scenarios.
The program engaged with leading climate modelers to identify suitable climate scenarios for
inclusion in the model. Through an evaluative process, the group selected the integrated assess-
ment models (IAMs) produced by the Potsdam Institute for Climate (PIK) and the International
Institute for Applied Systems Analysis (IIASA). As noted above these institutions were also
selected to provide scenarios for the NGFS exercise.
The methodology incorporated the best available science through partnership with these globally
recognised climate modelers. The three-step approach (see Figure 6) integrated climate scenario
data and borrower-specific information to produce a portfolio-level view of transition risk. This
dynamic methodology allowed for application into different sectors and geographies. By applying
the pilot approach to their portfolios, banks were then able to better implement the TCFD recom-
mendations to assess and disclose their climate risks.
Figure 6: Transition risk methodology from Phase I of the UNEP FI TCFD Banking Program
Initially, this methodology was implemented in an Excel workbook. However, to support the wide-
spread exploration of climate scenarios and the application of the transition risk methodology,
a webtool was developed with Oliver Wyman. This webtool, called Transition Check, provided a
user-friendly interface for conducting scenario analysis. Participants submitting case studies used
either the Excel workbook or Transition Check to generate their results. The primary focus of the
case studies in this paper is on the scenarios themselves rather than on the methodology applied.
8 | Decarbonisation and Disruption | Introduction2. The oil & gas sector
2.1. Market Trends
The Oil & Gas sector has been facing headwinds for some time, both on the cost and revenue
sides. On the cost side, there has been increasing public and governmental pressure on the sector,
combined with growing policy pressure to ban activities including gas flaring (World Bank 2020),
coal extraction (PPCA 2020), offshore oil and gas exploration, phase out the internal combustion
engine (Electrive 2020), and to implement carbon taxes and more accurate mine closure and
reclamation bonding fees (Carbon Tracker 2020). Action on the G20 longstanding commitment
to phase out fossil fuel subsidies would further accelerate the shift in economics of energy away
from fossil fuels (IEA). On the revenue side, markets have witnessed a collapse in prices arising
from an OPEC price war, alongside a demand shift away from fossil fuels and towards renewables
as they become more viable. COVID-19 has exposed the sector’s real vulnerabilities demonstrated
by Shell’s plans to shed 9,000 jobs (The Guardian 2020), and by the rising proportion of delin-
quent bank loans and companies that have declared bankruptcy. The second quarter of 2020 saw
18 bankruptcies for Oil & Gas producers, the highest quarterly total since 2016, with this figure
expected to continue to rise (Reuters, 2020).
The cost competitiveness of renewable power generation with fossil-fired power continues to
enhance the clean energy investment case for companies and their investors (Clean Technica
2020). For example, the price of Solar PV modules in 2015 is 75-85% lower than it was in 2009,
whilst the cost of electricity between 2010-2014 has fallen by half (UN). Declining prices for solar
and wind power generation combined with advances in battery technology make renewable energy
more attractive for investors and consumers.
In 2000, wind and solar energy together accounted for 32 Terawatt-hours of global energy produc-
tion. In 2018, that had grown to 1,854 TWH, a 56-fold increase in 19 years (RHS Financial 2020).
Alongside changing economics in power generation, the Oil & Gas industry is subject to increas-
ing pressure from governments, investors, and the public to support the decarbonization of the
energy system. As this pressure becomes more prevalent, political and environmental lead-
ers have become wary of the future role of Oil & Gas companies in the energy system and their
degree of influence over policymakers, with political and financial sector leaders advocating for
the systematic wind down of fossil fuels in line with targets set in the Paris Agreement (Respon-
sible Investor 2020). Financial markets are beginning to question the sector’s long-term prospects.
The energy sector of the US S&P 500 has fallen by 48% since 2015, easily making it the worst
performing sector in the index during that period. While lower Oil & Gas prices since 2014 have
proved to be the major headwind to sector performance, dividends have continued to be strong,
maintaining investor commitment to the sector (IEEFA 2019). The COVID-19 downturn coupled
with the technology and policy trends described above have led more investors to contemplate the
growing possibility of a ceiling for future hydrocarbon demand (S&P 2020). Absent economically
viable emissions mitigation technology, the highest carbon segments of the sector - coal and oil
sands - may already be entering secular decline (S&P 2020). Investors are focusing more on global
warming, with entities representing $118tn of funds committed to making climate risk disclosures
by 2020.
To date, over 100 global banks and insurers have announced their divestment from coal mining
and/or coal-fired power plants (IEEFA). Investor coalitions like the Net Zero Asset Owners Alliance
are leading a global shift in finance away from fossils to clean energy and Pair Agreement-aligned
portfolios. As more banks begin to account for their financed emissions and then commit to end
financing for the most carbon intensive activities, from thermal coal mining to tar sands extraction,
the energy transition will accelerate. Global fund managers are increasingly marketing “fossil-free”
and Paris-aligned index investment products. This could bring more of the US $6 trillion in ETF
tracking assets (Nasdaq 2019) in line with low carbon transition pathways and will signal to the
larger global pool of around $52 trillion (BCG 2020) in institutional investor capital, that new portfo-
lio targets are necessary. Through the COVID-19 period stock indexes without fossil fuel holdings
Decarbonisation and Disruption | The oil & gas sector | 9have outperformed otherwise identical indexes that include fossil fuel companies. Consequently,
the weighted average cost of capital for the sector has risen, dampening valuations, and reducing
capital availability, and market liquidity (Mills). The European Commission’s Sustainable Finance
Action Plan and the introduction of Paris-aligned and low-carbon benchmarks will further acceler-
ate the capital shift away from high carbon fossil fuels (S&P 2020).
Other companies are using their financial stake in portfolio companies to push them to adopt more
sustainable business practices, and even COVID-19 has failed to slow down the pace of climate
action pledges from the institutional investment community.
The price of crude oil had already been failing to keep pace with inflation over the past three years,
but In April 2020, oil prices dipped lower than ever with the value of West Texas Intermediate crude
dipping below zero for a few hours and trading as low as -$40 per barrel.
In addition to the sector’s long-term downward valuation and pricing trends, Oil & Gas compa-
nies face several other sectoral changes that will further accelerate the transition this decade —
increasingly competitive renewable energy options, public commitment to focus investment on
clean energy in G20 markets, rising public pressure on fossil fuel companies to stop blocking
action towards climate targets, growing policy pressure to phase out fossil fuel subsidies, bans on
certain activities, the potential implementation of carbon taxes, and an increasing movement by
financial institutions to align their investments and lending with net zero targets (UNEP FI).
2.2. The potential impacts of a disruptive transition
A rising number of institutions are committing to carbon neutrality as part of international
programs such as UNEP-FI’s Net Zero Asset Owners’ Alliance. Whether or not one is ready
to commit to the transition to net zero emissions, the question of whether the transition will be
orderly or disorderly is important.
The COVID-19 pandemic is demonstrating how fast the pace of disruption can be. Disorder has
already happened, and it resulted in market, financial and consumer chaos—only in miniature.
What may be awaiting us in the next few decades could be much more severe.
Figure 7: Change in global fossil fuel emissions during the COVID-19 pandemic, %
10 | Decarbonisation and Disruption | The oil & gas sectorAs shown in Figure 7 above, the COVID-19 pandemic has demonstrated how fast the pace of
disruption can be, with global emissions dropping by almost 20% at the peak of the lockdown.
However, even a slower low-carbon transition could be catastrophic for the long-term performance
of some sectors, highlighting the need for careful advanced planning and a clear wind down strat-
egy for the most distressed segments of the fossil fuel sector. The Carbon Tracker Initiative, a think
tank, notes that a 2% decline in the demand for fossil fuels every year could cause the Oil & Gas
company revenues to collapse from an estimated $39tn to just $14tn (Carbon Tracker 2020). The
market value of a quarter of the world’s equity markets is made up of fossil fuel companies who
owe trillions of dollars to the world’s banks, making it easy to see how an even more rapid and
disorderly transition to a low carbon economy could have a seismic effect on the global economy.
There are risks of stranded assets in certain fossil fuel sub-sectors, as the UNEP FI heatmapping
exercise in UNEP FI’s Beyond the Horizon report has shown (UNEP FI 2020). The threat of stranded
assets is likely highest in capital intensive mid-stream and downstream fossil fuel sub-sectors. The
IEA explains that the natural depletion rate of upstream fields may limit the potential for overinvest-
ment for some upstream producers (IEA 2020).
However, with the phase out of gasoline-powered vehicles in jurisdictions from California to the
UK (BBC 2020) planned for 2035, oil demand will be curtailed in the transportation sector. Several
major economies which rely heavily on fossil fuel production and exports will face challenges as
energy efficiency and climate policies reduce demand and raise emissions costs. The COVID-19
pandemic has accelerated these changes, and Shell’s recent restructuring plan, and BP’s multi-bil-
lion dollar write-downs (Wall Street Journal 2020) show that even supermajors are exposed to the
large market shifts currently underway (Business Insider 2020). At the global scale, stranded fossil
fuel assets could amount to a discounted global wealth loss of between $1 trillion and $4 trillion,
with clear distributional impacts. Net fossil fuel importers such as China and EU would reap some
benefits from this process, whilst those countries with large fossil fuel industries, such as Russia,
the United States, Australia, Saudi Arabia, and Canada, potentially seeing their domestic industries
nearly shut down (Mercure et al 2018). While it is likely that fossil fuels would eventually be phased
out of the energy system in any kind of transition scenario, a more orderly process would enable
entities with large stakes in fossil fuels to explore alternatives to compensate for their losses from
asset stranding, or to divest early and re-invest the proceeds into cleantech and renewable energy
solutions.
Beyond company and sector-level risk there is concern for the stability of some of the biggest oil
producing states. If there is no longer a market for their resources these rentier states could see
patronage systems reliant on fossil fuel revenues collapse with serious political consequences.
During the COVID-19 pandemic, many of these states are facing acute economic strains. In April,
the IMF said that real GDP in oil-producing countries in the Middle East and North Africa would
plunge by 4.2% in 2020. Many are no strangers to war, corruption or economic challenges, and
they will need to chart a course to recovery after the dramatic collapse of oil prices at the start of
the global pandemic, inflamed by the Saudi-Russian price war, in an oversupplied oil market. Even
strong countries like the US and Canada expect the path to recovery to be painful.
2.3. Ensuring an orderly transition
During the COVID-19 pandemic, individual countries took protectionist actions which resulted in
their economies grinding to a halt, disrupted trade and devastated demand. An orderly approach,
coordinated globally would have allowed industries, companies and consumers to be more
prepared, lessening fear and confusion which would have reduced the ripple effects that will be felt
for years.
Energy sector investors and policymakers can learn lessons from the COVID-19 process to ensure
that the transition to a low-carbon economy is as smooth as possible. For example, subsidies for
fossil fuels can be wound up in a transparent and orderly manner, starting with the G20. Global
governments can show meaningful support for the build out of distributed energy systems. Policy
coordination across markets will reduce investment costs and will help to maintain open markets
that enable economies of scale in the financing and implementation of new energy systems.
Decarbonisation and Disruption | The oil & gas sector | 112.4. Climate scenario analysis of the
disorderly transition
Given the large contribution of the Oil & Gas sector to global energy systems and emissions, inte-
grated-assessment models used to produce the NGFS reference scenarios provide a high degree
of coverage. There are a number of key variables that can assist financial users in understanding
the effects of a low carbon transition. A few of them are explored below at the global level to high-
light the differences between orderly and disorderly transitions for this sector.
◾ Carbon price- used to represent a variety of policy decisions that shift economic decision-mak-
ing and drive a low-carbon transition (relevant to economic decisions in all sectors)
◾ Primary energy- consumption of energy contained in raw fuels or as an unprocessed input
Figure 7 and Figure 8 below show carbon prices for the REMIND and MESSAGE baseline scenarios
(Current policies) as well as for several 2°C scenarios. As noted previously, the carbon price is the
key lever that climate scenario models use to effect a low-carbon transition. The prices represent
a variety of policy actions whose impacts are converted into carbon prices. It is notable that in a
world without concerted climate action (Current policies), the carbon price remains very low, and
it is only through other market mechanisms such as technological advancements and consumer
preferences that emitting industries are replaced. By comparison, in order to drive a transition in
line with a 2°C world, carbon prices need to rise rapidly. In the scenarios below, two factors affect
the carbon price required. The first is when concerted climate action begins and the second is how
much carbon dioxide removal (CDR) the scenario assumes will take place. Timing is particularly
important given the limited carbon budget. In the delayed action scenarios, which reflect disorderly
transitions, the carbon price needs to rise far higher and faster. In addition, assuming limited CDR
(as shown in the dark blue line below) demands an even higher carbon price to curtail emitting
activities. These high carbon prices will reflect greater cost pressures on companies throughout
the economy as well as consumers of their goods (via pass-through costs). Such a “price shock”
has the potential to adversely affect many businesses and the economy overall.
Figure 8: Carbon Prices under REMIND 2°C scenarios (USD)
12 | Decarbonisation and Disruption | The oil & gas sectorFigure 9: Carbon Prices under REMIND 1.5°C scenarios (USD)
Given the emissions from oil (most notably in transportation), nearly all ambitious climate scenar-
ios require a steep reduction in total oil consumption. Figure 9 below examines some of the 1.5°C
scenarios produced for the NGFS. For both the REMIND and MESSAGE models, the green lines
represent disorderly transitions, while the blue lines represent orderly transitions. While all scenar-
ios show significant declines in oil consumption, the drop is noticeably steeper in the disorderly
scenarios. A sharper and deeper cut to oil consumption will create major challenges for oil produc-
ers, but also may create price volatility and supply problems throughout the economy if down-
stream industries are not prepared for these shifts.
Figure 10: Oil Primary Energy- Immediate 1.5°C scenarios (EJ)
In Figure 10, the green lines represent disorderly transitions, while the blue lines represent orderly
transitions. The MESSAGE scenarios see gas as a bridge fuel, with its consumption growing in
some regions as it replaces more greenhouse gas intensive coal. However, even when considering
its potential as a bridge fuel, under a transition with limited CDR, gas consumption is curtailed. For
REMIND, the effect is even more stark, as a gentle decline in gas under the orderly (CDR) scenario
becomes a steep fall in the disorderly (low-CDR) scenario.
Decarbonisation and Disruption | The oil & gas sector | 13Figure 11: Gas Primary Energy- Immediate 1.5°C scenarios (EJ)
Figure 11 below shows combined primary energy consumption for the REMIND baseline scenario
(Current policies) as well as for several 2°C scenarios. Under the baseline scenario where climate
action does not take place, total consumption rises, largely driven by growth in developing regions.
In the 2°C scenarios below, two factors influence the speed and degree of consumption decline
required. The first is when concerted climate action begins and the second is how much CDR the
scenario assumes. The most orderly scenario is one where climate action begins immediately
and significant future CDR use is assumed (light green). By contrast, the most disorderly scenario
involves delaying climate action until 2030 and then assuming only limited CDR capabilities (dark
blue). Until 2030, the disorderly scenarios see a rise in consumption, which necessitates an even
steeper drop in consumption when climate action begins. In the delayed and disorderly scenarios,
the rapid curtailment of consumption will pose existential challenges not only to upstream produc-
ers, but also to midstream and downstream firms.
Figure 12: Oil & Gas Primary Energy- REMIND 2°C scenarios (EJ)
14 | Decarbonisation and Disruption | The oil & gas sector3. Utilities and power
generation sector
3.1. Market trends
The power generation sector is becoming ever more competitive as renewable energy investment
and the buildout of generation capacity grows. The COVID-19 pandemic has also accelerated
transformation of this sector to the extent that even the world’s largest commodities traders are
now hedging climate risk with investments in clean energy (Financial Times 2020). With a fall in
energy demand from lockdowns, renewable sources, particularly wind and solar, saw their share in
electricity substantially increase at record levels in many countries as companies turned off fossil-
fired power plants. In less than 10 weeks, the USA increased its renewable energy consumption
by nearly 40% and India by 45%. Italy, Germany, and Spain all set new records for variable renew-
able energy integration to the grid (IEA 2020). Renewable energy already represented almost 75%
of all newly installed power generating capacity, and this trend is accelerating (IRENA 2020). The
pandemic period has shown fossil fuel companies and their investors what a massive disruption
in demand and the transition to clean energy systems could mean for investor returns in the sector.
Biomass, hydropower, geothermal and offshore and onshore wind can now all provide electricity
competitively with fossil fuel burning power systems (Lazard 2019). The most competitive utili-
ty-scale solar PV projects are now able to generate electricity for just US $0.08 per kilowatt-hour
(kWh) without financial support, compared to a range of US $0.045 to US $0.14/kWh for fossil fuel
power (UN). As transition pressures, including the withdrawal in subsidies and shifting consumer
sentiment negatively impact fossil fuel power generation, clean energy prices will continue to fall.
Through the 2020s, the business case for fossil fuel burning in power generation will continue to
diminish as the deployment of renewable energy scales up across markets.
Relative cost is not the only factor to consider in assessing the pace of energy transition in power
utilities. Per capita demand for energy is also changing, driven largely by technology advances.
More efficient appliances, computers, and lighting systems linked to energy efficiency policy initia-
tives are changing consumer demand profiles, with per capita demand growth largely flat despite
rising populations (Carbon Tracker; HuffPost 2020). The implications of flattening overall energy
demand are problematic for fossil fuel power utilities companies, as their increasingly costly
carbon-emissions will not be reliably offset by revenue increases (Bloomberg 2016; WEF 2020).
Hydrogen is another promising low-emissions fuel that is being developed to replace solid fossil
fuel in transport, particularly for aviation and shipping. Since almost all hydrogen is currently
produced from fossil fuels, there will need to be significant infrastructure changes to support the
expansion in production of “green hydrogen” - water electrolysis hydrogen production powered by
wind and solar energy (EDF 2019). France has started a ‘Hydrogen Territories’ program, an initia-
tive which should contribute significantly to H2 power development (BIG HIT 2020). Utilities and
gas players are also starting to explore hydrogen as they are keen for natural gas to provide the
energy input for hydrogen creation. French power utility EDF has launched Hynamics, a subsidiary
to produce and market low-carbon hydrogen for energy, industrial, and mobility applications.
Much of the initial hydrogen production may come from natural gas with CCS (blue hydrogen),
making it a low-carbon energy source (SINTEF 2019). However, the longer-term goal for hydrogen
production is “green hydrogen” produced using renewable energy sources. Both types of hydrogen
will help to shift demand away from fossil fuels in the transport sector (IRENA 2020). In the United
States, while the Trump administration has not signalled an intention to support cleaner energy,
the Biden platform promises $2 trillion in clean energy spending in a first term, while targeting a
carbon-free power sector by 2035 (Biden campaign 2020). These measures will, however, require
congressional legislative approval, but indicate the direction of travel in one of the world’s largest
energy systems.
Decarbonisation and Disruption | Utilities and power generation sector | 15The global power generation sector has considerable incentives to push renewable and low-car-
bon technology forward. Rising consumer demand for greener energy, much like in the Oil & Gas
sector, has expanded the market for such technologies and services and is changing the overall
energy demand structure to reflect a system of more distributed generation assets coupled with
battery storage. Consumer enthusiasm for green energy is driven in part by some of the less quan-
tifiable benefits of green energy use. Technological advancements are enabling consumers to
directly develop micro grids and community power systems. At the same time, renewable energy
is becoming more accessible to urban consumers with digital power aggregators offering inex-
pensive renewable energy to consumers across their local utility’s grid by connecting individual
renewable sources like residential solar panels, putting increased cost pressures on incumbents to
respond in a number of markets (IRENA 2019).
The shift toward cost-competitive renewable energy means shrinking demand for more emis-
sions-intensive energy sources, even in formerly reliable markets. For example, coal, which has
faced structural decline in the developed world, is also showing signs of decline in developing
countries. In 2019, coal consumption declined by 0.6% and its share in primary energy generation
fell to its lowest level (27%) in 16 years (BP 2019). In the US, coal has declined from serving 45% of
US power demand in 2010 to just 23% in 2019. Coal has been declining in developed economies by
a mixture of environmental policies and competitive pressure from increasingly affordable renew-
ables (IEA).
Further contributing to the decline in fossil fuel power are emerging policies restricting all kinds
of greenhouse gas emissions —not just carbon. Each year there are more regulations governing
emissions-heavy transportation and programs to reduce pollution from transportation and logis-
tics networks. A notable example is the introduction of Low Emission Zones (LEZ) in Europe, which
set EU national emissions ceilings and 2030 targets for several pollutants (SO2, NH3, NMVOC,
NOx, PMx). So far, 220 cities operate LEZs in 14 countries around Europe. The accelerated phase
out of internal combustion engine vehicles at the national level, coupled with a transition to traf-
fic-free city centres around the world (Bloomberg 2020) will further dent fossil fuel demand in the
transport sector. While these policies are aimed at reducing the transportation sector’s emissions
footprint, they have consequences for all high-emission sectors.
Figure 13: Renewable and non-renewable electricity generation CO2 footprints
16 | Decarbonisation and Disruption | Utilities and power generation sectorAnother significant area of concern for fossil fuel power generation remains carbon pricing. Carbon
pricing schemes are gaining significant traction among policymakers, signalling a key development
in the low carbon transition. Forty-six national and 28 subnational jurisdictions are now implement-
ing carbon pricing initiatives, which generated $44 billion of revenues in 2018 (World Bank). How
firms respond to the emergence of these pricing schemes will make or break their resilience strate-
gies in the coming decades.
In addition to carbon pricing and emissions caps on fossil fuel power generation, the gradual shift
in subsidies away from fossil fuels to clean energy is accelerating. IRENA estimates that total
global subsidies for renewable and low carbon energies, including biofuels and nuclear power,
reached approximately US$187 billion in 2017 alone (IRENA 2020). While this figure still does not
equal the subsidies given to fossil fuel energy at approximately US$447 billion in 2017 (IRENA
2020) subsidies for renewable energy projects may still be a promising opportunity for developers
and investors in jurisdictions including the EU, US, Japan, and India, all of which have been signifi-
cant contributors of global renewable and low-carbon energy subsidies.
While disagreement over the pace of change remains, there is consensus that widespread deploy-
ment of renewable energy systems and low-carbon electrification of currently fossil-fuelled activ-
ities will accelerate this decade (IRENA 2020). The so-called ‘electrification of everything’ (Gerdes
2018; NREL 2018) will occur as energy becomes the prevalent power source over other forms of
energy, powering more aspects of consumer, commercial and industrial life. Expanding electrifi-
cation is most evident in the growing sales of electric vehicles—sales that in 2019 topped 2.1 vehi-
cles million globally and accounting for 2.6% of global car sales. While the numbers of electric cars
entering the market are small, a 40% year-on-year increase indicates that their share of the total
will increase quickly (IEA). There is emerging evidence that the COVID-19 economic slowdown has
even further hastened the rise of electric vehicles, which represented the only growth category in
the European auto market during the slowdown (Forbes 2020). Similar to other technology adop-
tion processes, the transition to electrification is likely to happen quickly.
Figure 14: Technology adoption rates for various technologies in the U.S.
Decarbonisation and Disruption | Utilities and power generation sector | 17You can also read


