Biofuels - what role in the future energy mix? - Facts, trends and perspectives - IINAS
←
→
Page content transcription
If your browser does not render page correctly, please read the page content below
Biofuels – what role in the
future energy mix?
Facts, trends and perspectives
3

Biofuels – what role                                  CONTENTS
in the future energy mix?                             Summary / 4

Facts, trends and perspectives                        INTRODUCTION AND OVERVIEW / 6

                                                      1 BIOFUELS TODAY… AND TOMORROW? / 8
                                                      Development in Germany • Future potentials in Germany • Development and potentials
                                                      in the EU • Global trends and potentials • Bioenergy trading – development aid or
Uwe R. Fritsche
www.iinas.de
                                   IINAS              irresponsible exploitation?

                                                      2 LAND USE AND BIOENERGY – IN COMPETITION? / 13
                                                      Fuel versus food & feed • Fuel versus environment – land use and biodiversity •
                                                      Fuel versus material use • Fuel versus power and heat • Fuel versus fuel
Horst Fehrenbach
Susanne Köppen                                        3 SUSTAINABILITY OF BIOFUELS / 18
www.ifeu.de                                           Legal status and standards • Sustainability criteria for biofuels • Sustainability certification
                                                      • Extension of sustainability criteria to all bioenergy – and all biomass?

                                                      4 THE NEXT GENERATION – ADVANCED BIOFUELS / 23
With contributions from:
                                                      The 2nd generation • Biofuels from biorefineries? • Biofuels from algae as “G3”?
Dr. Jörg Adolf
Dr. Dorothea Liebig                                   5 TECHNICAL COMPATIBILITY OF BIOFUELS / 25
www.shell.de                                          Biofuels – Types and characteristics • Road transport • Aviation • Shipping •
                                                      Rail transport • Strategic options for the transport sectors

                                                      6 BIOFUELS IN SCENARIOS – THE WAY FORWARD / 32
Commissioned by Shell Deutschland Oil
                                                      Germany • European Union • Global perspectives • Do target scenarios tell the truth?

Darmstadt, Heidelberg, Hamburg, October 2012          7 WHAT NEXT? RECOMMENDATIONS FOR BIOFUELS / 35
                                                      Feedstocks and the future – biofuels in the energy transformation • Making the generation
                                                      change • From Rio with love? • Strategic investments • Acceptance and transparency •
                                                      Course correction – yes, please!

                                                      LITERATURE 38

                                                      GLOSSARY 42

Published by:
Shell Deutschland Oil GmbH
22284 Hamburg
Printed on FSC® -certified paper

Photos
p. 5: plainpicture/Andreas Körner                     Dislcaimer
p. 6: Paolo Black for Shell International Ltd.        This study is an independent expert report by two scientific institutes, that is the International Institute for Sustainability Analysis and
p. 16: Blair Gable/WFA for Shell International Ltd.   Strategy (IINAS) and the Institute for Energy and Environmental Research (IFEU). Its purpose is to contribute to the current discussion on
p. 22: FNR/M. Weitz                                   the role of biofuels in the fuel mix of the future. Contents and statements reflect exclusively the viewpoints and opinions of the IINAS and
                                                      IFEU authors involved in the project. They may be, but need not necessarily be, in agreement with the positions of the client (Shell). The
Design & production: Mänz Kommunikation               exception to this is Section 5 (Technical compatibility of biofuels), which was written by Shell authors.
4                                                                                                                                              SUmmary   5

SUMMARY
Biofuels have been until now the only alternative energy source that has significantly contributed to supplying the trans-
port sector with energy. Biofuels shall contribute up to 10% to the EU road transport fuel supply by 2020. But biofuels that
once had such a green image, and enjoyed broad support, have come under criticism; the development of the market for
biofuels has lost considerable momentum. We have therefore asked the following question once more: What role can
biofuels play in the fuel mix in the future?

▸ The use of biofuels grew strongly in          through regulation of the rights of use and      blends with up to 5% biofuel are standard
Germany between 2004 and 2007, but              exploitation.                                    throughout the world; with B7 and E10, in
its share has been stagnating since then,                                                        Germany / Europe, technical blend walls
at between 5.5-6%. Biodiesel made               ▸ The discussion about the sustainability        seem to be reached for the time being. Of
from rape led the way, ahead of ethanol         of biofuels has led in recent years to a         all transport carriers, heavy-duty trucks,
made from grain – both 1st generation           large number of sustainability standards.        aircraft and ships (as long as LNG does
biofuels. Biofuels have significant long-       Sustainability standards require improve-        not become successful) are those with the
term potential in Germany – by 2030,            ments to the greenhouse gas balance for          fewest possibilities for substituting liquid
domestic biofuels could cover 20% of fuel       biofuels; the biofuels used in Germany           fuels; the strategic value of biofuels is the
needs, and a good 70% by 2050. In the           reduce greenhouse gases by around                highest here – for aviation, only drop-in
EU too, biomass compliant with sustain-         50% on average. The issue of indirect            fuels that can be deployed seamlessly are
ability criteria could in the long-term cover   land-use change (iLUC) has not yet been          to be considered.
around a third of energy needs. Globally,       resolved; bioenergy carriers with a low
Brazil and the USA dominate the biofuel         ILUC-risk are therefore to be preferred.         ▸ Ambitious climate action scenarios
markets, with bioethanol as the leading         Other, mostly less specifically governed         examined how much of the biofuels
product. Worldwide, residues and                protected natural resources include bio-         potential could be implemented and by
degraded areas alone represent a                diversity, the soil, water and social issues.    when. According to those analyses, the
bioenergy potential of 100 to 200               The implementation of binding sustainabil-       sustainable bioenergy potential is
exajoules, which in the long-term could         ity standards is to be seen as progress. In      sufficient to cover a significantly reduced
cover all liquid fuel needs. The trade of       order to avoid undesirable side-effects,         need for liquid fuels for transport by 2050
bioenergy is increasing throughout the          binding sustainability standards are             with (2nd generation) biofuel; and this
world, because the availability of and the      necessary beyond European level; these           applies both to Germany and the rest of
demand for biomass, bioenergy and               are to be extended to all bioenergy and          the EU. Worldwide, it has been calculated
biofuels vary from one region to another.       biomass uses.                                    that global biofuel needs will reach 30
                                                                                                 exajoules.
▸ The increasing use of bioenergy can           ▸ Over 99% of all biofuels produced
give rise to competing uses. Globally,          today are of the 1st generation, obtained        ▸ In order for there to be a (bio) energy
the use of agricultural biomass for feed        from field crops. Biofuels of the 2nd gen-       transition in the transport sector, existing,
(74%) is in the lead, followed by food          eration are, on the other hand, obtained         sustainable biomass potential must be
(18%), and then for energy and as a             mainly from residues, wood and grasses.          used as effectively as possible. Compre-
material at around 4% each. The competi-        They may be hydrogenated vegetable               hensive greenhouse-gas balances and
tion between fuel and food is given most        oils, cellulosic ethanol and Fischer-Tropsch     applying the same standards for all
attention. Biofuels can contribute to price     diesel; however, it has not yet been pos-        bioenergy carriers shall improve the
increases and fluctuations for agricultural     sible to develop them sufficiently ready         competitiveness of the 2nd generation.
products; they can, however, also create        for the market. Bio-refineries, and bio-
employment and income. Of even greater          fuels from algae (3rd generation) go even        In addition, a European market introduc-
importance for food security is the increas-    further.                                         tion programme for them should be set up
ing demand for foodstuff. Worldwide,                                                             to run for 10 years, neutral and open to
at the moment, 1% of agricultural land is       ▸ Biofuels indeed possess similar, but           new technologies. Strategic investments
used for modern bioenergy; in Germany           also different product characteristics,          must be made both in the production of
the figure is 6.8% for biofuels, and 5.7%       compared with fossil fuels. According to         2nd generation biofuels, and in cultivating
for biogas. Other competing uses arise          their chemical characteristics, biofuels         the raw materials needed. To increase the
with regard to the use of the material – for    can only be added to a limited extent to         acceptance of biofuels, we need biofuels
solid biomass (wood), and in the future,        fossil fuels or be total substitutes for them.   and automotive technology coordinated
for bio-refineries, synthetic biosubstances,    The 1st generation biofuels used the most        optimally, or drop-in fuels, as well as
and similar. Competing uses are also            today are usually partial substitutes that       increased transparency with regard to the
emerging between different sectors that         can only be added to a limited degree,           provenance of biomass and biofuels. The
use them (power, heat, transport), as           or require technical adjustments to              (bio) energy transition in the transport
well as within the transport sector. They       engines and vehicles. Road transport is          sector requires regular “adjustments”;
may – at least partially – be resolved          the forerunner when it comes to biofuels;        course corrections are part of this.
6 INtroduction 7
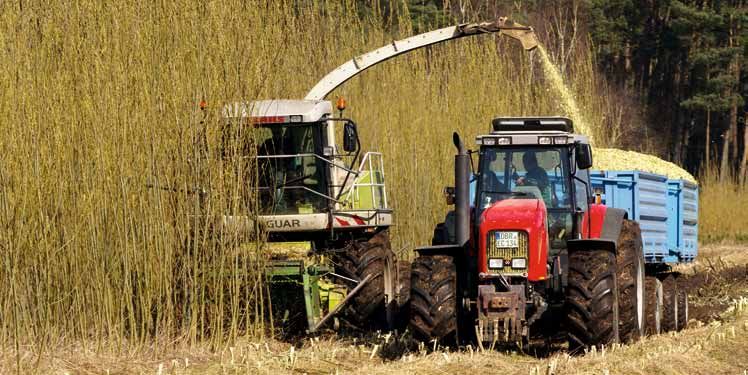
Sugarcane plantation in Brazil
INTRODUCTION AND OVERVIEW
Germany has embarked on a programme of energy transition (known as the “Energiewende”) – and while there are
already a range of alternative fuels for power generation and heating, and renewable energy sources are growing
rapidly in those sectors, transport still relies largely on liquid fuels based on petroleum. So where is the energy transition
in transport? There has been much discussion of electric vehicles and hydrogen propulsion, etc., as technologies for the
future. But the most important renewable energy source in transport so far is biofuels – are they the answer?
BIOFUELS BOOM … already close to 4%. In 2007 it rose to as In 2004 Germany adopted an amend- duction, mainly in developing countries, But today the arguments for and against line and diesel to 10% by volume, but
Let us start with a brief retrospect. In the much as 7.4%, which was the high point in ment to the Renewable Energy Act (EEG), in order to secure access to the necessary biofuels are determined not only by sustain- soon a limit of 7% by volume was set for
early 2000s there was broad consensus biofuels development so far. setting strong financial incentives for raw materials. Infrastructure investments ability aspects. Increasing biofuel percent- diesel. The launch of gasoline with 10%
in Germany across all political parties on generating power from recycled wood, have also increased worldwide in han- ages in gasoline and diesel raised the issue bioethanol (E10) originally failed in 2008
rapid expansion of the use of biofuels; In 2007 Germany set itself a target of forestry waste wood, and in particular dling centres, storage and pipelines, and of which cars could tolerate what percent- due to lack of clarity on questions of
automotive manufacturers, representa- 17% biofuels by 2020; in 2008 the target biogas, and rewarding the use of wood loading facilities in ports for bioenergy age of biofuels, especially when biofuel compatibility, and again in the year of its
tives of agriculture, media, the petroleum was corrected just slightly to between 12 chippings, and also bioliquid for com- and biofuels. There has been significant blends rose to more than 5% by volume. launch 2011 there was broad discussion
industry, politicians and many groups in and 15% – which was still double the bined heat and power (CHP). The use growth most recently in international trad- Originally in 2005 and 2006, the target of compatibility problems.
civil society were advocating biofuels – 2007 figure. of wood (mainly thinnings, and increas- ing in wood pellets for co-firing in coal- was to increase biofuel blending into gaso-
not only in Germany. ingly also wood pellets) in home heating fired power stations, and this demand will
Since 2009, the Renewable Energy Direc- systems has also doubled within just a few continue to grow. ABOUT THIS STUDY …
No wonder, because biofuels had a tive (RED) has been applicable to all EU years. This study was commissioned by Shell Deutschland with the scientific institutes
green image. They were propagated as member states, setting a binding goal BIO COMES IN FOR CRITICISM … IINAS and IFEU, in response to the discussion on propulsion systems and fuels of
a key element in sustainable mobility and of 10% renewable fuels, that is mainly And finally, biomass is used not only What has become of the great hopes the future, and the new Mobility and Fuel Strategy (“Mobilitäts- und Kraftstoff-
climate change mitigation. biofuels. for food and feed, but also materially, pinned on biomass for sustainable strategie”) for Germany. Its purpose is to examine the role of biofuels in the
for bioproducts such as building materi- mobility? As demand for biomass grew, future fuel mix, following the introduction of Super E10. It covers not only road
Biofuels were to create a broader base in BIO-ELECTRICITY AND MORE ... als and cosmetics, paper and textiles. negative effects began to emerge, transport, but all modes of transport. In keeping with the tradition of previous
energy sources for transport, especially Bioenergy is not only used in transport. The dominant global use of agricultural attributed in particular to politically Shell studies and scenarios, it examines all the relevant facts, identifies key
road transport. Biofuels were also to give Biomass is an important component in the biomass is for feed, followed by food, supported expansion of biofuels – with trends, and shows the medium to long-term perspectives of biofuels.
new opportunities for jobs, income and global energy mix – in fact it is the lead- while a smaller quantity goes into energy slash-and-burn clearing of forests for crop
development for farmers in industrial ing renewable energy resource, with a and material use. That is the context of the growing, with expulsion of smallholder It examines how far and under what conditions the various criticisms of
and developing countries – particularly share of more than 10% in global primary increased use of biomass for energy pur- farmers, questionable greenhouse gas biofuels are justified, covering the following questions in detail:
important at a time when world trade was energy consumption. Its use is dominated poses, which has taken place and could inventories, and high subsidies and price
being liberalised and subsidies for agricul- by traditional applications, often with very continue in the future. impact on food. As food has become ■ Where are biofuels today, and what sustainable potential do they have in the
ture and exports removed. simple technologies and low efficiencies, scarcer and more expensive worldwide, medium and long term?
particularly in developing countries. GROWING TRADE IN BIOENERGY the critical discussion of sustainability of ■ What competition is there for use of biofuels, and how valid are the arguments
The result was strong support worldwide As consumption of biomass rises, pro- biofuels reached a first climax in 2008. of their critics?
for the application and use of biofuels, led For example a high proportion of bio- duction and consumption have become
by industrial countries with large vehicle energy use in household cooking and increasingly separate, and that has Though the benefits of biofuels and bio- ■ an transport biofuels be sustainable at all? And what conclusions can be
C
fleets and fuel markets – such as the USA, heating, with large regional differences. boosted global trading in bioenergy – energy were still recognised for agricul- drawn for other biomass uses, including non-energy uses?
the EU and Germany. The share of “advanced” bioenergy in mainly transport biofuels and the relevant ture, energy supply and climate change
the form of electricity and transport fuels feedstocks. In Europe, imports of pellets mitigation, the green image which they ■ iofuels of the second or third generation were once seen as the silver bullet
B
Global production of biofuels was multi- is about 2% in global electricity/transport from Canada, Russia and the USA have originally had was increasingly called into for sustainable mobility. But what has become of the next generation of
plied several times in just a few years, fuel production, which is still quite low also risen. question. This culminated in attempts to advanced biofuels?
even if starting from a low baseline. The (IEA 2011). re-name biofuels as “agrofuels”. ■ Is vehicle technology of today and tomorrow compatible with biofuels?
most significant expansion was for bio- Many countries, especially developing This question is addressed by Shell authors Dr. Jörg Adolf and Dr. Dorothea
fuels in Germany, which is by far Europe’s Here, too, the use of renewables acceler- countries, hope for additional income The use of biomass for power generation Liebig for all modes of transport and for all fuels relevant today.
largest fuel market. Compared with an ated in the mid 2000s. Many countries from exports. International investors and and heating was also criticised for “maizing
EU market share for biofuels of only 1% launched subsidy programmes to promote emerging countries such as China have up the landscape”, with warnings of loss of ■ Finally, long-term scenarios and perspectives of biofuels are discussed,
in 2005, the German biofuel share was the use of biomass in energy supply. started buying up land for bioenergy pro- grassland and other negative effects. together with measures for their possible implementation.
8 BIOFUELS TODAY… AND TOMORROW? 9
1 BIOFUELS TODAY… from the same energy crops (including
lignocellulose) as ethanol; but the
fermentation process is less efficient,
2 Biofuels
Biofuels in Germany
in Germany
Final energy in petajoules (PJ) Share of road transport fuel (energy) in%
AND TOMORROW?
180 9
and thus more expensive.
160 Bioethanol 8
Dimethyl ether (DME) is a fuel that is simi- Vegetable oil 7.4%
140 5.8% 7
There are a large number of biofuels, production processes and biogenic raw materials available today (see Fig. 1). The main lar to liquid petroleum gas (LPG), and can Biodiesel
biofuels worldwide today are bioethanol and biodiesel. Bioethanol is used as a substitute in gasolines, and biodiesel in be blended either with gasoline or diesel. 120 6
diesel fuel. Both of these fuels are mainly used in blends with fossil fuels, but they are also used straight. The concepts for bio-DME are mainly
based on lignocellulose, and also on other 100 5
Bioethanol is mostly made from crops Brazil), oil palm (Indonesia, Malaysia) as a promising biofuel, because it is organic residues such as black liquor from
80 4
containing starch or sugar, in fermentation and sunflower, and also smaller but characterised by relatively high yield per cellulose production, which are also to be 3.8%
and distillation processes. The main raw increasing quantities of jatropha (India, unit area (FNR 2012). But today it is often used for 2nd generation biodiesel. 60 3
materials are maize (especially in the US), Madagascar and others). given more critical assessment because
sugarcane (especially in Brazil), other it uses maize silage as the feedstock for Biomethanol is another product which can 40 2
Share of road transport fuel
cereals (wheat, rye, sorghum, etc.), cas- Apart from biodiesel, straight vegeta- biogas; the prospect of growing maize be used in various ways as a fuel or con- 0.4%
20 0.1% 1
sava, and sugar beet in Europe. The use ble oil and hydrotreated vegetable oil monocultures gave rise to an accusation verted to gasoline (MtG process, “metha-
of lignocellulose based ethanol is another (HVO) are possible fuels. While straight of “maizing up” landscapes. Bio-CNG nol-to-gasoline”). The technique normally 0 0
very hopeful candidate, with the US in untreated vegetable oil is hardly used as also requires vehicle fleets to be designed used is gasification, which can in principle 1992 1995 2000 2005 2010
particular putting a lot of effort into the a fuel any more, there is a lot of interest for this purpose, which is practically not be applied to any type of biomass as the Source: BMU (2012); own presentation
ongoing development of this biofuel. in HVO, especially for aviation. But rapid the case today. raw material.
increase is hindered by the costs and
Biodiesel is mainly produced from vegeta- effort involved in the hydrogen needed for There are other biofuel approaches as Biohydrogen is also in discussion as a Since 2006/07, E5 gasoline has also biofuels. The BLE system included 107 PJ
ble oils by trans-esterification with methanol hydrotreating. well, most of them new and not yet ready fuel, and can be obtained from various been on sale, and since 2011 E10. biodiesel. However, industry association
(methyl ester). The most frequently used for use. For example biobutanol, another types of biomass using different methods. However, E10 had virtually no impact in figures for 2011 show biodiesel sales of
oils come from rapeseed in Europe and Biomethane produced from biogas and alcohol which is more similar to gasoline In particular, there is discussion of bio- 2011. E10 was not introduced everywhere only 86 PJ (VDB 2012).
canola in Canada, soybean (Argentina, processed to CNG quality is regarded than is ethanol. Butanol can be obtained engineering processes using bacteria. in Germany until the second half-year. The
low level of demand for it has meant that The figure for bioethanol in the BLE system
DEVELOPMENT IN GERMANY E10 has so far become established only was around 49 PJ, while the Association
1 RAw Materials and Production Processes for Biofuels There are about 60 million vehicles as a minor grade in the market; the of Ethanol Producers calculated consump-
registered in Germany today, including leading gasoline type is still E5. tion in Germany in 2011 at 33 PJ (BDBe
BIOMASS Process Intermediate Product Process Fuel
43 million passenger cars and 2.5 million 2012). This discrepancy is to be explained
Pressing trucks. Diesel dominates among trucks, Straight biogenic fuels such as biodiesel mainly in exports of ethanol quantities
Oil crops Vegetable oil Vegetable oil while 98.6% of all passenger cars are (B100) or pure vegetable oil now have already entered in the records. Thus in
or extraction
powered by diesel or gasoline engines, hardly any significance, not least due to 2011 the figures for more than 10 PJ of
Waste oils 1.2% by gas propulsion systems, and vehicle engineering. It is not possible to maize-based bioethanol from the USA
Esterification Biodiesel (FAME)
Animal fats 0.1% by hybrid and electric propulsion introduce fuels with a high proportion were entered in the Nabisy system, but
systems (KBA 2012). Despite the high of bioethanol (E85), because, similar to later sold onward to other European coun-
Hydrotreating level of vehicle ownership, the fleet size bio-CNG, only very few vehicles would tries. Another biofuel with some degree
Biodiesel (HVO)
& refining continues to increase. Fuel sales have be able to use them (only Flexible Fuel of importance was refined (hydrotreated)
been declining since 1999, but demand is Vehicles). vegetable oils, with 12 PJ. Straight veg-
Sugar / Starch Milling
Sugar Fermentation Ethanol shifting, with diesel sales increasing and etable oils and biomethane played no
crops and hydrolysis
gasoline sales decreasing (MWV 2012). The breakdown of types and origins of significant role.
biofuels which count towards the quota
Butanol In 2011 about 54 million t of fuels were in Germany is shown in the report by the The basis for biodiesel was mainly
used, including the biogenic components; Federal Office of Agriculture and Food rapeseed oil (80%), followed by waste
Anaerobic of these, 3.7 million t (more than 120 (BLE 2012). These figures come from oil (15%). Apart from palm oil (5%), other
Biogas Purification Bio-CNG
digestion PJ) were biofuels, which accounted for Nabisy (“Sustainable Biomass System”, vegetable oil types played no significant
5.6% of fuel consumption (cf. Fig. 2). The the electronic data acquisition system of role. The situation for bioethanol is as
Lignocellulosic Water/gas shift German biofuels boom which started the BLE), and give an overall figure for follows: wheat was the most important
Hydrolysis Hydrogen
biomass & separation in 2004 was triggered by tax exemp- transport biofuels and the liquid biofuels feedstock (32%), followed by European
tion for straight biodiesel. A mandatory used for power and heat generation. maize (28%) and sugar beet (25%). Rye,
Organic waste,
Gasification Syngas Methanol blending requirement was introduced They also include the quantities registered barley, and triticale together accounted
residues
in winter 2006/07, and the tax subsidy but intended for subsequent export. The for another 13%. Sugarcane was not
Catalysed was gradually reduced (Adolf 2006). figures do not therefore reflect the exact more than 2%. Indication of growing
Dimethylether Biodiesel consumption is still higher than quantities of biofuels used in vehicles in country was only on a voluntary basis in
Source: Ecofys (2012); own presentation synthesis
bioethanol because diesel started with Germany in 2011. The total with sustain- 2011, so the data were not complete for
a higher blending ratio (B7) and more ability certification was approx. 185 origin of the biomass. The main non-
Biodiesel (FT) diesel is used. petajoules (PJ), about 85% of which were European growing country was Malaysia.10 BIOFUELS TODAY… AND TOMORROW? 11
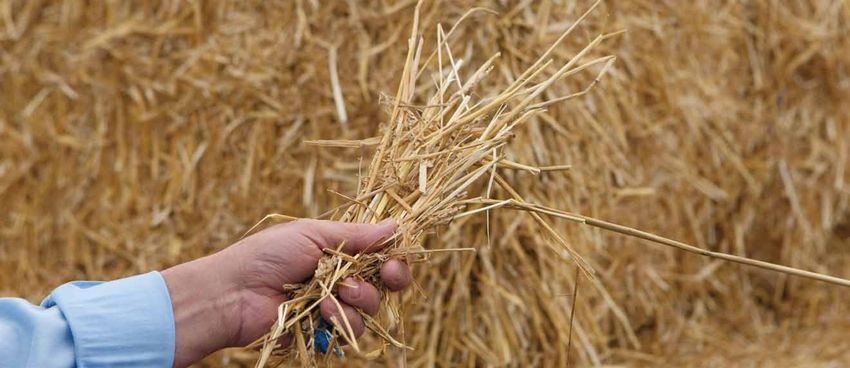
Leaving aside the USA, the dominant sup- 3 Biofuels in Europe (EU 27) 5Weltweiter Energiebedarf
GLOBAL ENERGY DEMANDdes Verkehrs nach Verkehrsträgern
FOR TRANSPORT, BY SECTORS if governments implement an ambitious
Biofuels in Europe per year
pliers for Germany were EU countries, led Final energy in exajoules (EJ)
energy policy. Full use of the bioenergy
Final energy in petajoules (PJ)
by France, Hungary and the Netherlands potentials would make it possible to cover
600 100 Other
(which are in some cases re-exporting). about 25% of energy demand by 2030
Aircraft International
Total (up to 2006) 90 and about 30% by 2050.
500 Aircraft National
The use of biofuels in Germany rose Other biofuels Ship International
sharply from 2004 onwards, but has Biodiesel 80 An analysis of potentials and demands up
400 Ship National
declined again slightly since 2007. Bioethanol to 2050 reached the following conclu-
Rail
Biodiesel from rapeseed is the domi- 70 sion: assuming sustainable production,
Trucks, buses
nant product, followed by ethanol from 300 2nd generation fuels would be used
60 Cars, Light commercial
grain. The feedstocks used are mostly increasingly after 2020 and cover a
Bikes etc.
energy crops. So far, imports play only 200 large proportion of the fuel demand in the
50
a minor role. Success has not yet been truck, ship and aviation sectors by 2050,
achieved in the development of 100 40 while passenger cars would mainly use
“advanced” biofuels ready for the electric propulsion (NTUA 2012). The role
market. 0 30 of imports would be limited to 14% of all
2000 2001 2002 2003 2004 2005 2006 2007 2008 2009 2010 2011 biofuels.
FUTURE POTENTIALS IN GERMANY Source: EurObserv'ER (2012); own presentation 20
Consumption of biofuels has risen The EU has sustainable bioenergy
10
significantly since 2004, and power and and that about 3% of agricultural land biofuels could meet about 20% of potential which could in the long
heat production from biomass have previously used for intensive farming will be Germany’s fuel demand by 2030, 0 term cover about one third of energy
increased in parallel. So how much placed under nature protection, one third of and more than 70% by 2050 1971 1975 1980 1985 1990 1995 2000 2005 2009 demand – and biofuels would
bioenergy and biofuel can be produced food production will be in organic farming, (assuming a significantly lower Source: IEA (2012a); own presentation account for a dominant share of that
in future, and where are the quantity and no grasslands will be converted, but level of demand than today). by 2050.
limits? only grass cuttings used. 6 Worldwide Biofuel Production
DEVELOPMENT AND POTENTIALS Final energy in exajoules (EJ) GLOBAL TRENDS AND POTENTIALS
Various studies1) indicate a sustainable It was also assumed that there is no shift of IN THE EU 3.0 In the past few decades, energy demand
potential of about 1,300 PJ bioenergy biomass from biomaterial use, and that The use of biofuels in the EU has increased for transport has risen continuously
from energy crops, and about 700 PJ from Germany will remain 100% self-sufficient in more than tenfold since 2000. The fastest Biodiesel others throughout the world, and is currently just
biogenic waste and residuals, available food. This potential would thus be avail- growth was from 2005 to 2009. The 2.5 Biodiesel EU under 100 EJ (Fig. 5). A slight decline has
in Germany at least until 2030, and in able without competition between uses – increase slowed down again in 2011 and Ethanol others become apparent since 2008, mainly
this order of magnitude also possible until but its development depends on the reached a level of about 13 million t, Ethanol USA due to efficiency gains particularly in the
2050 (Nitsch et al. 2012). Due to sustaina- framework conditions set for energy and corresponding to about 580 PJ (Fig. 3). 2.0 Ethanol Brazil
OECD countries, but not to a reduction
bility requirements, the energy crops would environmental policy. Germany was the leading producer in transport mileage. Passenger cars
however no longer be maize, rapeseed, nation in the EU again in 2011, followed and trucks account for the majority of
etc., grown on good arable land like today, Taking account of power and heat by France, Spain, Italy, the UK and consumption; shipping and aviation are
1.5
but would mainly be perennial crops (short production from biomass, domestic Poland. As for Germany, there are also a developing dynamically.
rotation forestry, energy grasses) grown on
marginal land and largely without the use The focus of worldwide activities in bio-
1.0
of irrigation and fertilizer, for reasons of 4Primärenergiebedarf
ENERGY DEMAND inAND BIOENERGY
der EU-27 POTENTIAL IN EU27 UP TO 2030
bis 2050 fuels is outside of Europe. Brazil and the
nature conservation.2) US have always been the leaders in terms
Primary energy in exajoules (EJ)
80
of quantity, and underscore this with a
Compared with this potential of a total of 0.5 continuing upward trend (Fig. 6). Brazil is
2,000 PJ there is currently primary energy All other planning to expand sugarcane ethanol on
70
consumption of 14,000 PJ, which could be Transport the basis of yield increase, and also aims
reduced to 9,300 PJ by 2030 (Nitsch et 60
0 to expand on a large scale by designat-
al. 2012). That means domestic bioenergy 2000 2005 2010 ing agro-ecological zones. The USA
would be able to provide 20% – that is 50 Source: IEA (2011b); own presentation have frozen the use of corn bioethanol
three times as much as today. (i.e. ethanol made from maize) at today’s
Energy crops
40 number of studies on sustainable bioen- on a sustainable basis by 2030; about level, in the Renewable Fuel Standard, but
Wastes, residuals
This potential is the basis for the assump- ergy potentials for the EU3) – Fig. 4 shows 2 EJ could be used for biofuels, paral- are planning to use increasing quantities
tion that additional bioenergy crops will 30 the latest results from the EU project lel to bioenergy supply for power and of “advanced biofuels” and ethanol
be grown only on unused arable land, will Biomass Futures (IC et al. 2012), which heat – that is about four times as much as imports from Brazil. Emerging countries
20
not have a negative impact on biodiversity, analyses in depth the costs of bioenergy today (ECN 2012). However, these would such as Argentina (biodiesel from soy
and the sustainability of biofuels. A total mostly be 2nd generation fuels. By com- oil) and South-East Asian countries are
1) Cf. DBFZ, IUP (2011); Fritsche et al. (2004); EEA (2006 + 10
2012); IC et al. (2012); SRU (2007); Thrän et al. (2005),
of 15 exajoules (EJ) of biogenic primary parison: the primary energy consumption planning to boost their production signifi-
WBGU (2009).
0
energy will be available in the EU27 of the EU27 in 2010 was about 74 EJ; cantly in future, and also to increase their
2 ) For detailed description of sustainable energy crop
2010 2020 2030 Reference Sustainable it could be reduced to less than 60 EJ own consumption. Alongside the EU, the
cultivation, see Fritsche et al. (2004), EEA (2012) and 3) C
f. EEA (2006+2007+2012); IC et al. (2012) and Thrän et
WBGU (2009). Source: IC et al. (2012); own presentation al. 2005. by 2030, and less than 50 EJ by 2050 USA and Brazil, 20 other countries have12 USE COMPETITION 13
adopted binding quotas, and another 6
countries have specified blending goals in
their legislation (IEA 2011b).
2050 (approx. 54 EJ). For conversion
of the bioenergy potential to fuels, a
conservative level of 50% for conversion
earn more revenues from exports, espe-
cially from exports to Europe. It gives rise
to the question of how much biomass and
2 LAND USE AND BIOENERGY –
The global bioenergy potentials have
been analysed in many studies;4) an
efficiency was used. Higher levels could
be achieved if coupled products are used,
and conversion technologies improved.
bioenergy Germany could import, taking
account of global equity. The “Model
Germany” Study has proposed introduc-
IN COMPETITION?
overview of these is given by IPCC (2011). ing “globally equitable access rights”, by The rise of both oil prices and subsidies caused substantial increases in the use of bioenergy for power, heating and trans-
Due to the interconnections between agri- The other half of the global bioenergy analogy to equal per capita CO2 emission port since the early 2000s (BMU 2012). In parallel, there has been a strong increase in the use of biomass for food and feed
cultural issues and questions of land use potential would be available for generat- rights (“carbon equity”), setting national (FAO 2011), wood products, textiles, and pulp and paper. The conversion of biomass to chemical products and new materials
and nature conservation, it is not possible ing power and heat, especially in emerg- access rights on the basis of global increased as well (nova 2012). More access to biomass feedstocks creates and intensifies competition for its use.
to give “one” figure for bioenergy poten- ing countries and developing countries bioenergy potential and population size
tial, but rather a range, taking account of – under the demanding condition of a (Prognos, ÖKO 2009).
questions of sustainability. huge improvement in energy efficiency Globally, the dominant use of agricultural 8 USE OF AGRICULTURAL PRODUCTS (WORLD), 2008
worldwide, both in transport and in the The bioenergy potential indicated above biomass is for feed, followed by food,
4.3% 3.7%
Energy crops can also be grown on other consumption sectors. and the population in 2050 would give while energy and material use are sub-
Renewable raw materials, use of biomass
marginal lands that cannot be used for a German “entitlement” of about 1.5 to stantially less significant (Fig. 8). Further
agricultural production, with a positive Regardless of these bandwidths and 3 EJ; that corresponds approximately to growth in global population, changes in Renewable raw materials, use of energy
impact on soil fertility, erosion characteris- uncertainties, the robust estimate the national potential of about 2 EJ. At nutrition habits and also the support for 18%
Feed
tics and carbon content in the soil; and the for sustainable energy potential is the upper limit additional import quantities bioenergy will in future cause an increase
availability of water is also a major between 100 and 200 EJ, to cover all of another 50% would be “permitted”, in biomass demand, putting more pressure Food
constraint. Studies estimate a total of demand for liquid fuels – provided whereas at the lower limit, Germany on resources such as land and water Allocation of biomass by primary cultivation purpose (main
product); quantities include the main raw material and the
between 25 and 100 EJ bioenergy which that fuel demand can be reduced by would not be able to import any bioenergy (FAO 2009; IFF 2009; IIASA 2009). by-products, even if their use may be in another category.
can be harvested on such vacant and massive energy efficiency improve- or biofuels.
74%
degraded land without negative impact ments. The resulting use competition could give
on biodiversity.5) The level of future imports and the coun- rise to various conflict potentials. Use Total biomass: approx. 10 billion tonnes
BIOENERGY TRADING – DEVELOPMENT tries exporting bioenergy and biofuels will competition could directly lead to disputes
Source: nova (2012); own presentation
Together with biogenic waste and residu- Aid OR IRRESPONSIBLE EXPLOITATION? not least be a question of sustainability, over limited resources, or there could be
als, which give potentials of between 50 The major potentials for bioenergy and in its ecological, economic and social disputes due to conflicting goals between
9 COMPETING USES OF BIOMASS
and 100 EJ of bioenergy, a total of 75 biofuels are outside of Europe, with dimensions. the individual demand sectors, as shown
to 200 EJ bioenergy could be available countries such as Argentina and Brazil in Fig. 9.
without use of agricultural land by 2050. able to produce at much lower cost. That There are great differences in bio- Potentials Demand Sectors
This potential is independent of agricul- leads to increased interest in imports, energy and biofuels depending on Use competition need not necessarily be Biomass cultivation ( = land) Heat
tural development, and its use does not especially from Latin America. country of origin, growing methods negative, because it could create incen- Biogenic residuals Power
result in indirect land use change (ILUC) and the further processing steps, so tives to make more efficient use of land Wind , water, etc. Motorised transport
– in fact cultivating perennial crops on West and East African countries such as there would be corresponding risks and water, and to optimise biomass use Food & Feed
formerly degraded land could increase Mozambique also wish to develop their and also opportunities for the export- by replacing inefficient applications. In Raw materials
soil carbon and thus improve the green- bioenergy potentials for export, as their ing countries. market economies, supply and demand
house gas inventory. local markets are limited and they can are regulated by prices, which act as Goals / Constraints
signals to competing purchasers on the
Nature conservation
In addition, depending on the develop- one hand and to producers and potential
Climate change mitigation
ment of yield and consumption, another GLOBAL ENERGY
7 GLOBAL DEMAND
ENERGY & BIOENERGY
DEMAND POTENTIALS
& BIOENERGY POTENTIALS producers on the other, and thus should
Security of supply
200 to 300 EJ from arable and grass- Primary energy in exajoules (EJ) create an equilibrium between them. Employment
land could become available, no longer 700 Grassland
All others Costs
needed for food and feed production. Arable land In reality, the prices are modified by taxes,
Transport
This quantity is disputed because the 600 Degraded areas subsidies, customs duties, etc. Political
parameters are uncertain – negative Wastes and residuals parameters such as quotas for agricultural ■ Environmental and global commons FUEL VERSUS FOOD & FEED
impact of climate change on agricultural 500 products and biofuels lead to correspond- (such as biodiversity) currently have little The public debate on competition
yields and water availability could reduce ing “distortions”. In addition, flexibility to or no market price, and that prevents between biofuels subsidised by govern-
400
the amount of surplus land. Comparison react to changes in price is prevented or corresponding steering effects. ments with food and feed reached a peak
with global energy demand (IEA 2012a) restricted by a number of factors: in 2008. The recent shortage of maize
300
and the fuel demand included in that The economic impact of these factors is to due to a drought in the USA caused
(Fig. 7) shows that half of the “low” 200
■ For food, there are no substitutes reduce price elasticity, and that is made another sharp price rise in world market
global bioenergy potential would be available for basic needs; changes in worse by the differences in market access prices, and led to renewed disputes on
sufficient to replace the whole of the 100 nutritional habits and trends take time. opportunities and market power of the the role of biofuels in the pricing of food
demand for petroleum based fuels by individual players. That results in distribu- and feed, and the consequences for food
0 ■ The availability of capital and access to tional problems. Use competition cannot security.
4) Cf. for example Dornburg et al. (2010), IC, ERC (2011); 2010 2020 2030 2050 Low High infrastructure vary; that is an obstacle to be balanced just by price signals gener-
IEA (2011b); Thrän et al. (2010); WBGU (2009). IEA Energy Technology Perspectives, 2˚C Scenario Global Sustainable increasing supply in response to rising ated in the market without negative side Before examining that in more detail, it is
5) Cf. Cai, Zhang, Wang 2011; ECN et al. (2009); Bioenergy Potentials 2050
Fritsche et al. (2010); Wicke (2011). Source: IEA (2012a), IPCC (2011), Fritsche u.a. 2010; own presentation prices. effects and impact on income distribution. important to look at the development of14 USE COMPETITION 15
the prices of agricultural products in the such as increased fertilizer demand, crop agricultural production in those develop- biofuels is not a long-term option – the hectares (ha) today, of which about 3.5 produced from crops which are grown
last three decades (see Fig. 10). failures and financial speculation. ing countries to decline, and they have price fluctuation induced not only has billion ha are pasture for meat and dairy in monocultures with little crop rotation,
been forced to spend foreign exchange short-term negative impact on food production, and 1.5 billion ha are used on big plantations using large quantities
The producer prices in agriculture rose It has been shown in studies that if the on food imports. security, but also gives the wrong signals for arable farming (FAO 2011). About of fertilizers and pesticides, and in some
sharply at the beginning of the 1980s, specified policy goals for biofuels in for the development of biofuels and 1 billion ha of this arable land are used to cases also with irrigation (EEA 2012).
in parallel with oil prices, and dropped the EU and the US up to 2020 are High world market prices, by contrast, bioenergy as a whole. grow feed, that is indirectly for meat and
again from 1985 onwards as the oil maintained, price rises between 3% are a financial incentive for developing dairy production, and only about 0.3 bil- In Germany, renewable raw materials are
prices went down; then after 2005 they and 13% may be expected for cereals countries to increase their agricultural Growing crops for bioenergy use is in lion ha directly for food. Arable land for mainly grown on arable land which
rose again in parallel to oil prices. That and between 6% and 30% for oilseeds production. The responses to the high direct competition for arable land, which biomaterials accounts for about 0.1 billion covers a total area of about 12 million
was due – among other things – to the (JRC 2011; Fischer 2011). That could agricultural prices in 2008 were greater is not only limited overall, but will tend to ha, and for bioenergy (mainly transport hectares. There are also 5 million hectares
use of energy-intensive fertilizer, and the be increased by other effects such as investments in agriculture, so that food permit less cultivation for energy crops in fuels) about 0.05 billion ha (nova 2012). of grassland (producing grass), and about
increasing use of diesel in mechanised droughts, speculation, etc., or reduced production rose and prices dropped future due to climate change effects, 11 million hectares of forest (producing
agriculture – especially relevant for by more use of non-food raw materials again. increasing food demand of a growing Thus meat and dairy production accounts forest waste products and thinnings). At
maize, rapeseed and wheat (van der for biofuel production (e.g. recycled fats, world population, and regional water for about 92% of agricultural land, present about 0.4 million hectares of land
Mensbrugghe et al. 2011), as confirmed cereal waste products, lignocellulose). The FAO is not the only organisation to shortages (FAO 2011; IFF 2009; IIASA whereas non-animal food accounts for are used for growing biomass for material
by the latest analyses (USDA 2012). see it that way (FAO 2008+ 2012a-d) – 2009). only about 5%, biomaterials 2%, and bio- use, and about 2.1 million hectares for
Price increases in agricultural products the German Ministry of Development Aid energy (biofuels) 1%. So minor changes in energy crops (cf. Table 11).
Since 2005, many studies have given cause more hunger, at last in the short also concluded in its strategy on biofuels And the greenhouse gas balances of consumer behaviour with respect to meat
increasing attention to the effects of bio- term, for those who do not have enough for developing countries that, in the short conventional biofuels, with the exception and dairy products have major land use This area could increase to 4 million
fuels on agricultural price developments. income, because security of food supply is and medium term, energy use of biomass of bioethanol from sugarcane, are not impact and effect on agricultural prices as hectares by 2050, according to a number
They agree that there is now coupling not a question of the existing food quanti- was an additional income source for favourable enough to meet the require- a whole. of studies (Nitsch et al. 2012; Thrän et
between the agricultural market and the ties, but of their affordability, availability agriculture (BMZ 2011). ments of climate change mitigation. Price al. 2010); one third of arable land would
energy market, showing that apart from and access (FAO 2011; HLPE 2011b). dynamism which induces steadily rising The key to securing the future food then be used for growing energy crops.
the factor costs, the prices of agricultural The impact is inevitably particularly hard Biofuels can help developing coun- feedstock costs for biofuels permits no supply security of the world is not so
products are also determined by oil price on countries with high levels of poverty tries without their own oil resources significant expansion of biofuels, espe- much the question of “fuel versus For the sake of nature protection and bio-
movements (Piorr 2010; IEEP 2012). There (WBA 2012). to save scarce foreign exchange at cially in areas of goods transport, and food”, but more the question of what diversity conservation, at least 1 million
is also agreement that the resulting addi- times of rising oil prices, because shipping and aviation, which are price foods are in demand, and who has hectares should be used, and grassland
tional volatility of agricultural prices has But low prices for agricultural products diesel is very expensive in rural areas sensitive. enough income to pay for them. with a high degree of biodiversity should
a negative impact on food security (FAO have so far not led to reduction in poverty there. That means biofuels would be taken out of intensive cultivation – that
2008; HLPE 2012b). and undernourishment – on the contrary, help to modernise agriculture and In the longer term, the use of energy FUEL VERSUS ENVIRONMENT – would be another 0.5 million ha.
low food prices are a part of the problem generate income, and thus increase crops grown on arable land for fuel LAND USE AND BIODIVERSITY
It is also largely undisputed that some (Piorr 2010; FAO 2008 + 2011). Industri- security of food supply. production is therefore not a viable The second competition aspect in biomass It is internationally recognised that
price increases in agricultural products alised countries have undercut production option. cultivation is the question of land use and the protection of biodiversity in nature
are caused by additional demand for in developing countries by subsidised But there is also a large measure of biodiversity. Land consumption by the conservation areas alone is not enough
biofuels, caused by subsidy policies in the agricultural exports, e.g. maize shipments agreement that direct coupling of agricul- Finally, global meat consumption is a expansion of housing and roads, by – cultivation practice on farming land is
EU and the US, alongside other factors from the US to Mexico; that has caused tural and oil prices via conventional major driver of agricultural prices, and soil erosion and over-grazing, and by also important. So far, very few economi-
also of land use and of greenhouse gas negative impacts of climate change on cally viable agricultural methods have
emissions. The production of meat has tri- agricultural production, in parallel with been developed that minimise negative
10 Development of Prices for agricultural Products and Oil pled since 1970 to a global total of about population growth, leads to greater effects on biodiversity – a lot of research
Erzeugerpreisindizes landwirtschaftlicher Produkte
300 million t, and continues to increase pressure on soils and other resources is needed in this area.
Producer price index incl. VAT (2005=100) (OECD, FAO 2012). such as water, forests and biodiversity
300 (OECD 2012). Use competition between bioenergy
Wheat for animal feed
In addition, China and the EU are and nature conservation can be
Maize
250 importing more and more soybeans from The loss of habitats is the main factor reduced by limiting the type and
Rapeseed Argentina, Brazil and the US for their which threatens and reduces biodiversity extent of land use. There are also
Oils and greases growing production of pork, and are (UNEP 2012). To avoid further pressure synergies between bioenergy and
200 Sugar beet using considerable amounts of land for from bioenergy feedstock cultivation, nature conservation, where residual
Crude oil this purpose – very much more than for highly biodiverse land needs to be biomass from landscape care
biodiesel from soybean oil, which is more protected, even where the land is to be activities can be used.
150
a subsidiary product. used for bioenergy crops.
FUEL VERSUS MATERIAL USE
100 Meat and dairy production require large The biodiversity and nature conserva- In Germany, the land used for energy
inputs of feedstocks, consuming more tion issues caused by growing bioenergy crops, mainly for biogas and rapeseed
energy and more land, and have more crops are the same as for conventional oil, and increasingly also for bioethanol,
50
environmental impact than alternative agricultural production, because the already substantially exceeds the land
protein sources such as cereals, vegeta- same agricultural feedstocks are used used for biomass materials (cf. Table 11).
0 bles and aquaculture (FAO 2006; Fritsche for conventional biofuels. To stay com- However, solid biomass will likewise be
1980 1990 2000 2010 et al. 2012a; PBL 2011). Agriculture petitive even where raw material costs used increasingly for energy, also using
Source: DESTATIS, GENESIS database; border crossing prices for crude oil and oils/greases; own presentation worldwide uses a total of about 5 billion increase, today’s biofuels are increasingly wood and straw feedstocks, as bioenergy16 USE COMPETITION 17
is increasingly used for power and 11 LAND FOR GROWING SUSTAINABLE BIOMASS IN GERMANY with priority for material purpose (building IUP 2011). Power from biomass mainly home heating can be reversed or at least
heating and in the 2nd generation of materials, furniture, paper, textiles, etc.), uses recycled wood and waste materials slowed down.
Purpose 2011 (hectares) 2012* (hectares)
biofuels. Bioenergy will thus be in competi- and then, when these biogenic products from the wood industry, and in future also
tion with material use of the same biomass Industrial starch, sugar 170,000 257,000 have reached the end of their useful life, forestry residues and thinnings, and pos- There are many non-biogenic renew-
resources – another use conflict. Technical rapeseed 120,000 120,000 this is to be followed by “post-use” for sibly also wood from short rotation cop- able energy sources available for
Technical sunflower and linseed oil 11,000 11,000 energy. Further efforts will then be needed pices (SRC), which uses additional land. stationary power and heat supply, so
Solid biomass mainly comes from the Vegetable fibres, medical and dyes 10,500 13,500 for separate collection of biogenic wastes, Straw is of little interest for combustion the demand for power and heat can
forests – with roundwood from forestry but cascade use is basically feasible. because of its high proportion of ash, pro- be met by these renewables –
Total raw material use 311,500 401,500
and industrial waste wood, produced with ducing slag and particulates, and chlorine especially if efficiency on the demand
the quality criteria specified by the market. Rapeseed for biodiesel, vegetable oil 910,000 913,000 Competition between material use content causing corrosion. This biomass side is significantly increased. Thus
Alongside these two categories, there are For bioethanol (wheat, sugar beet, etc.) 240,000 243,000 and energy use can be avoided by potential could therefore be available use competition in energy use of bio-
other products which normally find no use For biogas (maize, rye, etc.) 900,000 962,000 cascading. without significant energy competition for mass can be avoided in the long run.
in the wood processing industry, such as For solid fuels (SRC, Miscanthus) 6,000 6,500 2nd generation biofuels, because these
waste and residual wood and thinnings, Total energy use 2,056,000 2,124,500
FUEL VERSUS POWER AND HEAT will use lignocellulose. Thus, competition FUEL versus Fuel
which may be of interest to the pulp and Another possible use competition for will mainly be for forestry residues and The final competitive situation is in the use
TOTAL 2,367,500 2,526,000
paper industry, depending on price. This biomass exists within energy use, that is thinnings, and in the long term also short of biofuels within the transport sector itself.
material use of wood will attract more or Source: FNR (2012); *data estimated between biofuels on the one hand and rotation coppices. Passenger cars, trucks, ships and aircraft
less stable wood demand in the foresee- the use of bioenergy for power and heat have different propulsion concepts, and
able future (DBFZ, IUP 2011), and can be residuals and thinnings for power and heat in view of its combustion properties and on the other. The heating market is on a downward therefore use different biofuels. The fuels
covered by today’s forestry. generating. For straw, the perspectives go relatively high transport cost. To avoid trend, while there is strong growth in non- are also subject to different tax regimes,
beyond 2nd generation fuels, while today’s use competition between material and But today’s biofuels do not compete with biogenic renewables for power generat- and some modes of transport are fully or
But growth is also expected for the “new” use can only be expanded in the area of energy, a cascade concept for biomass bioenergy for power and heat – at pre- ing (solar and wind energy, possibly also partially exempted from taxes. Thus higher
material uses, with bio-plastics, compos- “innovative” material use and in co-firing use is to be implemented, i.e. “structure sent, bio-heat mainly comes from thinnings geothermal energy). Competition between costs may arise at least in the short and
ites (e.g. carbon reinforced fibres) and in large coal-fired power stations. The value before heating value” (Fritsche et al. and sawmill waste (pellets), requiring no fuel and heat could be reduced, provided medium term from the use of biofuels and
bio-refineries, and also the use of forest latter is somewhat improbable for straw, 2010). That means biomass is to be used additional land for growing them (DBFZ, that the trend towards solid biomass in other alternatives to fossil fuels, giving
different relative and absolute cost effects.
The individual users of transport services
Straw for cellulosic ethanol have different price elasticities (ÖKO,
DLR, ISI 2012), which results in different
possibilities to pass on costs.
Higher cost of fuel for passenger cars only
has a dampened impact on the price at
the filling station, because of the high
percentage of taxes on fuel, and there are
only limited possibilities for switching to
other modes of transport. Trucks and
marine transport have lower or far lower
tax rates, and higher elasticity of demand;
and the situation is similar for air transport.
Passing on the additional cost of biofuels
in the passenger car sector thus causes
relatively little demand change, whereas
the reactions may be greater for other
modes of transport.
However, the longer term significance of
biofuels is not in the passenger car sector,
but rather in air and sea transport, and to
some extent also trucks – this has to be
taken into account in future development.
The use competition for biofuels between
the individual modes of transport is
restricted, due to technical and market
effects. The longer-term introduction of
biofuels in aviation, heavy goods road
transport and shipping calls for a pro-
active policy, producing the desired steer-
ing not by means of cost transfers alone.You can also read