Climate Action in Figures - Facts, Trends and Incentives for German Climate Policy 2019 edition - BMU
←
→
Page content transcription
If your browser does not render page correctly, please read the page content below
Climate Action in Figures
Facts, Trends and Incentives for German Climate Policy
2019 edition
2          CLIMATE ACTION IN FIGURES | PUBLICATION DETAILS

    Publication details

    Published by
    Federal Ministry for the Environment, Nature Conservation and Nuclear Safety (BMU)
    Division for Public Relations, Online Communication and Social Media · 11055 Berlin · Germany
    Email: buegerinfo@bmu.bund.de · Website: www.bmu.de/english

    Edited by
    BMU, Division IK III 1,
    Mareike Welke, Maximilian Beck

    Text
    Navigant, Korinna Jörling, Thobias Sach, Berlin

    Design
    www.digitale-gestaltung.de, Holger Ebeling, Berlin

    Printed by
    Druck- und Verlagshaus Zarbock GmbH & Co. KG, Frankfurt am Main

    Picture credits
    Cover: imago images, Jochen Tack
    Page 5: BMU / photothek / Thomas Trutschel · Page 6: shutterstock, Bernhard Staehli
    Page 16: Adobe stock, JackF · Page 26: Adobe stock, Blickfang · Page 48: Can Stock Photo, defun

    Date
    May 2019

    First print run
    2,000 copies

    Where to order this publication
    Publikationsversand der Bundesregierung
    Postfach 48 10 09 · 18132 Rostock · Germany
    Tel.: +49 30 / 18 272 272 1 · Fax: +49 30 / 18 10 272 272 1
    Email: publikationen@bundesregierung.de
    Website: www.bmu.de/en/publications

    Notice
    This publication is part of the public relations work of the Federal Ministry for the Environment, Nature Conservation and
    Nuclear Safety. It is distributed free of charge and is not intended for sale. Printed on recycled paper.
CLIMATE ACTION IN FIGURES   3

Climate Action in Figures
Facts, Trends and Incentives for German Climate Policy
2019 edition

4             CLIMATE ACTION IN FIGURES | LIST OF CONTENTS

    List of contents

    Foreword ........................................................................................................................................................................... 5

    1. Why is Germany committed to an active climate policy? ........................................................................... 6
    1.1 Climate change – causes and consequences ..............................................................................................................................................7
        SPOTLIGHT 2019: IPCC special report on global warming of 1.5°C .......................................................................................... 10
    1.2 Climate preparedness – adaptation to climate change ..................................................................................................................... 12
    1.3 Global responsibility and opportunities for a sustainable future ................................................................................................ 14

    2. Climate action goals and instruments ..................................................................................................................... 16
    2.1 International climate policy .......................................................................................................................................................................... 17
    2.2 European climate policy .................................................................................................................................................................................. 19
    2.3 German climate policy ...................................................................................................................................................................... 23

    3. Emission trends and areas of action in the sectors ........................................................................................ 26
    3.1     Emissions in Germany – past, present and future ............................................................................................................................... 27
    3.2     Energy sector ........................................................................................................................................................................................ 28
    3.3     Industry .................................................................................................................................................................................................. 32
    3.4     Waste and recycling management .............................................................................................................................................................. 35
    3.5     Transport ................................................................................................................................................................................................ 37
    3.6     Buildings ................................................................................................................................................................................................ 41
    3.7     Agriculture ............................................................................................................................................................................................. 43
    3.8     Land use, land use change and forestry (LULUCF) .............................................................................................................................. 46

    4. Towards a greenhouse gas neutral society ............................................................................................................ 48
    4.1     Enterprise and innovation ............................................................................................................................................................... 49
    4.2     Jobs and structural change ............................................................................................................................................................................. 50
    4.3     Creating sustainable infrastructures .......................................................................................................................................................... 52
    4.4     Sustainable consumption ................................................................................................................................................................. 53
    4.5     Sustainable finance ............................................................................................................................................................................. 55

    5. Glossary ...................................................................................................................................................................57

    6. Abbreviations .......................................................................................................................................................60

    7. Endnotes .................................................................................................................................................................62

    8. Bibliography ..........................................................................................................................................................64

    9. Data appendix ......................................................................................................................................................66
FOREWORD | CLIMATE ACTION IN FIGURES 5
companies and industry associations are addressing
climate change and recognising that ambitious climate
action is a driver of innovation, while unchecked
climate change represents a growing threat to humans,
capital and infrastructures. To facilitate implemen-
tation of the Climate Action Plan, we have under-
pinned it with programmes of measures. The Christian
Democratic Union (CDU), Christian Social Union (CSU)
and Social Democratic Party of Germany (SPD) have
furthermore agreed to adopt a climate change act dur-
ing this legislative period. By establishing the Climate
Cabinet, which met in April 2019 for the first time, the
Federal Chancellor made it clear that climate action is
a high-level, priority issue.
In my view it is vital that we bring everybody in this
Foreword country on board. We can do that by shaping climate
policy together in dialogue. The work of the Commis-
sion on Growth, Structural Change and Employment
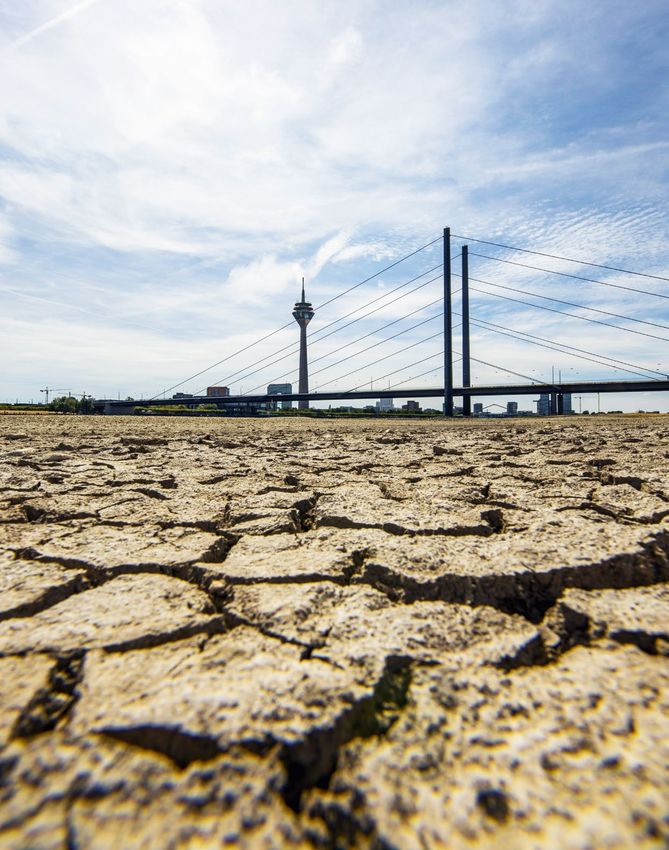
The extremely hot summer of 2018 showed us that, was a good example of how this can be done effective-
in Germany too, climate change is already a reality. ly. The commission’s recommendations pointed the
With a view to achieving international and European way towards a gradual phase-out of coal-based power,
climate targets, the German government wants to play while also developing prospects for the people in the
an active part in mapping the route to a greenhouse regions affected.
gas neutral society. We want to secure a liveable world
for future generations. Facts and figures are an important basis for political
decision-making. The annual data on developments in
The 24th United Nations Climate Change Conference greenhouse gas emissions act as a compass by which
(COP24) in Katowice in 2018 adopted a rulebook for to steer our climate policy. Each year, we make these
implementing the Paris Agreement. We now have the figures and a range of other climate data available to
first minimum standards for reporting greenhouse gas the public in our brochure Climate Action in Figures.
emissions that are binding for all parties. Previously, The 2019 edition presents and explains all the latest
only developed countries were subject to these rules. climate information and gives an overview of Ger
This is an important step for lowering global green- many’s comprehensive climate policy.
house emissions. Within Europe, reforms have signif-
icantly strengthened the emissions trading system, I hope you find Climate Action in Figures both enjoy
a key instrument. Moreover, in 2018 the European able and informative.
Commission presented its strategic long-term vision
for a climate-neutral Europe. Germany adopted its own Svenja Schulze
strategy, the Climate Action Plan 2050, in 2016. This is
geared to the global principal of greenhouse gas neu-
trality and to achieving the European climate targets.
The Climate Action Plan 2050 provides guidance for
the transition to a greenhouse gas neutral economy
and society, but does not specify all the details and ac-
knowledges the need to consider future developments. Federal Minister for the Environment, Nature Conser-
We must also bear in mind the impacts our climate vation and Nuclear Safety
policy may have on social structures and the econo-
my. I find it most encouraging that more and more
6 CLIMATE ACTION IN FIGURES | 1. WHY IS GERMANY COMMITTED TO AN ACTIVE CLIMATE POLICY?
1. Why is Germany committed to an active
climate policy?
Summary
Since the beginning of industrialisation, the global In 2018, annual per capita carbon dioxide (CO2) emis-
mean temperature has risen by around 1°C because of sions in Germany, at around 9.6 tonnes, were still about
climate change. Every decade, the earth is warming by twice the international average of 4.8 tonnes per capita.
0.2°C as a result of climate change caused by humans.
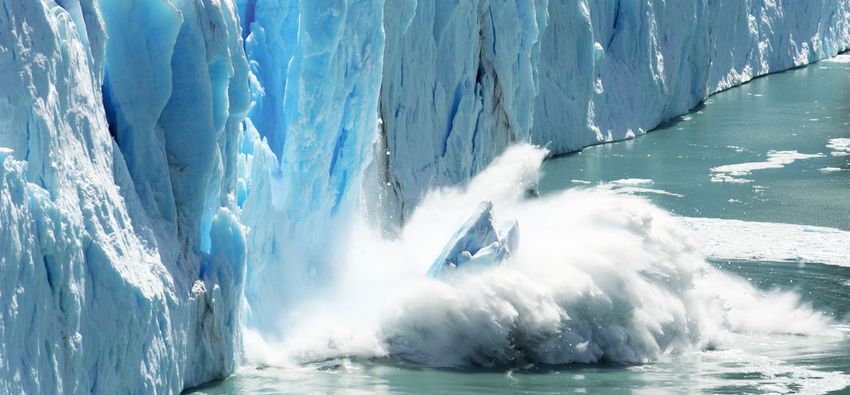
The Intergovernmental Panel on Climate Change Germany is being increasingly affected by the impacts
(IPCC) warns that global warming of more than 2°C of climate change. The average temperature in Ger
by 2100 compared to pre-industrial levels can have many has risen by 1.5°C, far more than the global
serious consequences. Unless harmful greenhouse gas average. The impacts of climate change are expected
emissions are restricted, the global mean temperature to intensify in the future, and further action will be
is likely to rise by more than 3°C. The negative con- needed to adapt to climate change. Germany therefore
sequences of climate change include more frequent passed the German Climate Change Adaptation Strat
droughts, rising sea levels and a loss of biodiversity. egy (DAS) in 2008. The European Union (EU) adopted a
As one of the world’s largest economies, Germany has strategy on adaptation to climate change in 2013.
contributed almost five per cent to global warming
since the dawn of industrialisation.1.1 CLIMATE CHANGE – CAUSES AND CONSEQUENCES | CLIMATE ACTION IN FIGURES 7
i
1.1 Climate change –
causes and consequences How greenhouse gases are formed4
Climate change is one of the greatest challenges fac C ==
O
O Carbon dioxide (CO2) is an odourless
ing humankind. The anthropogenic greenhouse effect and colourless gas that persists in the
is causing the earth’s atmosphere to warm faster than atmosphere for an average of 120 years.
ever before, with many irreversible impacts on people It is produced mainly as a by-product of
and the environment. Since the start of industrialisa- burning fossil fuels such as coal, oil and
tion, the global mean temperature has risen by around gas. In recent years, there has been an
1°C. Human activities producing greenhouse gas increase in the use of wood for fuel, which
emissions are primarily responsible for this increase. also produces high CO2 emissions. This is
The most significant greenhouse gas is CO2, which is not reported in the energy sector, however,
formed mainly when fossil fuels are burned. Since 1850, as the emissions are counted when the
the global atmospheric CO2 concentration has risen wood is harvested in the forest. Particularly
by 44 per cent compared to the previous 10,000 years.1 in the tropics, deforestation and slash-and-
Industrialised countries like Germany have particularly burn agriculture are highly significant,
high average per capita greenhouse gas emissions (see since forests store up to 70 per cent of the
also Figure 05 in Section 1.3). CO2 on earth.
Without additional measures to combat climate H– –H
C
H– –H Methane (CH4) is formed when organic
change, it is likely that the global temperature will matter breaks down anaerobically (without
rise by more than 3°C. This would have drastic con- air). This occurs in agriculture and forestry,
sequences; for example, coastal regions and island na- and in the stomachs of animals. Sewage
tions could be flooded. Even if the temperature rises treatment plants and landfills are another
by between 1.5 and 2°C, the impacts of climate change source. Methane is around 25 times more
will be clearly felt (see Spotlight). For example, record potent as a greenhouse gas than CO2.
temperatures are already occurring globally five times
more frequently than would be expected without N –=
O
O- Nitrous oxide (N2O) only occurs at trace
climate change.2 The impacts of climate change vary levels in the atmosphere but is 298 times
by region. In some regions – such as the Arctic – the stronger as a greenhouse gas than CO2.
observed temperature increase to date is two to three Nitrous oxide enters the atmosphere via
times higher than the global average of around 1.5°C nitrogen fertilisers and intensive livestock
(Figure 02).3 Progressive warming has been accom- farming as well as chemical processes in
panied by an increase in the strength and frequency industry.
of extreme weather events. Tropical cyclones are be-
coming stronger because of global warming. The rise –F
N –– F
F Fluorinated gases (hydrofluorocarbons
in sea levels continues to accelerate globally, while (HFCs), perfluorocarbons (PFCs), SF6 and
high mountain glaciers are melting, leading to water NF3) are synthetic gases that are used as
shortages in the surrounding regions. More and more propellants, refrigerants or solvents. The
people could be forced to leave their homes because proportion of F-gases in emissions in Ger-
of climate change. many is low, but their greenhouse effect is
100 to 24,000 times stronger than CO2, due
Figure 02 shows the temperature trend from 1880 to in part to their extremely long persistence
2018 and the deviation from the historical frame of in the atmosphere.
reference in Germany. Compared to pre-industrial
levels, the annual mean temperature has risen by
1.5°C. For this comparison, climate scientists usually
take 1880 as the reference year or the period 1850 to
1900 as the historical frame of reference, as this is8 CLIMATE ACTION IN FIGURES | 1.1 CLIMATE CHANGE – CAUSES AND CONSEQUENCES
reference value of 8.2°C for the annual mean tempera
Figure 01: Shares of greenhouse gases in ture in Germany.
Germany in 2017 in CO2 equivalents
Germany is being increasingly affected by the im
pacts of climate change. In Germany, the main risks
88 % Carbon are extreme heat and droughts, heavy rainfall and re-
dioxide
sulting floods. The cold periods in winter are becoming
shorter, while summer heat waves are happening more
often. The latter are dangerous mainly to the elder-
6 % Methane
ly, people with pre-existing medical conditions, and
4 % Nitrous oxide
children. In large cities, heat builds up more because
2 % Fluorinated
gases of the high level of surface sealing and high density of
buildings.
Changes in the climate have direct impacts on vari
ous sectors of the economy. In 2018, agriculture was
Source: UBA (2019a) particularly hard hit by extreme climate events. The
impacts were also felt in other areas; for example, there
were limitations on shipping on German rivers.
Climate change can upset the balance of native
the earliest period for which sufficient temperature ecosystems. Higher temperatures and changes in
observations are available. Temperature variations are seasonal weather patterns affect the composition
shown together with multi-year average values for of species communities. Between 5 and 30 per cent
comparison. The graph is based on the internationally of native species in Germany could be lost over the
applicable reference period of 1961 to 1990 with a coming decades because they are unable to adapt
Figure 02: Temperature trend and deviations in Germany since 1880
2
Temperature deviation [°C]
1
0 + 1.5°C
-1
-2
1880 1910 1940 1970 2000
Source: DWD (2019)1.1 CLIMATE CHANGE – CAUSES AND CONSEQUENCES | CLIMATE ACTION IN FIGURES 9
0.2°C
Anthropogenic climate animal and plant species that are not originally native
change is currently cau- to Germany may be a threat to human health and cause
sing the earth to warm high economic costs.
by 0.2°C per decade.
“2018 was the year of climate change.”
to changing environmental conditions. Climate Andreas Friedrich, Press Spokesman,
change-induced temperature effects are a particular German Meteorological Service (DWD)
threat to cold-water fish and crab species as well as
yellow-bellied toads and sedgelings, whose habitats
depend on moist conditions. Conversely, the spread of
i
Another year of extreme weather cent.5 Low water levels on the Rhine meant that
power stations had to cut their output, otherwise
With an average temperature of 10.5 °C, 2018 was the cooling water would have raised the tem-
the warmest and sunniest year in Germany since perature of the river. Cargo ships had to sail with
weather records began. In Frankfurt am Main, for reduced loads, leading to raw material shortages.
example, thermometers passed the 30°C mark on Industrial firms had to cut back production, and
19 consecutive days in the summer of 2018. Thir- there were supply bottlenecks at filling stations.
teen “tropical nights” were recorded too, where
the temperature did not fall below 20 °C. Across Climate change does not mean that every
Germany there were 74 summer days with tem- summer from now on will be so hot. But there
peratures over 25 °C. That is 12 more days than in is a greater probability of extreme heat events
the record summer of 2003. 2018 was also one of in summer. Almost every year since the turn of
the lowest rainfall years since 1881. Precipitation the millennium has been warmer than previous
in Germany in 2018 was only around 60 per cent decades, often accompanied by unusually high
of the usual level. or low precipitation volumes. The number of ex-
treme weather events in Germany has more than
April to November were exceptionally dry tripled in the past 50 years.
months, bringing extreme drought to some areas.
In the agriculture sector, this resulted in region-
al potato and cereal yield losses of up to 75 per10 CLIMATE ACTION IN FIGURES | SPOTLIGHT 2019
Without further action, the global temperature
SPOTLIGHT 2019: increase will reach 1.5°C between 2030 and 2052.
Compared to pre-industrial levels, the increase in the
IPCC special report global mean temperature due to human activity is al-
ready around 1°C. Many changes in the climate system
on global warming of 1.5°C have been demonstrated, including more frequent
The IPCC compiles the world’s latest knowledge extreme weather events and rising sea levels. Limiting
on climate change. Under the auspices of the United global warming to 1.5°C requires a radical reduction in
Nations, the IPCC produces state of knowledge and greenhouse gas emissions. From the middle of the cen-
special reports at regular intervals. For these reports, tury, no more greenhouse gases should be emitted than
hundreds of scientists from around the world evaluate can be absorbed (zero net emissions). Achieving this
the available studies. IPCC reports reflect the interna- goal will require rapid and far-reaching changes in all
tionally acknowledged current state of climate change sectors over the decades ahead. By 2030, anthropogenic
research. The IPCC was established in 1988 by the Unit- CO2 emissions will have to be cut by around 45 per cent
ed Nations Environment Programme and the World compared to 2010 levels.
Meteorological Organization.
The climate action that has been planned so far is not
The October 2018 IPCC special report on global sufficient to meet the goals of the Paris Agreement.
warming of 1.5°C serves as the scientific basis for the Even if countries around the world implemented the
risk assessment of global warming of 1.5°C. With the climate actions they have announced to date, global
signing of the Paris Agreement in 2015, the IPCC was warming would still exceed 2°C. So there is a need for
asked to present a special report on the impacts of additional systematic and comprehensive reduction
global warming by 1.5°C compared to pre-industrial activities in all sectors. The special report also high-
levels and the associated greenhouse gas emission lights the need to recapture CO2 that has already been
paths. Scientists from more than 44 countries evaluated emitted. Ecosystem-based methods such as reforesta-
over 6,000 studies for the report. Formally adopted by tion are discussed along with technological solutions,
the Member States in 2018, the special report serves as such as separating and storing airborne carbon. How-
a basis for assessing the climate action efforts agreed ever, a lot of research remains to be done regarding
so far by members of the United Nations Framework the total potential, costs and risks of CO2 capture and
Convention on Climate Change (UNFCCC). The special storage.
report therefore also provides a framework for the
global climate policy debate.
“Everything we do from now on matters. If we
Considerable climate impacts already occur with can cut global CO2 emissions by 45 per cent
global warming of 1.5°C. The special report shows that by 2030 compared to 2010, we are probably
the risks of climate change to humans and nature are in a good position to limit global warming to
even greater than was previously thought. Even if glo 1.5°C.” Hoesung Lee, Chair of the IPCC
bal warming is limited to 1.5°C, there will be a marked
increase in extreme events such as heat waves, heavy
rains and droughts in some regions. Sensitive ecosys- The special report also discusses the tensions between
tems like tropical coral reefs are particularly threatened climate action and poverty, or possible synergies and
by rising temperatures. Compared to global warming conflicts with the United Nations, including Sustain-
of 2°C, the expected impacts of a 1.5°C temperature able Development Goals. For example, the number of
increase are generally less severe. Furthermore, above people who are both exposed to climate-related risks
1.5°C it is possible that the climate system will reach and at risk of poverty is several hundred million lower
tipping points. Figure 03 compares the consequences of with global warming of 1.5°C by 2050 than with a 2°C
a 1.5°C rise in temperature with a 2°C rise. rise in temperature.SPOTLIGHT 2019 | CLIMATE ACTION IN FIGURES 11
Figure 03: Comparison of selected climate impacts given a 1.5°C or 2°C rise in global mean tempera-
ture compared to pre-industrial levels
Temperature in- Temperature
Aspect Consequences
crease of 1.5°C increase of 2°C
Additional urban population exposed to Around 350 ± Around 411 ±
Drought
severe drought 159 million 214 million
Increase in population affected by fluvial
Freshwater Fluvial flood 100 % 170 %
floods (compared to 1976 to 2005)
Insects losing more than half of their
Around 6 % Around 18 %
habitat (percentage)
Terrestrial Plants losing more than half of their habitat
Biodiversity loss Around 8 % Around 16 %
ecosystems (percentage)
Vertebrates losing more than half of their
Around 4 % Around 8 %
habitat (percentage)
By up to Around 10 cm
Rising sea levels Rise by 2100 around 1 m* higher than for
1.5°C*
Sea ice free About every About every 10
Frequency
Arctic summers 100 years years
Ocean
Loss of tropical
Percentage lost 70 to 90 % Over 99 %
coral reefs
Declining fish Around 1.5 mil Over 3 million
Fall in annual sea fishery yields
stocks lion tonnes tonnes
Number of people affected Around 128 to Around 141 to
Consequences of (without flood defences) 143 million 151 million
rising sea levels
and increased
Coastal areas storminess Number of people affected Annually around Annually around
(with flood defences of 1995) 2 to 28 million 15 to 52 million
* The instability of the polar ice sheets could result in an additional rise in sea levels by several metres over a period of hundreds
to thousands of years.
Source: own chart based on IPCC special report on global warming of 1.5°C12 CLIMATE ACTION IN FIGURES | 1.2 CLIMATE PREPAREDNESS – ADAPTATION TO CLIMATE CHANGE
outweighing the many negative impacts of climate
1.2 Climate preparedness – change.
adaptation to climate change
Adapting to climate change in time will result in lower
Because the impacts of climate change will continue overall costs. It is also important to realise that the
to intensify in the future, there is an increasing focus greater the increase in global mean temperature, the
on taking action to adapt to climate change. Climate higher the costs of damage and adaptation will be. The
policy pursues two main goals. Firstly, greenhouse need to adapt to the consequences of climate change
gas emissions should be limited to prevent the global was recognised early on. In the 1990s, the international
mean temperature rising by more than 2°C. Secondly, community adopted a framework for climate adapta-
adaptation to climate change is about anticipating tion – the UNFCCC. Financing adaptation measures was
and taking appropriate steps to prepare for and made part of the Paris Agreement. The Adaptation Fund
mitigate the impacts of climate change. Adapting to is used in particular to benefit vulnerable island nations
climate change means becoming resilient and capable and developing countries. In 2013, the EU adopted a
of transformation. Certain positive effects of climate strategy on adaptation to climate change to increase the
change (such as reduced heating demand in some resilience of EU countries, regions and cities.
areas due to milder winters) do not come close to
Figure 04: Challenges in Germany in terms of vulnerability to threat types and regions
Rising sea levels, increased swells, elevated risk
Increased heat stress
of storm tides
Adaptation measures: create green corridors in cities, Adaptation measures: improve forecasts for climate,
provide a heat wave warning system for vulnerable groups, extreme weather and floods, raise flood defences..
improve drinking water availability during hot periods.
Where: coastal areas.
Where: urban areas in the warmer regions of Germany, such
as Berlin, Cologne, Frankfurt am Main
(will continue to expand). Heavy rain and flash floods
Adaptation measures: climate-resilient infrastructure,
Elevated forest fire risk
optimisation of dams, reservoirs and detention basins.
Adaptation measures: create suitable mixed forests, forest Where: urban centres in the lowlands of north-western
fire prevention, effective forest fire fighting. Germany, low mountain ranges and south-western Germany.
Where: regions with extensive woodland and forest man-
agement in eastern Germany and low mountain ranges. Impairment of water use due to increasing
warming
Adaptation measures: reduce water extraction by energy
Change in species composition and natural sector and industry.
developmental stages
Where: regions with hot and dry climates in eastern
Adaptation measures: habitat optimisation for endangered Germany and the Rhine catchment area.
species, afforestation, systematic attention to climate
functions of soil.
Where: seas and rural areas. River floods
Adaptation measures: renaturation of watercourses and
alluvial plains, create detention basins and infiltration areas.
Where: urban areas in river valleys of the lowlands of
Source: Federal Government (2015) northern Germany, as well as catchment areas of the Rhine
and Danube.1.2 CLIMATE PREPAREDNESS – ADAPTATION TO CLIMATE CHANGE | CLIMATE ACTION IN FIGURES 13
The DAS was passed in 2008. It defines the key goals dictions of the geographical distribution of negative
and options for adaptation; specific measures were set impacts are important so that economic and social
out in the 2011 Adaptation Action Plan I (APA I) and harm can be prevented through adequate preparation.
in 2015 in the first DAS progress report.6 These meas- In the first instance, action to mitigate climate change
ures cover different policy areas, such as transport, should take place where Germany is particularly vul-
construction and health, and range from funding nerable to and affected by climate change (Figure 04).
mechanisms and research activities to legislative Adaptation measures are therefore implemented
provisions. With the first DAS progress report, climate primarily at local or regional level.
change was recognised as a permanent task for the
Federal Government, and an ongoing climate adapta-
tion reporting system was established. The first DAS
evaluation report will be published in 2019.
The Federal Government supports research on im-
proving weather models and gaining better data on
climate change impacts and adaptation. Detailed pre-
i
German Climate Preparedness Portal socio-economic scenarios, demographic change)
and incorporated into risk and vulnerability ana
Climate preparedness requires a fact-based lyses. In this way, it is possible to assess which
understanding of climate change and the best sectors and regions are particularly affected. For
possible predictions of climate change impacts. example, urban planners can use temperature and
Cooperation by businesses, planners at munici- precipitation data, land-use plans and population
pal and state level, and the public at large is also trend data to predict locations where extreme heat
important. This is where the Federal Government’s or heavy rain could become dangerous for people
Climate Preparedness Portal comes in. The portal and infrastructures. Then they can implement
catalogues quality-assured climate preparedness counter-measures. By doing this, they are support-
services that provide climate data and information, ing climate adaptation services.
for example, as well as adaptation services to help
manage climate impacts. The services are targeted Climate adaptation services show how municipali-
at the national level as well as at the Federal States, ties, associations or businesses are factoring climate
districts and municipalities that are dealing with impacts into their decisions and planning, and
and preparing for the individual impacts of climate what adaptation measures they can implement.
change, for example in the context of action pro- By providing guides, web tools, maps or training
grammes or adaptation strategies. Many services opportunities, climate adaptation services assist in
are also suitable for civil society, businesses and selecting, planning and implementing measures,
private citizens. and evaluating their effectiveness.
For more information about the Climate Prepa-
Climate information comprises meteorological redness Portal, visit www.klivoportal.de
and climatological data including temperature,
precipitation, wind, soil moisture and sea tem-
perature. This data and information about the
climate system in the past, present and future
can be combined with other information (such as14 CLIMATE ACTION IN FIGURES | 1.3 GLOBAL RESPONSIBILITY AND OPPORTUNITIES FOR A SUSTAINABLE FUTURE
1.3 Global responsibility therefore has a special responsibility to combat cli-
mate change.
and opportunities for a
In recent decades, emissions have grown mainly in
sustainable future the burgeoning economies of the emerging coun
tries. China has emitted more greenhouse gases than
Industrialised countries bear special responsibility the United States since 2005 and currently continues
for climate change. Since the start of industrial to occupy top place among the biggest greenhouse gas
isation, Germany has emitted almost five per cent of emitters, with 11 billion tonnes of CO2 equivalents.
global greenhouse emissions.7 Given the threatening It should be noted that annual per capita emissions in
impacts on people and the environment, Germany developing and emerging economies are much lower
Figure 05: Global greenhouse gas emissions
45
Emissions in gigatonnes of CO2 equivalents
40
Rest of world
35
30 Brazil
India
25 Germany
Russia
20
China
15
10 EU28
(excluding Germany)
5
US
0
1850 1870 1890 1910 1930 1950 1970 1990 2010
Individual data points can be found in the table in the appendix on page 66.
Shares of historical total emissions Greenhouse gas emissions 2016
24.0 % US 26.9 % China
15.1 % EU28 (excluding 13.9 % US
Germany)
7.3 % EU28 (excluding
11.8 % China Germany)
7.7 % Russia 6.1 % India
4.7 % Germany 5.7 % Russia
4.1 % India
2.2 % Brazil
1.6 % Brazil
1.9 % Germany
30.9 % Rest of world
36.0 % Rest of world
Source: PIK (2019)1.3 GLOBAL RESPONSIBILITY AND OPPORTUNITIES FOR A SUSTAINABLE FUTURE | CLIMATE ACTION IN FIGURES 15
Figure 06: Per capita CO2 emissions in selected regions by share of global population in 2017
18
Tonnes of CO2 per capita
16
US and Canada 4.8 %
14
12 Russia 1.9 %
Australia and Oceania 0.5 %
10
Germany 1.1 %
Middle East 4.3 %
8
EU28* (excluding Germany) 5.8 %
6
Global average: 4.8 tonnes of CO2 per capita
4 Rest of Europe 1.1 %
China 19.1 %
North Africa 3.3 %
2 Asia (without Latin
China and India) America** Sub-Saharan
18.3 % 8.8 % India 17.8 % Africa 13.2 %
0
Percentage of global population 100 %
* Including Monaco, San Marino, Andorra ** Including the Caribbean
Breakdown according to UN Statistics Division
Source: own graph based on EDGAR (2018)
than in industrialised economies. In Germany, per cap- Numerous international energy dialogues and part-
ita CO2 emissions are around 20 per cent higher than nerships with countries such as China and India are
in China, around five times higher than in India, and already facilitating experience sharing and helping to
roughly twice the global average (Figure 06). promote a sustainable global energy supply.
With its Climate Action Plan 2050, Germany is one of
3°C
the first countries to put forward a long-term strategy The earth would experience
with sector-specific targets. The plan identifies ways warming of 3°C by the end
in which all sectors can be almost completely decar- of this century if every sig-
bonised by 2050. Section 2.3 presents further details on natory country to the Paris
Germany’s climate policy. Agreement implemented its
national contributions. The
Successful implementation of climate targets in parties to the agreement
Germany sets an important example. If Germany – an therefore need to take more
economically powerful and prosperous country – can climate action to achieve
take successful climate action, it sends a strong signal to the goals agreed on in Paris.
other industrialised as well as developing and emerging
countries. Their commitment to climate action is
essential so that global warming can be limited.16 CLIMATE ACTION IN FIGURES | 2. CLIMATE ACTION GOALS AND INSTRUMENTS
2. Climate action goals and instruments
Summary
With the goal of limiting climate change, 184 countries Germany defined its own climate milestones in the
and the EU have ratified the Paris Agreement. Under Climate Action Plan 2050. It identifies ways that
the UNFCCC, the international community made a Germany can become largely greenhouse gas neutral
commitment in 2015 to limit global warming to well by the middle of the century. By 2050, the share of re-
below 2°C and preferably to less than 1.5°C compared newable energy sources in final energy consumption
to pre-industrial levels. is to be increased to 60 per cent, and primary energy
consumption is to be cut by 50 per cent compared to
As a contribution to the Paris Agreement, the EU 2008.
Member States have undertaken to jointly reduce
greenhouse gas emissions by at least 40 per cent by The Climate Action Plan 2050 also specifies targets
2030 compared to 1990. The EU is working to develop for the individual sectors for the first time. To cut
its climate and energy policy to reach this goal. greenhouse gas emissions by at least 55 per cent in all
economic sectors by 2030 compared to 1990, target
By 2050, EU-wide greenhouse gas emissions are to be corridors for 2030 were agreed for the sectors.
reduced by 80 to 95 per cent compared to 1990.2.1 INTERNATIONAL CLIMATE POLICY | CLIMATE ACTION IN FIGURES 17
The fight against climate change will continue to
2.1 International require a coordinated approach by all countries. The
climate policy 185 parties to ratify the Paris Agreement to date 8 have
so far submitted 183 NDCs.9 At present only seven
The UNFCCC forms the basis for international countries have set climate targets in their NDCs that
climate diplomacy. Adopted in 1992, the goal of the are compatible with the 2°C upper limit in the Paris
treaty is to stabilise global greenhouse gas emissions Agreement.10 If the parties stick with and implement
at a level that prevents dangerous climate change. One their current commitments, global warming is ex-
hundred ninety-six countries and the EU – nearly all pected to reach 3°C.11 More climate action is there-
countries in the world – have ratified the UNFCCC. fore required to close the gap between the necessary
This means they have undertaken to report regularly emissions reductions and those currently planned
on their greenhouse gas emissions and take climate (Figure 07). At the 24th Climate Change Conference in
action. Since 1995, conferences of the signatory states the Polish city of Katowice, the parties agreed a com-
have taken place in various host countries – these have mon rulebook on implementing the Paris Agreement,
been referred to as UN Climate Change Conferences or which is now binding on all countries for the first
Conferences of the Parties (COP). time. It particularly relates to international report-
ing on emissions and climate action. Under the Paris
The Kyoto Protocol, adopted in 1997, marked the first Agreement, new or revised NDCs are to be submitted
time that legally binding greenhouse gas reduction in 2020. Apart from the international Climate Change
targets were agreed. In the first phase of the treaty, Conferences, climate action is an important theme at
some industrialised nations – including all EU Member the regular summits of the major industrialised and
States – made a commitment to cut their greenhouse emerging powers. Nearly all the G20 countries recently
gas emissions by 2008. The continuation of the Kyoto reaffirmed their approach to tackling climate change
Protocol in a second phase envisages that the partici- under the German G20 presidency in 2017 and in
pating industrialised countries will lower their emis- Buenos Aires in 2018.
sions by an average of 18 per cent by 2020 compared to
1990 levels. For this same period, the EU committed to Climate finance plays a key role in implementing
a 20 per cent cut in greenhouse emissions. Germany set climate policy. As a responsible partner, Germany
itself a voluntary goal of reducing emissions by 40 per helps developing and emerging countries finance
cent in this timeframe. and implement climate action and climate change
adaptation measures. In 2017, Germany made budget
The Paris Agreement aims to limit global warming funding of around 3.65 billion euros available for in-
by the end of this century to well below 2°C and ternational climate financing.12 Since 2005, the Federal
preferably to 1.5°C. It envisages achieving global Government has increased its financial contribution
greenhouse gas neutrality in the second half of this to climate action and adaptation almost eightfold.
century. One hundred ninety-six countries have Germany also makes additional contributions through
agreed on coordinated cooperation to combat global public sector loans and by mobilising private fund-
climate change. Whereas the Kyoto Protocol mainly ing. In 2017, the German development bank KfW
applies to industrialised countries, the Paris Agree- together with the German investment corporation
ment represents the first time that a commitment has (Deutsche Investitions- und Entwicklungsgesellschaft)
been made by all countries. All signatory states are pledged 3.08 billion euros of financing from capital
required to set their own Nationally Determined Con- market funds. Germany’s commitment contributes
tributions (NDCs) to reducing greenhouse gases by to the industrialised countries’ goal of providing and
2020. Together with its Member States, the EU worked
out an NDC that aims to cut EU-wide greenhouse gas
emissions by at least 40 per cent by 2030 compared
to 1990 levels. Germany therefore did not agree its
own national contribution under the treaty, but has
1.5°C To reach the 1.5°C
goal, global net CO2
emissions have to fall
instead made a commitment to international climate to zero by around
action via the EU’s contribution. 2050.1318 CLIMATE ACTION IN FIGURES | 2.1 INTERNATIONAL CLIMATE POLICY
Abbildung 07: Ambitionslücke zwischen Pariser Abkommen und aktuellen NDCs der Vertragsstaaten
+ 3 °C + 3 °C + 3 °C Erwartete Erd-
erwärmung bei
Umsetzung der
+ 2 °C + 2 °C + 2 °C aktuell festgeleg-
Zielkorridor des ten nationalen-
+ 1,5 °C Pariser Überein- Beiträge (NDCs)
+ 1 °C Bereits erfolgte + 1 °C kommens + 1 °C
Erderwärmung
bis 2018
Durchschnittstemperatur
vor Beginn der Industriali-
Globale Globale sierung
Globale
Erderwär- Erderwär-
Erderwär-
mung bis mung bis
mung
2100 2100
Quelle: Eigene Darstellung nach Navigant, New Climate Institute, Climate Analytics (2018)
mobilising 100 billion dollars annually from public aims to stimulate specific reform and transformation
and private sources for climate action and adapta- processes in the partner countries and give impetus to
tion in developing countries from 2020 onwards. In international climate negotiations. One main focus is on
addition, Germany is committed to implementing the helping the partner countries implement their NDCs.
long-term goal laid down in the Paris Agreement of For example, there are projects that support solar roof
directing global financial flows towards low-carbon installation in Mexico, sustainable mobility initiatives
and climate-resilient development. in major Indian cities and forest preservation in Pacific
island states. The IKI also supports climate change adap-
tation projects such as innovative agricultural insurance
“We need to do more, and we need products in Ghana.
more ambition.” António Guterres,
UN Secretary-General Another portion of the financing for climate action
is provided via multilateral organisations to facilitate
comprehensive programmes in developing and emerg-
More than four fifths of climate finance flows into di- ing countries. The Federal Government pays contribu-
rect cooperation with developing and emerging coun- tions into international funds and facilities, such as the
tries, particularly via the Federal Ministry for Economic Green Climate Fund, the Adaptation Fund and the Global
Cooperation and Development. Another important Environmental Facility for this purpose.
instrument is the International Climate Initiative (IKI)
of the Federal Ministry for the Environment, Nature
Conservation and Nuclear Safety (BMU).
The IKI has supported climate action in developing
and emerging countries since 2008. Almost 700 pro-
jects with a financing volume of 3.3 billion euros have
been started since the initiative was launched. The IKI2.2 EUROPEAN CLIMATE POLICY | CLIMATE ACTION IN FIGURES 19
i 2.2 European
Climate change and migration climate policy
Migration has many causes, such as The EU pursues a common climate policy in consul
poverty, a lack of educational opportun tation with its Member States. The EU is one of the
ities, political persecution and violent driving forces in international climate negotiations.
conflicts. Climate change is increasingly In its NDC, it has made a commitment to cut green-
becoming another reason for migration. house gas emissions by at least 40 per cent by 2030
Heat, droughts, floods and other weather compared to 1990. To facilitate long-term planning
extremes affect food production, health and provide more reliable guidance for businesses and
and working conditions. Livelihoods that society, the European Commission unveiled its vision
depend on climate-sensitive agriculture of “A Clean Planet for All” at the end of 2018, with a
are especially at risk. People in developing transition to greenhouse gas neutrality by 2050. By
countries have greater difficulty adjusting 2020, the EU and all other parties are asked to present
to the impacts of climate change when a long-term climate strategy to implement the Paris
the necessary infrastructure and finan- Agreement.
cial resources are lacking. Climate change
exacerbates social inequalities, brings a risk
of violent conflicts and leads to increased “The aim of the EU should be to achieve
migration movements. climate neutrality by 2050. There is no way
around it.” Miguel Arias Cañete, European
People are already leaving their homes Commissioner for Climate Action and Energy
because of climate change. In 2017, around
18 million people worldwide had to seek
shelter from extreme weather events at The EU Emissions Trading System (EU ETS) is a key
another location within their own coun- climate action instrument. It compels the energy
try.14 By 2050, climate change could force sector, energy-intensive industry and, since 2012,
more than 140 million people in sub-Saha- aviation in the EU to pay to emit greenhouse gases.
ran Africa, South Asia and Latin America Companies are required to purchase tradeable emis-
to resettle inside their national borders.15 sion allowances (also known as certificates or “carbon
Climate change will increase internati- credits”). The volume of allowances available on the
onal migration pressure towards Euro- market is limited in line with the EU’s long-term
pe, although exact numbers are hard to climate and energy goals. To make their contribution,
estimate. Global climate policy and adapta- sectors covered by the EU ETS have to cut their emis-
tion measures will help to improve clima- sions by 43 per cent by 2030 compared to 2005. Since
te-dependent living conditions. Severely 2013, N2O and PFCs have been included in emissions
affected countries often need international trading along with CO2. In its original form, howev-
financial assistance to deal with climate-re- er, the EU ETS did not achieve the desired pricing
lated damage. effect. A growing surplus of emission allowances was
due mainly to an overly generous initial issue of the
carbon credits, the economic crisis and purchases of
cheaper allowances from other countries. As a result,
the price of EU emission allowances, and hence the
incentive to reduce emissions, has been persistently
low in recent years.
Reform of the EU ETS in February 2018 gave a boost to
emissions trading in the EU. With the introduction of a
Market Stability Reserve, surplus emission allowances20 CLIMATE ACTION IN FIGURES | 2.2 EUROPEAN CLIMATE POLICY
will gradually be transferred to a reserve from 2019 The announcement of the reform caused the price
onwards. From 2023, the maximum volume of this of EU emission allowances to triple from an average
reserve will be limited, with the result that any remain- of 5 euros per tonne of CO2 in 2017 to 15 euros in
ing allowances will be permanently removed from the 2018.16 At the beginning of 2019, the price for emission
market. allowances stood at more than 25 euros per tonne of
CO2.17 Because of the higher allowance prices, modern
Making the freely available emission allowances low-emission gas and steam power plants have in
more scarce should strengthen the price signal of many cases become more competitive again since 2017
emissions trading in the long term. Another reform compared to hard coal power stations.18
element is the new possibility for Member States to
cancel allowances in the event of additional national
measures to shut down power generating capacities.
i
Carbon pricing and Japan, have introduced emissions trading
schemes.19
Economic incentives are one way of reducing
greenhouse gas emissions. Carbon pricing means A carbon tax can be implemented as an alterna-
market participants face additional costs depend- tive or in addition to emissions trading. Emis-
ing on their greenhouse gas emissions. Pricing sions of particular greenhouse gases are taxed at
the emissions internalises the costs of harm, a fixed rate, often with an escalator mechanism.
following the “emitter pays” principle. Despite Unlike emissions trading, where the market
the additional cost burden, businesses and influences the price, the price of emissions under
governments increasingly support the principle a carbon tax is set by policymakers. The United
of making businesses pay to emit greenhouse Kingdom, Estonia, Latvia, Portugal, Slovenia,
gases. There are two main instruments for pricing Spain, Ireland, France, Finland, Sweden, Denmark,
greenhouse gas emissions: emissions trading and Poland, Norway, Switzerland, Ukraine, Iceland,
carbon taxes. Liechtenstein, Colombia, Mexico, Chile, Japan,
South Africa, Argentina and Singapore, as well
Emissions trading works on the “cap and trade” as individual regional governments in Canada,
principle. Total volumes for emissions of par- have implemented a carbon tax.20 Figure 08
ticular greenhouse gases are limited (capped) and provides an overview of carbon pricing mecha-
then issued in the form of allowances that can be nisms implemented globally. Various concepts for
traded. introducing a carbon tax are being discussed in
Germany.
Market participants who are subject to emissions
trading have to possess an allowance for every It is important to ensure equitable outcomes
tonne of greenhouse gas they emit. The price of when pricing greenhouse emissions, as there may
an emission allowance is determined by the mar- be significant movements in the prices paid by
ket. It varies depending on the supply of emission private individuals and businesses for electricity,
allowances and demand from market partici- petrol and other energy sources. For example,
pants. Since emission allowances can be traded some of the tax revenues may be redistributed to
freely between market participants, emissions taxpayers, as is the case in Switzerland.
trading means that greenhouse gas emissions are
avoided where the costs of doing so are lowest.
The EU, Switzerland, Norway, Liechtenstein and
New Zealand, as well as a number of regional ad-
ministrations in China, the United States, Canada2.2 EUROPEAN CLIMATE POLICY | CLIMATE ACTION IN FIGURES 21
Abbildung 08: Weltweite Übersicht zu der Einführung von CO2-Bepreisungsmechanismen
Emissionshandel
eingeführt
Kanada***
Island Kohlenstoffsteuer ein-
Kasachstan geführt
Südkorea
Emissionshandel und
USA* China** Japan**** Kohlenstoffsteuer ein-
Mexiko geführt
Singapur
Kolumbien
Australien
Chile
Argentinien
Estland Neuseeland
Lettland
Polen
Ukraine
Liechtenstein Eine Auflistung der Länder mit
CO2- Bepreisungsmechanismen
findet sich in der Informationsbox
auf Seite 20.
* USA: Elf Bundestaaten (Kalifornien, Connecticut, Delaware, Maine, Maryland, Massachusetts, New Hampshire,
New York, Rhode Island, Vermont, Washington) haben Emissionshandelssysteme eingeführt.
** China: Sechs Provinzen (Chongqing, Fujian, Guangdong, Hubei, Shanghai, Tianjin) und die Städte Shenzhen und Peking
haben Pilotprojekte für Emissionshandelssysteme eingeführt.
*** Kanada: Neben den CO2-Bepreisungsmechanismen auf nationaler Ebene haben drei Bundesstaaten (Alberta,
British Columbia, Neufundland und Labrador) Kohlenstoffsteuern und sechs Bundesstaaten (Alberta,
British Columbia, Nova Scotia, Québec, Saskatchewan, Neufundland und Labrador)
Emissionshandelssysteme eingeführt.
**** Japan: Tokyo und Saitama haben Emissionshandelssysteme eingeführt.
Quellen: ICAP (2019), Weltbank (2018b), BMU
More than half of tax revenues from EU emissions The Federal Government uses the proceeds to support
trading flow into climate action and energy effi climate action, such as the programmes and projects of
ciency measures. Around 90 per cent of emission the National Climate Initiative (NCI).
allowances are allocated to Member States based on
their emissions. Proceeds from auctioning the emis- The EU’s Effort Sharing Regulation (ESR) covers
sion allowances are retained by the Member States.21 emissions outside the EU ETS. Greenhouse gas re-
The remaining portion of the emission allowances is duction goals by 2020 are set out in the Effort Sharing
allocated additionally to less prosperous Member States Decision. The ESR covers the subsequent period to
to reduce the CO2 intensity of their economies and for 2030. It stipulates that greenhouse gas emissions in
climate adaptation. In 2018, emission allowances for the buildings, transport, agriculture, smaller industrial
around 173 million tonnes of CO2 were auctioned in plants, smaller energy producers and waste sectors
Germany, with a total value of 2.58 billion euros.22 have to be cut by at least 30 per cent by 2030 compared
to 2005. Depending on their economic strength, the22 CLIMATE ACTION IN FIGURES | 2.2 EUROPEAN CLIMATE POLICY
Figure 09: EU climate goals and policies
EU climate package 2020 2030 climate and energy framework
20 % emissions reduction compared to 1990 40 % emissions reduction compared to 1990
(or -14 % compared to 2005) (or -36 % compared to 2005)
EU ETS Effort Sharing EU ETS Effort Sharing
-21 % compared to 2005 -10 % compared to 2005 -43 % compared to 2005 -30 % compared to 2005
Emissions trading for Reduction targets for all Emissions trading for Reduction targets for all
emission-intensive Member States based emission-intensive Member States based
industrial plants and power on economic output for industrial plants and power on economic output for
stations in all Member non-ETS sectors, such as stations in all Member non-ETS sectors, such as
States transport, buildings and States transport, buildings and
agriculture agriculture
Distribution of the Effort Sharing goal among the 28 Member Distribution of the Effort Sharing goal among the 28 Member
States (in % compared to 2005) States (in % compared to 2005)
-20 % Luxembourg -40 % Sweden
-20 % Ireland -40 % Luxembourg
-20 % Denmark -39 % Finland
-17 % Sweden -39 % Denmark
-16 % United Kingdom -38 % Germany
-16 % Austria -37 % United Kingdom
-16 % Netherlands -37 % France
-16 % Finland -36 % Austria
-15 % Belgium -36 % Netherlands
-14 % France -35 % Belgium
-14 % Germany -33 % Italy
-13 % Italy -30 % Ireland
-10 % Spain -26 % Spain
-5 % Cyprus -24 % Cyprus
-4 % Greece -19 % Malta
1% Portugal -17 % Portugal
4% Slovenia -16 % Greece
5% Malta -15 % Slovenia
9% Czech Republic -14 % Czech Republic
10 % Hungary -13 % Estonia
11 % Croatia -12 % Slovakia
11 % Estonia -9 % Lithuania
13 % Slovakia -7 % Hungary
14 % Poland -7 % Croatia
15 % Lithuania -7 % Poland
17 % Latvia -6 % Latvia
19 % Romania -2 % Romania
20 % Bulgaria 0% Bulgaria
Source: European Commission (2018a)You can also read


