Air Pollution Reduction Strategy for Bangladesh
←
→
Page content transcription
If your browser does not render page correctly, please read the page content below
Air Pollution Reduction
Strategy for Bangladesh
Final Report
350
Dhaka
Chittagong
300 Rajshahi
Khulna
Monthly AQS
250 Annual AQS
PM10 concentration ( µ gm/m3 )
200
150
100
50
0
Sep, 08
Sep, 09
Sep, 10
Jan, 08
Jan, 09
Jan, 10
Jan, 11
Mar, 08
Mar, 09
Mar, 11
May, 08
May, 09
Mar, 10
May, 10
Jul, 08
Jul, 09
Jul, 10
Nov, 08
Nov, 09
Nov, 10
Month
Prepared by
Department of Environment
Government of Bangladesh
In association with
Department of Civil Engineering
Bureau of Research, Testing and Consultation
Bangladesh University of Engineering and Technology
October 2012
Air Pollution Reduction
  Strategy for Bangladesh

                   Prepared by:
          Department of Environment
          Government of Bangladesh

                In association with
         Department of Civil Engineering
   Bureau of Research, Testing and Consultation
Bangladesh University of Engineering and Technology
                  December 2012
                         ii
Executive Summary
Air pollution, especially in the large cities, is a major environmental concern in Bangladesh. In
response to a call by the Department of Environment of the Government of Bangladesh, this
report describes the current state of air quality, major sources of air pollution, past policies
implemented and suggests future strategies to reduce air pollution in Bangladesh. Around 50
strategies were initially selected, of which 26 are finally recommended after evaluation of the
strategies. The criteria for evaluation were likely impact, time to introduce, time to benefits,
technical and implementation effectiveness, cost effectiveness and co-benefits. The
recommended strategies are presented below (detail inside the report). The strategy choices
were based on a qualitative multi-criteria evaluation because of lack of information for
quantitative benefit-cost modeling. It is strongly recommended each of the strategies is
quantitatively evaluated before final implementation.

Table ES 1. Recommended strategies for air pollution reduction in Bangladesh
     Strategy                                               Area of application
 A   Improve public transport                               Large cities
 B   Strengthen vehicle inspection and maintenance          All, especially large cities
 C   Ban vehicles older than 20 years                       Commercial vehicles, large cities
 D   Encourage Diesel to CNG switch through incentives      All diesel vehicles, especially, truck & buses in
                                                            large cities
 E   Emissions (age) based annual registration fees         All vehicles
 F   Stringent emissions standards                          All new vehicles
 G   Emissions based import tariff                          All new vehicles
 H   Comprehensive land use plan for industry locations     All industries, especially new ones
 I   Cluster management                                     Cluster of highly polluting industries
 J   Emissions (technology and fuel) based license fee      All kilns
 K   Technology standards                                   All kilns
 L   Alternate construction material                        All country, especially large cites
 M   Ensure adequate power supply                           All country
 N   Emissions standards                                    All new plants
 O   Emissions standard for diesel generators               All new generators
 P   Inspection & maintenance of diesel generators          All existing generators
 Q   Technology specification                               Existing steel mills, cement and glass factories
 R   Inspection and maintenance                             Existing steel mills, cement and glass factories
 S   Emissions standards                                    All new and existing plants
 T   Import control for quality of coal                     Whole country, primarily brick and power
                                                            industries
 U   Better construction practices on site & during         All construction sites
     transport
 V   Air pollution mitigation plan and its enforcement      Large construction projects
 W   Timely road maintenance                                All roads
 X   Landscaping and gardening                              All exposed soil in urban areas
 Y   Encourage fuel switch                                  Urban slums and rural areas
 Z   Improved cooking stoves                                Rural areas

                                                      iii
In addition, it is important to consider the following for effective implementation of air pollution
reduction strategies:

1. Regulatory and fiscal reform to enable the strategies effectively
2. Awareness and motivation about air pollution across sectors
3. Research and development to address the knowledge and information gaps so that future
   strategies can be based on quantitative modeling
4. Co-operation and coordination among various stakeholders, from regulators to businesses to
   the general public
5. Capacity building and knowledge retention
6. Institutional reform to ensure coordination and governance

                                                 iv
Table of Contents
Title                                                                     Page

Executive Summary                                                         iii

List of acronyms                                                          vi

Acknowledgements                                                          viii

Chapter 1      Introduction                                               1

Chapter 2      Ambient Air Quality in Bangladesh                          5

Chapter 3      Sources of Air Pollution in Bangladesh                     16

Chapter 4      Effects of Air Pollution                                   26

Chapter 5      Past Air Quality Strategies in Bangladesh                  34

Chapter 6      Pollution Control Approaches                               45

Chapter 7      Evaluation of Air Quality Strategies                       53

Chapter 8      Other Policy Issues                                        68

Chapter 9      Conclusions                                                72

References                                                                75

Appendix       Bangladesh Air Quality and Emission Standards

                                                v
List of Acronyms
µg     micro gram (measurement unit)
ADB    Asian Development Bank
AQ     Air Quality
AQS    Air Quality Standards
BAEC   Bangladesh Atomic Energy Commission
BC     Black Carbon
BDT    Bangladeshi Taka
BPC    Bangladesh Petroleum Corporation
BRTC   Bureau of Research, Testing and Consultation
BTK    Bull's Trench Kiln
BUET   Bangladesh University of Engineering and Technology
CAC    Command and Control
CAMS Continuous Air Monitoring Stations
CH4    Methane
CNG    Compressed Natural Gas
CO     Carbon Monoxide
CO2    Carbon Dioxide
dL     deci Litre (measurement unit)
DoE    Department of Environment
FCK    Fixed Chimney Kiln
GDP    Gross Domestic Product
GEF    Global Environment Facility
GHG    Greenhouse Gases
GoB    Government of Bangladesh
GSC    Gravity Settling Chamber
HHK    Hybrid Hoffman Kiln
HK     Hoffman Kiln
IAP    Indoor Air Pollution
ICS    Improved Cooking Stoves
I&M    Inspection and Maintenance
IF     Internal Fuel
L      Litre
M$     Million US Dollar
MBI    Market Based Instrument
MoEF Ministry of Environment and Forest
NO2    Nitrogen Dioxide
                                             vi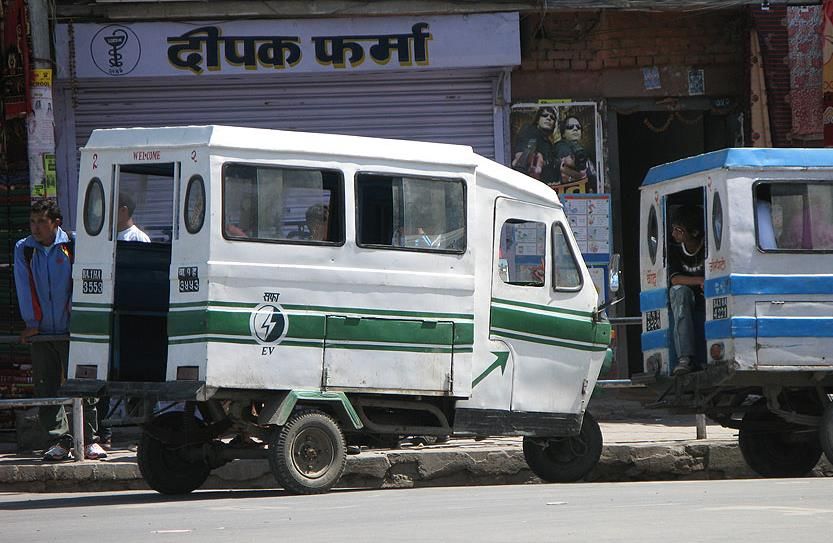
NOx     Oxides of Nitrogen, includes NO2
O3      Ozone
Pb      Lead
PM      Particulate Matter
PM10    Particulate matter with an aerodynamic diameter less than 10 µm
PM2.5   Particulate matter with an aerodynamic diameter less than 2.5 µm
ppm     parts per million
SLCF    Short-Lived Climate Forcer
SLCP    Short-Lived Climate Pollutant
SO2     Sulphur Dioxide
SOx     Oxides of Sulphur, includes SO2
SPM     Suspended Particulate Matter, includes PM10
TSP     Total Suspended Particles
UNEP United Nations Environment Programme
USEPA United States Environmental Pollution Agency
VCBK    Vertical Shaft Brick Kiln
WB      World Bank
WHO     World Health Organization
ZK      Zigzag Kiln

                                              vii
Acknowledgements

The Bureau of Research, Testing and Consultation (BRTC) of the Bangladesh University of
Engineering and Technology thanks the Department of Environment (DoE) of the Government of
Bangladesh for entrusting it with the task of preparing the air quality reduction strategy for
Bangladesh. The interactions with the DoE were smoothly and quickly handled by Mr. Quazi
Sarwar Imtiaz Hashmi. Mr. Hashmi also arranged the stakeholders meeting where the draft
version of the report was presented for getting feedback from experts in the area. Prof.
Nooruddin Ahmed, Prof. A. H. Khan, Dr. Md. Khaliquzzaman, Dr. Hafiza Khatun, Dr. Bilkis Begum,
Mr. Md. Sirajul Islam Molla, Mr. Mylvakanam Iyngararasan, and the UNEP all provided valuable
insight through written comments on the draft report, which has improved the work significantly.
BRTC gratefully acknowledges their contribution.

                                              viii
Chapter 1
                                                                    INTRODUCTION

1.1 Background
Air pollution, especially in the large cities of Dhaka and Chittagong, is a major environmental
hazard in Bangladesh. The impact of poor ambient air quality on human health, agricultural
production and damage to materials has been well documented in developing and developed
countries. Governments of all developed countries have been very active in controlling air
pollution in order to ensure a good quality of life for their citizens. Developing countries like
Bangladesh have also taken note of the air pollution issues, and often guided by the multinational
agencies like the World Bank (WB), Asian Development Bank (ADB), United Nations Environment
Programme (UNEP), have taken measures or have made plans to reduce and control air pollution.

The Department of Environment (DoE), the Government Agency entrusted with safeguarding the
environment in Bangladesh, sought proposals to develop an 'Air Pollution Reduction Policy for
Bangladesh' under the framework of the Malé Declaration on Control and Prevention of Air
Pollution and Its Likely Trans-boundary Effects for South Asia'. The DoE, with the assistance from
the Malé Declaration Secretariat based at UNEP and the Stockholm Environmental Institute (SEI),
selected the Department of Civil Engineering at Bangladesh University of Engineering and
Technology (BUET) as the consultant to produce the report. BUET provides consulting services to
nationally important projects under its Bureau of Research Testing and Consultation (BRTC)
framework.

The Department formed a two member BRTC consultant’s team, comprised of Dr. M. Ashraf Ali,
Professor and Dr. Zia Wadud, Associate Professor to conduct the work, and a contract was signed
accordingly between BRTC, BUET and the DoE.

1.2 Methodology
The proposed methodology for developing the air pollution reduction policy/strategy follows the
general USEPA guidelines (USEPA 2011). There are four main steps in developing an air pollution
control strategy.

1. Determine priority pollutants: The pollutants of concern depend not only on the health (or
   reduced agricultural output), but also on the severity of the air quality problem in the region.
2. Identify control measures: For specific emissions source categories, the appropriate controls
   for the priority pollutants are identified. This segment primarily deals with the technological
   solutions.
3. Incorporate the control measures into a strategy/policy: Once the control measures are
   identified, a regulatory program is proposed such that the control strategies are formalized.
   This section primarily deals with policies aimed at adoption of the technologies mentioned
   above.
4. Involve the public: It is important to involve the community and other affected parties, during
   the development of the policy or strategy. Early consultation reduces later challenges.

                                                1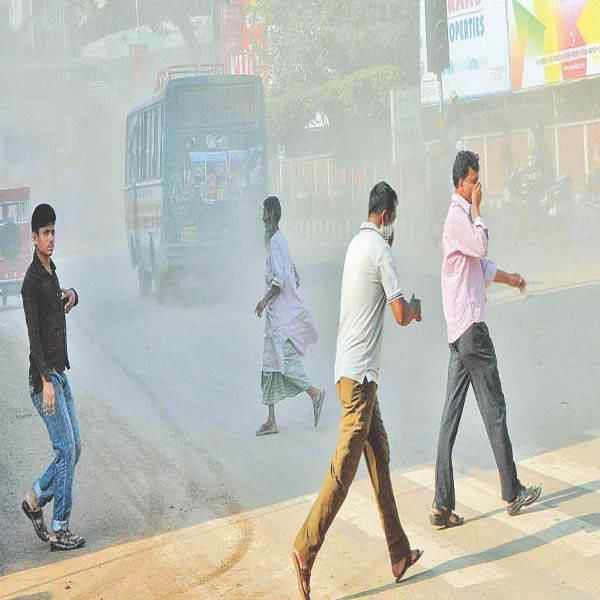
For the first step, it is important to have a comprehensive spatially and temporally disaggregated
emissions inventory identifying the contribution of different emission sources. Unfortunately no
such emissions inventory is available, although DoE has developed an aggregate emissions
inventory under the Malé Declaration for 2000. Unfortunately, this inventory does not capture
the required spatial or temporal resolution, and there are issues with the activity data and
emissions factors. In order to link steps 2 and 3, there are three primary considerations:
Environmental, Engineering and Economic. Both, the cost of individual control measures
(technologies), and the cost of the strategy (regulation, command and control, market based
instruments, etc.) are important in this regard. However, there is a lack of quantitative
information in order to carry out a quantitative evaluation of the strategies.

The dearth of information about ambient air pollutants concentration trends, emissions
inventory, existing technological landscape and costs of control, the above methodology has
been modified and the following describes the simplified work breakdown carried out in this
study by the consultants, as outlined in the original proposal:

1.  Determine the current status of air pollution in Bangladesh, with emphasis on highly
    polluted cities;
2. Review of the emissions inventory compiled by the DoE and suggest modifications, if
    necessary;
3. Based on 1 and 2, identify the key air pollutants that require action;
4. Review of international literature on air pollution control strategies (technologies) and their
    effectiveness from environmental and engineering perspectives;
5. Collect existing relevant air pollution strategies, policies, laws, standards and regulations in
    Bangladesh;
6. Review the evidence (based on published literature) of the impact of previous policies,
    strategies on air quality in Bangladesh and of potential co-benefits of strategies with respect
    to GHG emissions;
7. Collect government plans and projections on industrial and transport developments over
    the next few years, especially on coal based power plants, highways, public transportation
    and brick industries;
8. Review of international literature on policies and strategies to reduce air pollution and their
    effectiveness and economic efficiency;
9. Based on 5 to 8, identify the key control strategies for Bangladesh and potential policies to
    help implement the strategies;
10. Incorporate feedback from stakeholders and update the report;
11. Prepare the draft final report for Client's feedback;
12. Prepare final report incorporating feedback from Client/ Reviewers.

1.3 Scope
An ideal approach to developing an air pollution reduction strategy is to develop an impact-
pathway model for evaluation of policy impact as explained in Fig. 1.1. Such a modeling approach
can quantify the exact benefits resulting from any of the candidate strategies in monetary terms,
which can then be assessed against the cost of the strategy to guide policy choice. Although the
consultants have some experience in such modeling in the context of Bangladesh, especially in

                                                2
the transport and brick emissions area, there are still large uncertainties in input data (of
emissions factors, emissions activity, temporal and spatial distribution, resolution of information,
trans-boundary transport etc.), which renders such modeling exercises less useful in the context
of Bangladesh. The consultants believe that the policymaking in Bangladesh should move toward
a modeling and evidence based framework, but that the knowledge is not quite there yet. Under
these circumstances qualitative evaluation and expert stakeholders' opinions
Crop
were given more emphasis than quantitative damage modeling.
Health damage
Monetary
Emissions Concentration (Mortality,
values
Morbidity)
Material
damage
Inventory Air quality Exposure Concentration Valuation
model model model Response model
model
Pop. distribution
Building invent.
Atomos. Chem.
Crop prod. loss
Atmos. physics
Cost of illness
Crop pattern
Meteorology
Bldg. surface
Generators
Crop prices
Paint costs
Brick kilns
Industries
Morbidity
Vehicle s
Mortality
VSL
Policy/
Strategy
Fig. 1.1 Impact pathway for air quality policy benefits evaluation
Also, although the original title of the work deals with air pollution reduction ‘policy’, it is
important to highlight the change from the original call for the proposal document and the use of
the word ‘strategy’ instead of ‘policy’. This distinction is important since policy statements
generally depict one overarching vision or goal, while strategies are pathways to achieve that
vision or goal. The consultants thus focused on strategies, rather than on the overarching policy
goal. This also meant that the barrier to air pollution management and actions to overcome them
were beyond the scope of current work. Also detailed description of other policy relevant issues
were beyond the scope and are only briefly discussed.
Therefore, this document focuses on the strategies to reduce air pollution and not on action
plans or other air quality management issues. The simplified work break down described in the
previous section arises from these limitations in scope directly.
1.4 Structure of the Report
The report is divided into nine chapters. After this introduction,Chapter 2 presents the current
status of ambient air pollution in order to understand the key pollutants that need to be reduced.
Chapter 3 discusses the major sources of pollutant emissions, and Chapter 4 discusses the impact
of air pollution in Bangladesh. Chapter 5 documents the past measures undertaken in Bangladesh
to reduce air pollution, and their successes and failures. Chapter 6 discusses the approaches to
3pollution control, with some discussion on the market based and command and control policy
approaches to control air pollution. This chapter also presents some international case studies of
successful and not-so-successful approaches to pollution control. Chapter 7 identifies the
potential strategies to reduce air pollution in Bangladesh, sets the evaluation criteria and then
recommends the strategies applicable for Bangladesh. Chapter 8 briefly discusses other relevant
issues to implement the strategies, and Chapter 9 presents the conclusions of the study.
4Chapter 2
AMBIENT AIR QUALITY IN BANGLADESH
This chapter presents the current status of air quality in Bangladesh. The chapter describes the
status of each the six criteria air pollutants, pollutants that are generally controlled by air quality
standards in many countries and the current ambient air quality standard in Bangladesh.
Air Quality Management and Standards
The history of air quality management in Bangladesh is relatively recent. Ambient air quality
standards were first introduced in Bangladesh in 1997 under the environmental conservation
rules (ECR) 1997. The Air Quality Management Project (AQMP) implemented by the DoE during
2000-2007 with support from the World Bank was the first major project aimed at air quality
management in Bangladesh. The objectives of the AQMP included reducing vehicular emissions in
the metropolitan areas, setting standards, enforcing pilot programs towards cleaner
technologies, as well as implementing air quality monitoring and evaluation. This led to the
revision of the ambient air quality standards of Bangladesh in July 2005 (see Table 2.1, Appendix).
Other notable projects aimed at air quality management include certain components of the Clean
And Sustainable Environment (CASE) Project supported by the World Bank, the Bangladesh Air
Pollution Management (BAPMAN) Project, and the Implementation of Malé Declaration. The
BAPMAN project supported by NORAD is primarily an institutional capacity building project
where the Norwegian Institute of Air Research (NILU) is providing the necessary knowledge,
tools, and guidance to Bangladesh counterparts for maintaining an Air Quality program in a
sustainable manner. The overall objective of the CASE project is to catalyze the adaptation of
Sustainable Environment Initiatives (SEIs) in key polluting sectors (urban transport and brick
making) with a focus to abate air pollution and generate co-benefits through introducing energy
efficient technology in brick sector and lay the foundation of introducing mass transit projects
such as Bus Rapid Transit in Dhaka.
Table 2.1 Ambient air quality standards in Bangladesh from July 2005 and their comparison with
WHO and US standards (Source: ADB 2006)
Pollutant Averaging Bangladesh standard WHO guideline US standard
3 3 3
time (µg/m ) (µg/m ) (µg/m )
Carbon Monoxide (CO) 8 hour 10,000 (9 ppm) 10,000 10,000
1 hour 40,000 (35 ppm) 30,000 40,000
Lead (Pb) Annual 0.5 0.5 0.15
Nitrogen Oxides (NOx) Annual 100 (0.053 ppm) - -
Suspended Particulate Matter 8 hour 200 - -
(SPM)
Coarse Particulates (PM10) Annual 50 20 -
24 hour 150 50 150
Fine Particulates (PM2.5) Annual 15 10 15
24 hour 65 25 35
Ozone (O3) 1 hour 235 (0.12 ppm) - 235
8 hour 157 (0.08 ppm) 100 157
Sulphur Dioxide (SO2) Annual 80 (0.03 ppm) - 78
24 hour 365 (0.14 ppm) 20 365
5Lead (Pb)
The presence of lead (Pb) in ambient air can have especially harmful effect on the development
of fetuses and children (Tong et al. 2000). Pb was identified as a major health hazard in
Bangladesh as early as 1980s (Khan et al. 1980) when an average blood Pb concentration of
55±18 μg/dL was observed in a group of 100 adults in Dhaka.1 In early 1990s, tests confirmed the
presence of Pb in ambient air in Dhaka, and petrol additives were identified as a major source.
Subsequent advocacy by various groups led to total phase out of Pb from petrol in Bangladesh by
mid 1999, which had reduced Pb concentration in ambient air significantly.
At present, air quality standard in Bangladesh for Pb concentration in ambient air is 0.5 μg/m3.
Recent test results show that Pb concentration in ambient air in Dhaka comfortably achieves the
standard (Begum and Biswas 2008). In fact, these results show that the current ambient Pb
concentration nearly meets the USEPA standard (0.15 μg/m3), however, caution must be
exercised in interpreting the numbers since these tests considered the Pb contained within the
fine PM (PM2.5) only. Comparison of these results with earlier ones shows that the total ambient
Pb concentration can be approximately 57% more when Pb in coarse PM (PM2.5-10) is also
considered (see Table 2.2). The current share of Pb in coarser particles could actually be higher
since the current Pb in ambient air possibly does not come from fuel combustion, which generally
produces fine particles. This indicates that Pb concentration in ambient air is likely to be larger
than the current USEPA standard, but possibly is still reasonably below the Bangladesh standard.
It should be noted that Pb is not continuously measured at the CAMS established by the DoE in
different cities of the country.
Table 2.2 Ambient Pb concentration in Dhaka
Year Study 1 Study 2 Study 2 Ratio of Pb in PM10
3 3 3
Pb in PM2.5 (μg/m ) Pb in PM2.5 (μg/m ) Pb in PM10 (μg/m ) to Pb in PM2.5
1994 0.312±0.485 0.522±0.614 1.67
1997 0.265±0.549 0.256±0.532 0.461±0.775 1.80
1998 0.370±0.644 0.370±0.636 0.507±0.669 1.37
1999 0.225±0.370 0.225±0.370 0.342±0.420 1.52
2000 0.106±0.179 0.106±0.179 0.160±0.192 1.51
2001 0.130±0.163 (average 1.57)
2002 0.227±0.784
2003 0.166±0.467
2004 0.198±0.611
2005 0.102±0.207
Reference Begum & Biswas 2008 Biswas et al. 2003 Biswas et al. 2003
Apart from the possibility of Pb in road dust (Pb has a long life) other potential sources of Pb in
Bangladesh can be paint, fabric and leather dyeing (hence textile and leather industries), metal
smelters and battery industries. It is highly unlikely that Pb would be an important pollutant
outside large cities with significant industrial establishments. Although a moderate level of blood
Pb was reported in Dinajpur (see later in Table 4.2), it was possibly due to the presence of a few
fabric dyeing industries. Since blood Pb level in the urban residential and rural area are generally
1
Centre for Disease Control in the US defines 10 μg/dL of Pb in blood as elevated Pb level.
6below the ‘elevated’ level, unlike industrial areas (Table 4.2), it is clear that the Pb pollution in the
industrial areas is higher than the test location (within Dhaka University, near a large park).2 This
indicates efforts should continue to identify hotspots of Pb pollution, take necessary measures to
reduce emissions and revisit the ambient Pb standard.
Particulate Matters
It is widely accepted that particulate matter is the major pollutant of concern internationally and
in Bangladesh (ADB 2006, UNEP 2012). Numerous epidemiological and toxicological studies in
developed countries related elevated particulate concentration (especially PM2.5) with an
increased risk of premature mortality. Various regulatory impact studies (e.g. USEPA 2007) also
shows that among the criteria air pollutants, PM2.5 has the most harmful impact on health. In
recent times, the adverse effects of black carbon (BC), a major component of soot, has attracted
much attention (WHO 2012, UNEP 2011). Black carbon and other particulates are emitted from
many common sources, such as diesel cars and trucks, residential stoves, forest fires, agricultural
open burning and some industrial facilities.
The current AQS for Suspended Particulate Matter (SPM), Coarse Particulate Matter (PM10) and
Fine Particulates (PM2.5) is presented in Table 2.1. Although Bangladesh was one of the first few
countries in Asia to enact a PM2.5 standard for ambient air, the achievements on the compliance
of this and other particulate related standards are poor. Consistent and coherent source for time
series information on SPM or PM concentrations in ambient air are also not available, since the
Continuous Air Monitoring Station (CAMS) of the Department of the Environment (DoE) at
Shangshad Bhaban in Dhaka started operating in 2002 (partially operative during 2007-2010); the
other CAMS in Dhaka (at BARC) has been operating since 2008. A CAMS has also been operating
in Chittagong since 2006 and two more in Khulna and Rajshahi since 2008. There are also several
satellite monitoring stations (SAMS) at Narayanganj, Tongi, Sylhet and several locations in Dhaka,
where only PM samples have been collected sporadically. Bangladesh Atomic Energy Commission
(BAEC), since 1993, and Bangladesh University of Engineering and Technology have also been
taking snapshot measurements of the ambient PM concentrations over time. There are issues
regarding the quality assurance in the data generated and also breaks in the time dimension. The
DoE also takes occasional measurements of SPM at different towns in Bangladesh.
Because of larger emission sources (higher motorization rate, larger population, larger number of
industries) and high impact possibilities (large population exposure), Dhaka is the most important
city in terms of air pollution. Figs. 2.1 and 2.2 present the ambient PM10 and PM2.5 concentration
at the CAMS monitor near Shangshad Bhaban, Dhaka. It is clear from the figures that the ambient
air fails to meet the AQS for both the pollutants at both the averaging periods (24 hr and annual)
in Dhaka. The seasonal pattern is also clearly visible: since winters are dry with no wet deposition
possible, it is expected that the ambient PM concentrations would be higher during November to
March. The air quality is further aggravated during the winter due to the seasonal operations of
the many thousand brick kilns, both near Dhaka and throughout the country. Also, temperature
inversions during the winter hinder vertical mixing and dilution of the pollutants. On the other
hand, during much of the monsoon, PM2.5 and PM10 concentrations in the ambient air in Dhaka
2
Lead concentrations in commercial areas were even larger than in industrial areas (Ahmed et al. 2006).
7remains well below the AQS for 24 hour averaging periods, although PM2.5 tends to exceed the
AQS more frequently than PM10. It should be noted that the CAMS monitor at Sangshad Bhaban
in Dhaka is located in a semi-residential area, and pollution hot spots within Dhaka can have
significantly poorer air quality, which is observed at the second CAMS at Farmgate.
350
Max-Min Range
Monthly Average
300 24-hour AQS
Annual Average
Annual AQS
250
PM10 concentration ( µ gm/m3 )
200
150
100
50
0
Aug, 02
Aug, 04
Aug, 05
Aug, 07
Aug, 09
Aug, 10
Aug, 03
Aug, 06
Aug, 08
Dec, 02
Dec, 03
Dec, 04
Dec, 05
Dec, 06
Dec, 07
Dec, 08
Dec, 09
Dec, 10
Apr, 02
Apr, 03
Apr, 04
Apr, 05
Apr, 06
Apr, 07
Apr, 08
Apr, 09
Apr, 10
Month
Fig. 2.1 CAMS data for PM10 at Dhaka, along with AQS (Source: DoE)
Although there is limited time series data to conduct a proper trend analysis, it does appear that
the particulates concentration in Dhaka did not increase significantly in the recent years, despite
a large increase in vehicle numbers during that period. Conversion of vehicles to run on CNG has
largely contributed to the reduction of PM emissions and the relatively stable ambient
concentrations. However, even this stable annual average ambient concentration of particulates
is more than twice the AQS for coarser particulates and more than five times the AQS for finer
particulates during dry season. Such a high exposure to PM2.5 is especially alarming since research
clearly shows that prolonged exposure to PM2.5 has almost ten times the adverse impacts on
premature mortality than short term acute exposures.
250
Max-Min Range
Monthly Average
24-hour AQS
200 Annual Average
Annual AQS
PM2.5 concentration ( µ gm/m3 )
150
100
50
0
Aug, 03
Aug, 04
Aug, 05
Aug, 08
Aug, 09
Aug, 02
Aug, 06
Aug, 07
Aug, 10
Dec, 02
Dec, 03
Dec, 04
Dec, 05
Dec, 06
Dec, 07
Dec, 08
Dec, 09
Dec, 10
Apr, 02
Apr, 03
Apr, 04
Apr, 05
Apr, 06
Apr, 07
Apr, 08
Apr, 09
Apr, 10
Month
Fig. 2.2 CAMS data for PM2.5 at Dhaka, along with AQS (Source: DoE)
8There is a large spatial variation in concentrations of particulates among different cities or areas
within Bangladesh and also within the same city. Figs. 2.3 and 2.4 present the CAMS data for four
large cities in Bangladesh for PM10 and PM2.5 respectively for 3 years (CAMS data for Chittagong,
Rajshahi, and Khulna are available only recently). Despite a lack of data during the winter months,
the seasonal pattern can easily be inferred in all cities. Although Rajshahi has smaller number of
vehicles and industries than Chittagong, its air quality is slightly worse than Chittagong’s.
Windblown dust from the sand dunes of the Padma could be responsible for higher PM recorded
at the Rajshahi CAMS. Proximity to the sea and stronger wind possibly influence air quality in
Chittagong. Somewhat surprisingly, particulates concentrations in Khulna are larger than in
Dhaka, which requires further investigation.3 In all of the comparative statements, it must be
recognized that the data are for a single monitor in each city, and the location of the monitor can
be crucial. Figs. 2.3 and 2.4 clearly reveal that long term (annual) particulate air pollution is of
serious concern in these major cities too. Although there is a lack of data, particulates
concentration during the winter months comfortably exceeds the 24-hour AQS.
350
Dhaka
Chittagong
300 Rajshahi
Khulna
24-hour AQS
250 Annual AQS
PM10 concentration ( µ gm/m3 )
200
150
100
50
0
Sep, 08
Sep, 09
Sep, 10
Mar, 08
Mar, 09
Mar, 11
May, 08
May, 09
Mar, 10
May, 10
Jan, 08
Jan, 09
Jan, 10
Jan, 11
Nov, 08
Nov, 09
Nov, 10
Jul, 08
Jul, 09
Jul, 10
Month
Fig. 2.3 CAMS data for PM10 at four major cities, along with AQS (Source: DoE)
Table 2.3 collates the concentrations of particulates (and other pollutants) at various locations in
Bangladesh from different other studies (non CAMS), although the concentrations between
different studies and different time periods may not be strictly comparable. However, it is clear
that total SPM (or PM10) exceeds the national AQS for SPM (or PM10) for almost all the cases.
Note that most of the measurements were taken during the winter, which is dry and, therefore,
dusty. The very high SPM measures at the two locations in Chittagong are industrial and
commercial hubs of the city, while Bogra, Rajshahi, Sirajganj and Pabna are located in the
northeastern part of the country which is meteorologically drier than the rest. Even the less
urbanized Sunamganj had a large SPM concentration during the winter. Lack of information on
size wise distribution of the particulates in these locations does not allow further analysis of their
potential sources.
3
The CAMS at Khulna has opened very recently, and there may be some calibration issues.
9250
Dhaka
Chittagong
Rajshahi
200 Khulna
24-hour AQS
Annual AQS
PM2.5 concentration ( µ gm/m3 )
150
100
50
0 Sep, 08
Sep, 09
Sep, 10
Mar, 08
Mar, 09
Mar, 11
May, 08
May, 09
Mar, 10
May, 10
Jan, 08
Jan, 09
Jan, 10
Jan, 11
Nov, 08
Nov, 09
Nov, 10
Jul, 08
Jul, 09
Jul, 10
Month
Fig. 2.4 CAMS data for PM2.5 at four major cities, along with AQS (Source: DoE)
Table 2.3 Particulate concentration at different parts in Bangladesh (source: ADB 2006, other
unpublished sources)
City Time of measurement TSP
AQS (annual) 200
Bogra 2003-2004 170-531
Rajshahi 2004 329-680
Sirajganj 2003 400-420
Pabna 2004 500-829
Chittagong Khulshi Oct 2002 – Mar 2003 213.1-317.8
Nasirabad Mar 2003 904
Agrabad Apr 2004 804
Chandgaon Sep 2002 – Feb 2003 172.6-208.4
Sunamganj (diff locations) Feb 2010 243.2-365
Modeling exercises in the late 1990s show that the major road intersections were the hotspots
for air pollution in Dhaka (Karim 1999). This is expected since motor vehicles are a major source
of air pollution in large cities throughout the world and Dhaka is no exception. Source
apportionment studies on collected PM samples undertaken by Bangladesh Atomic Energy
Commission (BAEC, Begum et al. 2004, 2005, 2007, 2009) also confirm that motor vehicles are
the major PM source in Dhaka and Chittagong (Figs. 2.5 and 2.6). Re-suspended soil (road dust or
crustal soil) are another major source among the larger fraction of particulates. For fine
particulates, brick kilns and biomass burning can be a large source, especially in areas away from
Dhaka. A recent study also identified transboundary transport of pollutants from India as a
significant source of background particulate concentration in Bangladesh (Begum et al. 2010). In
summary, motor vehicles (especially diesel ones), brick kilns, biomass burning (especially in rural
areas), re-suspended dust (from construction activities, roads), metal smelting and cement
factories are the major sources of particulate emissions in Bangladesh.
10100%
90%
80%
70%
60%
50%
Source share
40%
30%
20%
10% 1993-94 2001-02 2001-02 2001-02 2007
hotspot
0%
Dhaka Dhaka Dhaka Rajshahi Chittagong
Motor vehicles 2-stroke engine Natural gas/diesel burning
Seal salt Brick kiln Brick kiln + biomass burning
Soil dust Road dust Resuspended soil
Construction activities Metal smelting Refuse burning
Fugitive Pb Others
Fig. 2.5 Source apportionment for PM2.5-10 at various locations in Bangladesh (source: BAEC)
100%
90%
80%
70%
60%
50%
Source share
40%
30%
20%
10% 1993-94 2001-02 2001-02 2001-02 2007
hotspot
0%
Dhaka Dhaka Dhaka Rajshahi Chittagong
Motor vehicles 2-stroke engine Natural gas/diesel burning
Seal salt Brick kiln Brick kiln + biomass burning
Soil dust Road dust Resuspended soil
Construction activities Metal smelting Refuse burning
Fugitive Pb Others
Fig. 2.6 Source apportionment for PM2.5 at various locations in Bangladesh (source: BAEC)
NO2
Nitrogen Dioxide (NO2) has some health impacts and is a well known precursor to acid rain,
which can reduce agricultural production and damage the environment (UNEP, 2012). NO2 is also
a precursor for the formation of particulates and O3 in the atmosphere, which are both known to
increase premature mortality. NOx monitoring data from CAMS in the three large cities are not as
extensive as the particulates data, but those available are summarized in Fig 2.7. Lack of a proper
time series, and data gaps even within the 3-year period, make it difficult to ascertain the trend
of ambient NO2. However, it appears the annual average ambient concentrations for NO2 are
below the national AQS for all the cities, indicating that NOx is not a pollutant of serious concern
at the moment. Major sources of NOx emissions are motor vehicles, power plants and other
combustions sources. Once again, recorded NOx ambient concentration in Rajshahi is larger than
in Chittagong, despite Chittagong having a larger number of potential NOx sources. As noted
11earlier, close proximity of a major busy highway to the Rajshahi CAMS could be responsible for
this.
100
Dhaka
90 Chittagong
Rajshahi
80 Annual AQS
NOx concentration (ppb) 70
60
50
40
30
20
10
0
Sep, 08
Sep, 09
Sep, 10
Jan, 08
Jan, 09
Jan, 10
Mar, 08
Mar, 09
May, 09
Mar, 10
May, 08
May, 10
Jul, 08
Jul, 09
Jul, 10
Nov, 10
Nov, 08
Nov, 09
Month
Fig. 2.7 CAMS data for NOx at three major cities, along with AQS (Source: DoE)
Hot spot areas can still exceed the AQS for NO2 and other pollutants, as can be seen in Table 2.4
which presents ambient concentrations of NOx, SOx, O3 and CO near Sonargaon Hotel, which is
located at one of the busiest intersections of roads in Dhaka.
Table 2.4 Concentration of criteria air pollutants at a Dhaka hotspot, mid 90s (Source: Islam 2005)
Pollutants 28 day average concentration Maximum concentration AQS (ppb)
(ppb) (ppb)
NO2 130 400 53 (annual)
SO2 150 1470 140 (24 hour)
O3 20 280 80 (8 hour), 120 (1 hour)
CO 4690 14800 9000 (8 hour), 35000 (1 hour)
SO2
Sulphur dioxide (SO2) has health impacts as a gas and also acts as a precursor to the formation of
particulates and acid rain in the atmosphere. SO2 emissions occur primarily from combustion of
sulphur containing fuel (coal, diesel). In Bangladesh, diesel vehicles and brick kilns are the most
important sources because of the presence of sulphur in commercially available diesel and coal.
Similar to NOx, ambient SO2 concentration from the CAMS monitors of three cities are presented
in Fig. 2.8. Clearly the current ambient concentrations are significantly lower than the AQS and
ambient SO2 is not of significant concern at the moment. It is possible that SO2 concentrations
exceed the AQS at pollution hot spots (Table 2.4), but at the moment, comprehensive data on hot
spots remains unavailable.
O3
Ozone (O3) in high concentrations at the ground level can be a significant health hazard, resulting
in premature mortality. O3 can also reduce agricultural productivity significantly by hindering
12plant growth (GEO5, 2012). Unlike particulates, NOx or SO2, O3 is not directly emitted by any
source, but is produced in the atmosphere when emissions of volatile organic compounds and
NOx from different sources react in the presence of sunlight. O3 concentrations in three large
cities in Bangladesh are presented in Fig. 2.9. It is clear that the average concentrations are below
the AQS, however, the AQS for O3 works in a different way than those of particulates. O3
concentrations show diurnal variation and it is important that the ambient concentration does
not exceed the AQS beyond a certain number of times. Hourly or 8 hourly O3 data is therefore
more useful than the averages presented here.
30
Dhaka
Chittagong
25 Rajshahi
8-hour AQS
SO2 concentration (ppb)
20
15
10
5
0
Sep, 08
Sep, 09
Sep, 10
Jan, 08
Jan, 09
Jan, 10
Mar, 08
Mar, 09
May, 09
Mar, 10
May, 08
May, 10
Jul, 09
Jul, 10
Jul, 08
Nov, 08
Nov, 09
Nov, 10
Month
Fig. 2.8 CAMS data for SO2 at three major cities, along with AQS (Source: DoE)
80
Dhaka
70 Chittagong
Rajshahi
8-hour AQS
60
O3 concentration (ppb)
50
40
30
20
10
0
Sep, 08
Sep, 09
Sep, 10
Jan, 08
Jan, 10
Mar, 09
Jan, 09
Mar, 08
May, 08
Mar, 10
May, 09
May, 10
Jul, 08
Jul, 09
Jul, 10
Nov, 09
Nov, 08
Nov, 10
Month
Fig. 2.9 CAMS data for O3 at three major cities, along with AQS (Source: DoE)
Although it is possible that O3 concentrations could exceed AQS at certain places (Table 2.4),
which is not captured through Fig. 2.9, the very low averages give confidence that the probability
of exceeding the AQS is very low. Note also that two stakeholders considered that the O3
monitors were not placed at the locations of maximum O3 concentrations and therefore too
13much reliance on the data from the current monitors may not be wise. Even if this argument is
true, considering the relatively less potency of O3 with respect to PM, O3 remains a less important
pollutant than PM.
CO
Carbon Monoxide CO is produced due to incomplete combustion and, exposure at very high
levels can cause death. Major sources of CO in urban areas are motor vehicles. Ambient CO
concentrations from the CAMS at three cities in Bangladesh (Fig. 2.10) reveal no significant
concern regarding outdoor CO pollution. However, CO pollution can be significant in indoor
atmosphere, especially in the rural areas where use fuel wood and other solid fuels are used for
cooking.
10
9
Dhaka
8 Chittagong
Rajshahi
7 8-hour AQS
CO concentration (ppm)
6
5
4
3
2
1
0
Sep, 09
Sep, 08
Sep, 10
Jan, 08
Jan, 10
Jan, 09
Mar, 08
Mar, 09
Mar, 10
May, 08
May, 09
May, 10
Jul, 08
Jul, 09
Jul, 10
Nov, 08
Nov, 09
Nov, 10
Month
Fig. 2.10 CAMS data for CO at three major cities, along with AQS (Source: DoE)
Indoor Pollutants
Indoor air pollution (IAP), resulting primarily from combustion of biomass (e.g., firewood, animal
dung, crop residue) and fossil fuels (e.g., kerosene) in traditional cooking stoves in rural areas and
urban slums, is a major concern in Bangladesh as well as many other developing countries. IAP
causes acute respiratory infections, which is major cause of death of young children in developing
countries. Through respiratory infections, IAP has been estimated to cause between 1.6 and 2
million deaths per year in developing countries (Smith et al., 2004), primarily affecting children in
poor households. In fact, women and children in the developing countries are disproportionately
exposed to polluted air due to use of biomass/ fossil fuels for cooking and heating (World Bank,
2010). It has been argued (Dasgupta et al., 2006b) that in biomass using households in
Bangladesh, IAP may be much worse than outdoor pollution, and health risks may be severe for
household members who are exposed to IAP for long periods during the day.
14Typical pollutants generated from burning of solid biomass fuel include particulate matter, CO,
and a wide range of organic pollutants including benzene, formaldehyde, and PAHs. In
Bangladesh, only limited data are available on indoor air quality (e.g., Dasgupta et al., 2009;
Khaliquzzaman et al., 2007; Dasgupta et al., 2006a, 2006b; Dana, 2002; Alauddin and
Bhattacharjee, 2002). Dana (2002) found that concentration of SPM in kitchen environment in
Gazipur and Dhaka slum areas ranged from 4,040 to 39,192 g/m3. Alauddin and Bhattacharjee
(2002) found concentration of SPM in a poorly ventilated rural kitchen (5,032 g/m3) in Dhamrai,
Manikganj to be much higher than that in a well-ventilated rural kitchen (3,670 g/m3). The same
study also found significantly higher levels of VOCs in the poorly ventilated kitchen compared to
that in the well-ventilated kitchen. Dasgupta et al. (2006a) reported that household level PM10
concentrations in Bangladesh frequently reached 300 g/m3, although spikes of up to 4,864
g/m3 have been observed,. Under average conditions, Bangladeshi households using “dirty”
fuels can experience 24-hour average PM10 concentrations as high as 800 g/m3 (Dasgupta et al.,
2006b), against an acceptable level of 150 g/m3 (USEPA, 2006).
Dasgupta et al. (2006a) reported significant regional variation in indoor air quality depending on
local differences in fuel use and, more significantly, construction practices that affect ventilation.
In fact, Dasgupta et al. (2006b) reported that non-fuel characteristics are so influential that some
households using “dirty” biomass fuels have PM10 concentrations comparable with those in
households using clear fuels. Dasgupta et al. (2006a; b; 2009) also reported that pollution
generated in cooking areas diffuses almost immediately into living areas, and as a result hourly
pollution levels in cooking and living areas are quite similar; in 236 Narshingdi households, the
average 24-hour PM10 concentration was 260 g/m3 for cooking areas 210 g/m3 for living areas,
while average outdoor concentration was 36 g/m3.
15Chapter 3
SOURCES OF AIR POLLUTION IN BANGLADESH
In order to control air pollution, it is necessary to understand the sources of the pollution, since
all pollution control approaches aim to reduce emissions in order to control ambient
concentration of pollutants. This chapter describes the major sources of various air pollutants in
Bangladesh.
3.1 Pollutant specific sources
Globally, the major sources of the individual air pollutants are briefly listed in Table 3.1.
Considering the different structure of the economy and meteorology, not all of these sources are
important for Bangladesh, and the major sources in Bangladesh are described in the next section.
Table 3.1. Major sources of criteria air pollutants (Source: USEPA, with minor modifications)
Pollutant Sources
Carbon Monoxide (CO) Motor vehicle exhaust, kerosene, power plants with internal combustion engines or
wood/biomass burning stoves.
Sulphur Dioxide (SO2) Coal-fired power plants, brick kilns, petroleum refineries, sulphuric acid manufacture,
and smelting sulphur containing ores.
Nitrogen Dioxide (NO2) Motor vehicles, power plants, and other industrial, commercial, and residential sources
that burn fuels (e.g. diesel generators).
Ozone (O3) Vehicle exhaust and certain other fumes (hydrocarbons). Formed from other air
pollutants in the presence of sunlight.
Lead (Pb) Metal refineries, lead smelters, battery manufacturers, iron and steel producers.
Particulate Matter (PM) Diesel engines, motor vehicles, power plants, brick kilns, industries, windblown and
road dust, wood/ biomass stoves, open burning.
3.2 Trend of Major Sources in Bangladesh
3.2.1 Motor Vehicles
Combustion of fuels in motor vehicles is, undoubtedly, the most important source of air pollution
in the largest of the urban centres, i.e. in Dhaka and Chittagong. Fuel combustion not only
produces fine particulates directly, which have severe health effects, but also emits NOx and SOx,
which are important precursors to producing further particulates in the atmosphere.4 NOx and HC
emitted from vehicles can also undergo transformation in the atmosphere to produce ozone (as
well as a range of other secondary pollutants), another pollutant with direct adverse health
impacts. Also, vehicles emit closer to the human population and thus have a direct effect on
human health in urban areas.
Dhaka and Chittagong, and Bangladesh in general, have a very low vehicle ownership by
international standards. Even in comparison to neighbouring India and Pakistan, vehicle
ownership in Bangladesh is very small. However, the growth rate in the number of motor vehicles
4
NOx and SOx react with NH3, which is in abundant supply in Bangladesh because of its vast agriculture
sector, to produce fine particles of NH4NO3 and NH4SO4
16in Dhaka, and in Bangladesh, in recent years is quite high (around 8% on an average for the past 5
years). This is a joint result of a robust economic growth, giving rise to a larger middle class and a
lack of good public transport system in Dhaka city. For long distance and freight also, road is now
the major mode of transport, eclipsing rail or water, which are generally more energy efficient.
Fig. 3.1 shows the growth in motor vehicles in Bangladesh and in Dhaka city over the last 20
years. High congestion in the roads of Dhaka and Chittagong not only increases emissions to the
atmosphere, but also increases exposure of in-vehicle users as well as pedestrians.
1600
Others Autorickshaw Taxi Truck Bus SUV Car Motorcycle
1400
1200
Number of vehicles (Thousands)
1000
800
600
400
200
0
1985
1986
1987
1988
1989
1990
1991
1992
1993
1994
1995
1996
1997
1998
1999
2000
2001
2002
2003
2004
2005
2006
2007
2008
2009
2010
Year
Fig. 3.1 Vehicle growth in Bangladesh during 1985-2010 (source: BRTA)
Bangladesh does not have any vehicle manufacturing industry and all the vehicles are imported
from abroad. Among the personal vehicle fleet, most are pre-used cars imported from Japan.
Since these vehicles were originally built to strict Japanese emissions standards (mostly Euro IV
equivalent), their emission performances are quite good as found in the road side measurements
by the DoE. A series of measurements in 2011 show that less than 5% of the gasoline/CNG fueled
car fleet in Dhaka fail to meet CO emissions standard. Since 2002, conversion of most personal
vehicles to run on CNG has possibly made the on road personal vehicles less polluting in terms of
particulates, although ultrafines emissions may have increased. However, the emissions
performance of converted vehicles can vary widely, depending on the emissions performance of
the original vehicle, quality of conversion and maintenance. Also, there exists no information on
pre and post conversion emissions performance of the vehicles.
Although the number of buses, minibuses, human haulers and trucks are much smaller in
comparison to the personal vehicle fleet, these vehicles contribute more to the total particulate
emissions. The DoE (2011) roadside measurements found that more than 60% of the diesel fleet
fail to meet free acceleration smoke emissions standard. The primary reasons are an older vehicle
fleet with mostly pre-Euro era engines, use of diesel fuel and poorer maintenance of commercial
vehicles. Reducing emissions from these vehicles through improved vehicle inspection and
maintenance or phasing out of the vehicles from urban centres can have large immediate health
benefits in Bangladesh.
An important parameter in particulates from motor vehicles is the sulphur content in the fuel.
High sulphur content can be particularly harmful for diesel vehicles. At present the sulphur
17content in motor fuel in Bangladesh is significantly high as compared to many other countries.
Table 3.2 presents the sulphur content of various fuel types by Bangladesh Petroleum
Corporation (BPC), the sole agency responsible for liquid fuel supply in the country. The very high
sulphur in fuel leads to the formation of secondary particulates. There is some scope for reducing
the formation of secondary particulates through reducing fuel sulphur content although it was
mentioned in the stakeholders meeting that the majority of diesel PM emissions is carbonaceous
and thus diesel de-sulphurization may not have large benefits. Also, low sulphur diesel works
with Euro II or later engines, thus reducing diesel sulphur content without phasing out older
diesel engines through stricter vehicle emissions standards will not be beneficial.
Table 3.2 Fuel sulphur content in different fuel types in Bangladesh (Source: Islam 2005)
Fuel Acronym Bangladesh (ppm)
Motor gasoline MS 1,000
Motor gasoline HOBC 1,000
High speed diesel HSD 5,000
Low sulphur diesel LSHSD 3,000
Light diesel oil LDO 18,000
High sulphur furnace oil HSFO 35,000
Kerosene SKO 4,000
Jet fuel JETAI 3,000
Liquefied Petroleum Gas LPG 200
Under the current circumstances, vehicle numbers will significantly increase in the future with
concomitant pressure on the air quality, especially in the larger cities. Even if strong policies are
undertaken to discourage personal vehicle growth (through appropriate land use policies,
installation of extensive public transport system in Dhaka and Chittagong, increasing personal
vehicle usage costs, etc.), it appears that vehicle growth cannot be stopped and, at best, can only
be slowed. This indicates successively stricter emissions standards, better institutional capacity to
monitor and enforce standards, retrofitting diesel vehicles with particulate filters and switching
to cleaner fuel (low sulphur diesel and CNG) would all be necessary to keep the air pollution from
vehicles under control. It should be noted that high sulphur diesel is phased out in the
international market, and the Chittagong refinery, once upgraded, will also have a sulphur
content lower than 500 ppm. Therefore there is a good likelihood that the diesel sulphur content
will be reduced in Bangladesh without additional interventions.
3.2.2 Brick Kilns
Brick kilns are a major source of air pollution throughout Bangladesh (Fig. 3.2). Brick kilns are
major sources of PM, SOx, CO, VOC (VOCs are precursors to O3) and acidic gases (e.g. HF, HCl
etc.). Brick making is also one of the largest GHG emissions source in Bangladesh, with large CO2
emissions from the combustion of coal and wood.
Bangladesh has only limited natural sources of stones and construction of infrastructure and
buildings often depends on the supply of locally produced bricks. The construction sector has
been growing at a rate of 8.1% to 8.9% a year during the last decade, with concomitant growth in
demand for bricks (IIDFCL 2009). It is estimated that around 15 billion bricks are produced
annually in Bangladesh from around 5,000 brick kilns (Hossain 2008), although some recent
18Fig. 3.2 Brick kilns in Bangladesh are a major source of air pollution and GHG emissions
estimates put the number at 8,000 (Prothom Alo 2012). Among the brick kilns, 75% are Fixed
Chimney Kilns (FCK), while around 16% are still Bulls Trench Kilns (BTK), which are highly
polluting. The rest (only 9%) are Zigzag and Hoffman Kilns (ZK and HK), which are better in their
emissions performance. Almost all the brick kilns use coal as the primary fuel, although unofficial
estimates mention that around 25% of the fuel used in 2007 was still wood (20% in 2012,
mentioned in stakeholders meeting, Fig. 3.3).
Fig. 3.3 Wood storage for brick kilns (source: Daily Star)
The sulphur content in imported coal from north-east India is often around 5%, whereas there is
a ban on importing coal with a sulphur content larger than 1% to be enforced by the Ministry of
Commerce. The ban, however, is overturned at the request of brick manufacturers every year
(since coal from north east India is the cheapest) and there is essentially no control on sulphur
content of the coal used in the brick kilns. These coals also have high clinker and ash content,
which contributes to high PM emissions.
Brick making is an important industry in Bangladesh, with an annual turnover of around BDT 450
billion in 2006-2007 (1% of GDP). Since brick making is still a labour intensive process,
approximately 1 million people directly or indirectly depend on the industry for their livelihood.
However, the industry is still not an organized one, and apart from the few HKs and ZKs, all other
kilns are in operation only during the winter aggravating the already poor air quality.
19The industry as a whole uses traditional and old technology and is inefficient in its energy use. On
average, the brick kilns in Bangladesh use around 23 tons of coal to produce 100,000 bricks,
whereas in China the amount is only 7.8 to 8 tons (although slightly smaller sized bricks, IKEBMI
2007). While cost benefits analysis generally shows that switching to the advanced brick burning
technologies are financially viable and socially very desirable in the long run, large capital
investment initially is a significant drawback.
It is worthwhile to note that Hoffman Kilns (HK) using natural gas as the fuel are the cleanest of
all brick kilns in terms of AQ impacts, but they have not gained much popularity in Bangladesh,
despite the country having significant resources in natural gas. The reasons for the unpopularity
are the larger capital and operating costs of the HKs, lack of a nationwide gas supply network and
primarily the unreliability of gas supplies even where the network is available. Unavailability of
gas has encouraged the closure of some of these clean HKs.
With the unavailability of stone, brick industries are expected to supply the major share of
construction materials in Bangladesh in the future. It is argued in the Stakeholders meetings that
a sizable share of the brick is exported to India as well leading to air pollution externalities in
Bangladesh. It is therefore of utmost importance that opportunities are created through policy
measures, so that the industry embraces technologies to reduce emissions - both local air
pollutants as well as GHGs. Although HKs are the least emitting of all brick kilns, it is unlikely that
natural gas will be available for brick kilns (see power section). Among coal fueled kilns, Hybrid
Hoffman Kilns (HHK) and Vertical Shaft Brick Kilns (VSBK) appear to be the most promising,
although their higher capital costs can be onerous to the numerous small entrepreneurs. Proper
Market Based Instruments (MBIs) linked to pollution levels can be useful in keeping the economic
costs of the technology adoption down and assist in the transition. For example, gravity settling
chambers in FCKs may be able to reduce the emissions at a much lower cost than HHKs or VSBKs.
Lack of capacity and willingness to enforce can be significant hindrance for effective
implementation of the MBIs. In another approach, there have been recent initiatives in
constructing some pilot HHK through Global Environment Facilities (GEF) taking advantage of the
carbon credits generated by such projects.
3.2.3 Industries
While the brick industry requires a separate section because of its large contribution to air
pollution, contribution from other industrial sources are not negligible. The major polluting
industries in this regard are the cement, steel, parboiling rice mills, and glass plants. All three are
directly linked to building and infrastructure construction (as is brick), which is a natural
consequence of the state of growth in Bangladesh. Since such growth is expected in the future, it
is important to control emissions from these sources in order to keep the air quality at a
reasonable level. There are currently gaseous emissions standards governing emissions from
these industries, but enforcement is so lax that only a few people are aware of their existence.
3.2.4 Biomass Burning
The World Health Organization (WHO) estimates that 2.4 billion people worldwide rely on
burning biomass fuels (e.g., fuelwood, animal dung, crop residues) for cooking and heating their
homes. Biomass is extensively used in rural areas of Bangladesh, primarily for cooking. Biomass
20You can also read