Modeling of a Major Accident in Five Nuclear Power Plants From 365 Meteorological Situations in Western Europe and Analysis of the Potential ...
←
→
Page content transcription
If your browser does not render page correctly, please read the page content below
Modeling of a Major Accident in Five Nuclear Power Plants From 365 Meteorological
Situations in Western Europe and Analysis of the Potential Impacts on Populations,
Soils and Affected Countries
Authors
Piguet Frédéric-Paul, Institut Biosphère, Geneva1; Eckert Pierre, Geneva, Deriaz Bastien, Institute for
environmental sciences, University of Geneva, Knüsli Claudio, IPPNW (Suisse), Bireggstrasse 36, Luzern,
Giuliani Gregory, Institute for environmental sciences, University of Geneva
Version 20190521/20190522/20190603/20190605/ 20190611 The last editing questions are under revision!
Additional experts and peer-review
● This report has received the intellectual support from four anonymous experts2 and the constructive critics
of two peer-reviewers3.
Commissioning Organization
● Sortir du Nucléaire Suisse Romande4
Abstract
The present study discusses the probability of a major accident in a nuclear power plant and, by simulation of
such an accident, it evaluates the harm to persons. It aims at characterizing the health effects of ionizing
radiation and it assesses the number of people impacted by a radioactive cloud and by the deposition of
radioactive material on the ground. It further evaluates the number of people in need of a resettlement. It
also analyses the size of the area lost for agriculture because of radio-contamination.
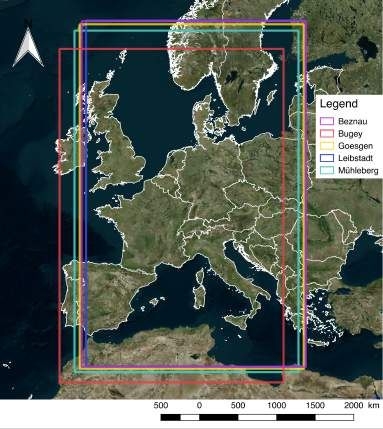
More specifically, the Western European nuclear power plants (NPPs) under scrutiny are Beznau, Gösgen,
Leibstadt and Mühleberg in Switzerland and Bugey in France. The study models a major nuclear accident using
meteorological files, one for each day during the year 2017 with help of the trajectory and dispersion model
Hysplit. The source terms of the simulated accidents are specific to each of the five NPPs. They represent an
amount situated between the Fukushima and Chernobyl releases, according to available literature.
Demographic data were treated by a geographical information system GIS software called QGIS. Conversion
of radiation from Becquerel to Sievert was established according to the literature. Health effects were
estimated from the committed collective effective doses (CCED), and used in connection with three risk
models for different issues: cancer, cardiovascular and other non-cancer diseases, genetic and other
reproductive detriments.
The main results are as follows. Between 16.4 and 24 million European inhabitants on average would be
affected by a large radio-contamination. We found between 20,000 and nearly 50,000 radio-induced cancer
cases, depending on the specific NPP. Additionally, between 7,500 and 18,500 radio-induced cardiovascular
cases (myocardial infarction, cerebrovascular disease) are estimated as late effects of ionizing radiation.
Stringent weather dependency of the numbers of victims were demonstrated with 4-fold and 20-fold
differences for the highest and lowest deciles, and centiles respectively. The huge number of other radio-
induced diseases, genetic and other reproductive effects could only be estimated semi-quantitatively due to
lack of established risk factors. Furthermore, the number of people who should be evacuated and resettled
could, on average, reach 250,000 for the smaller NPP (Beznau) and up to 500,000 for Leibstadt. In addition,
the mean size of radio-contaminated crop and grazing land could amount to between 16,000 and 37,000 km2.
The impact of such an accident may heavily affect the population and economic activity of the concerned
countries as well as triggering a case of transboundary pollution with its legal consequences.
1 Corresponding author: Frédéric-Paul Piguet, Institut Biosphère, CH-1226 Geneva, fppiguet@institutbiosphere.ch
2 Anonymous experts: we thank warmly an expert in industrial risk, a chemist-engineer and two physicists, for their helpful and
support.
3 We warmly thank Afred Körblein for the independent and constructive reviewing of this study and his numerous suggestions and
also Martin Walter for his careful, competent and indefatigable intellectual support
4 Rue des Gares 27, CH-1201 Genève (www.sortirdunucleaire.ch)
1
Biosphere Institute, Geneva, Strategic study n°2, May 2019, https://institutbiosphere.ch/eunupri_2019.html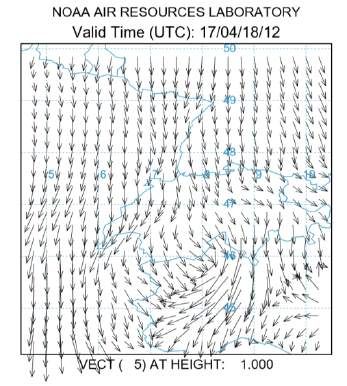
I Context
1.1 Scope of the study
The study models a major nuclear accident in one amongst 5 selected nuclear power plants in Switzerland and
neighboring France, in 365 real weather situations, one for each day of the year 2017. The nuclear power
plants studied are those of Beznau, Bugey, Gösgen, Leibstadt, and Mühleberg. As far as Switzerland is
concerned, the study aims to quantify as comprehensively as possible the health impact, population
displacement (migration impact) and the impact on agriculture. In addition, it includes very short questioning
on the economic, financial and political impacts that are briefly presented, by contextualizing our results with
the literature dedicated to these aspects. For Europe, the study aims to quantify the health, migratory, and
political impact of a major accident when Europe as a whole is affected by a radioactive release.
To start, we first remember what is known in terms of the impact from the historic events in Chernobyl and
Fukushima. Thereafter, the five selected NPPs are shortly presented.

1.2 Consequences of the Chernobyl and Fukushima accidents
The Chernobyl Nuclear Power plant [NPP] accident took place on 26 April 1986. It followed a nuclear reactor
test which went out of control resulting in a nuclear meltdown. According to the International Atomic Energy
Administration (IAEA), radioactive clouds were escaping from the ruins for 10 days and the wind was turning
in all directions during this period, dispersing radioactive material (IAEA 2006, 21).
The total area with 137Cs soil deposition of 3,7 kBq/m2 (1 Ci/km2) and above covered an area of 192,000 km2,
the surface of soil above 555 kBq/m2 was 10,300 km2, while the area of soil above 1,480 kBq/m2 was 3,100
km2 (IAEA 2006, 23). Elements other than cesium have contributed to radiological contamination. In
particular, a total area of agricultural land of 265,000 ha received 111 kBq/m2 of strontium-90 (90Sr) and 3.7
kBq/m2 of different plutonium isotopes (IAEA 2006, 84). These data as well as the map published by IAEA after
the Chernobyl accident strongly support that in the event of a major nuclear accident, high levels of radio-
contamination should be considered up to hundreds of km from the source of the release (IAEA 2006, 25).
Displacement of population was compulsory in the years 1986-87, for persons living in areas with more than
15 Ci/km2 (555 kBq/m2) (Yablokov et al. 2009, 25). Consequently, 350,000 to 400,000 people were forced to
leave their homes while many other left the region voluntarily, which means a total of 492,000 persons were
to be resettled (United Nations 2002, 32).
Both measurement and modelling data show that the rural populations were exposed to external doses 1.5-
times to 2-times higher than the urban populations living in areas with similar levels of radioactive
contamination (IAEA 2006, 11). The collective dose to the thyroid was estimated at 2.0E+06 persGy; about
half that dose by persons exposed in Ukraine (ibid., 120).
However, information on the extent of the radioactive contamination is still highly controversial. This can be
recognized by the divergent collective committed effective doses reported: 1° According to IAEA, the
collective committed effective dose (CCED) was 52,000 persSv for approximately five million residents over 20
years (IAEA 2006, 119). 2° According to the World Health Organization, the radio-induced CCED was > 91,000
persSv over 20 years (WHO 2019)5. 3° According to Bennet, a collective committed effective dose of 600,000
persSv impacted worldwide populations, 36% of which concerning inhabitants in former USSR, 53%
concerning European countries and 11% elsewhere in the northern hemisphere (Bennett 1995, 11; Bennett
1996, 125). 4° Eventually, Yablokov et al. (2009, 24) report that the CCED to be considered was between
600,000 and 900,000 persSv. In short, the spread is more than one order of magnitude.
The accident of 11 March 2011 in Fukushima had a smaller impact on habited areas compared to the
Chernobyl accident. This may be explained by a favorable meteorological situation, with winds contributing a
major part (about 75 %) of the radioactive emissions towards the Pacific Ocean (Aliyu et al. 2015). Therefore,
no evacuation measure for the 50 Million citizens in the Tokyo region had to be considered.

5WHO enumerates the number of people having received a dose higher than four levels of individual committed effective dose, which
makes: (240,000 * 0.1 Sv) + (116,000 * 0.033 Sv) + (270,000 * 0.05 Sv) + (5,000,000 * 0.01 Sv) = 91,328 persSv or > 91,000 persSv.
                                                                                                                                2
Biosphere Institute, Geneva, Strategic study n°2, May 2019, https://institutbiosphere.ch/eunupri_2019.html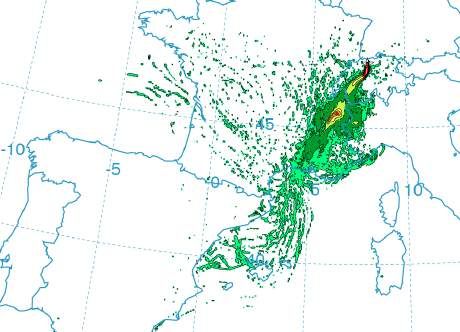
According to the official committee of the Japanese Parliament, an area of about 1,800 km2 had a
contamination level leading to an effective dose of 5 mSv per year or more (The National Diet of Japan
2012, 19)6. People located within a radius of 3 km around the plant were evacuated first, then the evacuation
zone was extended to a radius of 10 km and then to a further 20 km (ibid., 38). On 15 March, residents
between 20 and 30 km were ordered to remain, even though they faced high radiation levels (idem). These
residents were finally given the opportunity to leave the 30 km zone one month after 11 March (idem). All in
all, around 150,000 people were evacuated in response to the accident (ibid., 19). Mismanagement in the
evacuation process as well as the absence of implementation of countermeasure to the risk of a major
nuclear accident in Japan were the result of collusion between the government, the regulators and the
operator (ibid. 16). The conceit was reinforced by the mindset of Japanese bureaucrats dedicated at first to
the defense of the interests of their own organization (ibid. 9). Operators strongly influenced and lobbied the
Japanese energy policy and nuclear regulations, while letting the regulator bearing the eventual
consequences of the incompleteness of the rules (ibid. 43-44). In other words, they manipulated the cozy
relationship with the regulators to take the teeth out of rules and regulations, while abdicating their own
responsibilities (idem). Finally, the report of the official committee concludes that the Fukushima accident was
clearly ‘manmade’ (ibid. 16), which will lead us to study the human factor as a cause of risk (infra 1.5(iii)).

1.3 Ionizing radiation – health hazards – Importance of epidemiology, linear no threshold model
(LNT) and beyond
Health risks of ionizing radiation (IR) were first identified in the late 19th century (Edison 1896) (Doll 1995,
1339-1349). Groundbreaking studies on genetic effects due to IR have been performed by Muller in the early
twenties of last century (Muller 1928, 714). Quantitative aspects of health damages in humans due to IR
however only have been systematically analyzed since around 1950 – especially in the medical radio-
diagnostic field (Giles 1956, 447; Stewart 1958, 1495-1508; Pearce 2012, 499-505; Mathews 2013, f2360), in
the long-term studies in Japanese nuclear bomb survivors (Ozasa 2012, 229-243), in nuclear workers
(Richardson et al. 2015, h5359; Leraud 2015, e276-e281; Gillies 2017, 276-290), in people exposed to indoor
radon gases (Darby 2005, 223) and in children with respect to natural background radiation (Kendall 2013, 3-
9; Spycher 2015, 622-628).
The concept of collective dose calculation has been proven useful in IR risk estimations for exposed
populations (BEIR VII 2006a; BEIR VII 2006b, 1-4). Recent extensive epidemiological studies on medical effects
of IR even in the so-called low dose range (below 100 millisievert, mSv) have led to the presently widely
accepted LNT (Linear No Threshold) model (BEIR VII 2006a; BEIR VII 2006b, 1-4; Shore 2018, 1217). According
to LNT there is no harmless IR dose: Even very small doses of 1 mSv and below result in a risk for stochastic
health effects such as cancer induction, non-cancer diseases and detrimental effects on the reproductive
process.
The internationally legally binding limit of radio-contamination by artificial sources is 1 millisievert/year
(mSv/a) per person (infra 1.5(ii), 2.6(iii)). However, NPP accidents such as the 1986 in Chernobyl /Ukraine and
in 2011 in Fukushima/Japan led to IR exposures in the individual dose range mainly below 100 mSv or above
this level for many millions of residents (Cardis 1996, 241-271; WHO 2013; IPPNW 2016).
Apart from the above-mentioned basic literature, more in-depth references for assessing the health impact of
a major nuclear accident will be given in the section “methodology” (infra 3).

1.4 Five Swiss and French NPPs under scrutiny
(i) The five NPPs
Together, the five nuclear power plants evaluated in this this study have 9 reactors with a capacity ranging
from 1,097 MWth to 3,600 MWth. Three reactors have a power of less than 1,100 MWth (Beznau I & II,

6 However, it is difficult to calculate the long-term health impact of such doses, given the prohibition of independent investigations
into radioactivity levels around Fukushima (Kim et al. 2013; Fackler 2016). In any case, the contamination of the Pacific Ocean
represents the worst and still ongoing ecologic damage due to the Fukushima accident threatening the important Japanese fishery
industry as well as the whole pacific food chain.
                                                                                                                                    3
Biosphere Institute, Geneva, Strategic study n°2, May 2019, https://institutbiosphere.ch/eunupri_2019.html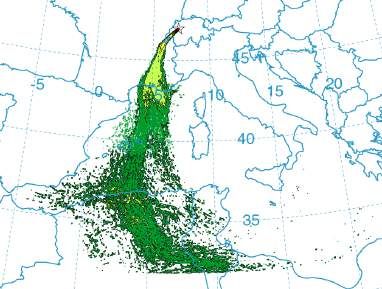
Mühleberg). Six reactors have a capacity between 2,785 MWth and 3,600 MWth: Bugey II, III, IV and V,
Leibstadt and Gösgen). Of the 9 reactors studied here, the least old is the Leibstadt reactor, which was
connected to the grid in 1984. Eight reactors have been operating for 40 years or more, such as Beznau I, which
    Table 1.1: The 5 NPPs and 9 nuclear reactors
    NPP              Reactors         Construc. & Grid c.     Reactor power       Capacity         Location   Close to   Decommissioning
    Name             No & Type        Year       Year             MWth             MWe             Country    Country         Date
    Beznau           2     PWR        1965-68    1969-71          1130              365              CHE        GER            (…)
    Bugey            4     PWR        1972-74    1978-99          2785            880-910            FRA        CHE            (…)
    Gösgen           1     PWR        1973       1979             3002             1010              CHE        GER            (…)
    Leibstadt        1     BWR        1974       1984             3600             1220              CHE        GER            (…)
    Mühleberg        1     BWR        1967       1971             1097              373              CHE      GER, FRA       2019.12
    Source: (IAEA 2018a)         Pressurized Water Reactor (PWR) and Boiling Water Reactor (BWR)

has been in operation for 50 years (it is the oldest operating reactor in the world). Their main characteristics
are briefly summarized in Table 1.1.

(ii) The 5 NPPs and conformity to present safety norms
A key problem of the Swiss NPP’s and the French Bugey NPP is their technical and physical aging (Majer 2014).
Also, whereas physically aging equipment has been regularly upgraded since the beginning of exploitation,
the technology of the plants has remained that of the years 1950-1960. Furthermore, defaults in the structure
of the reactors and other safety systems have not been corrected.
The best-known among these defaults are the fissures in the reactor core shroud of the Mühleberg reactor,
which have been discovered in the 1990ths and interpreted as a consequence of steel corrosion by the coolant
(ENSI & TÜV Energie 2009). Despite the presence of these cracks, the core mantle has not been replaced, but
only stabilized by a mechanical anchor system, and corrosion has been limited by chemical adds in the cooling
water.
Another example of uncorrected defaults has been identified in the reactor of the Beznau-1 NPP: In the
reactor pressure vessel about 1,000 cavities due to fabrication errors were detected in 2015 (Bishop 2015).
However, after a long period of inspection, the reactor re-started in 2017 without any replacement of the
pressure vessel.
All reactors of the 5 NPP’s have a record of nuclear events7. As an example, we will refer to the record of NPP
Leibstadt. The power plant is located in northern Switzerland on the shore of the Rhine-River which also
corresponds to the national border with Germany. The power plant is owned by six Swiss electricity
companies; ATEL has the maximum share of 27%.
The Planning of the power plant started in 1964 (KKL 2018), but several changes in the initial project resulted
in long delays and costs of 4.8 billion CHF. The plant was finally connected to the grid in 1984. Leibstadt has a
BWR-6 reactor of General Electric. The plant was initially exploited at a production level of 960 MW. From
1998 to 2003 this level increased in two stages up to 1,165 MW, and in a further stage, in 2012 to 1,275 MW.
In 2016, the consequences of dry-out where discovered on nuclear fuel elements, and reactor power had to
be reduced by order of the regulator.
NPP Leibstadt has a long history of incidents and management problems. Among these, we mention in
particular the following sequence:
• Fuel element damages and problems in staff management were known since the 1990s. Such damages are
  expressly mentioned in the activity reports of 1995 and 1997. The damages where explained later by
  fretting (friction induced damages) (ENSI 2019).
• In 1991, the nuclear safety authority HSK discovered falsified inspection reports (HSK 1991).
• An electric generator incident in the spring of 2005 was at the origin of a 6 months shut-down (ENSI 2005).
• In June 2014 a plant inspection discovered that the primary containment had been perforated for the
  purpose of mounting of a fire extinguisher in the year 2008 (ENSI 2014a).

7   See the reports of the nuclear safety authorities and the compilations on www.wikipedia.com.
                                                                                                                                           4
Biosphere Institute, Geneva, Strategic study n°2, May 2019, https://institutbiosphere.ch/eunupri_2019.html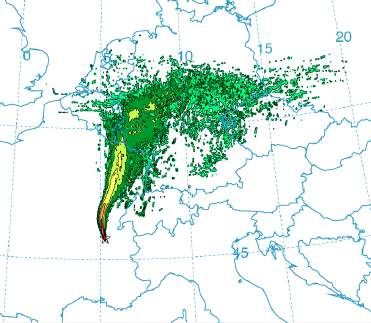
• This long-lasting incident was followed by another long lasting dry-out event, discovered in 2016, but that
   had lasted much longer, probably since 2011/2012. Consequently, the power plant had to stop production
   after several months (SRF 2017; ENSI 2017).
• The most recent incident happened in the spring of 2018, when a water pump of the emergency system
   was not fully available for 2 months (ENSI 2018).
• In another incident, once more, inspection reports were falsified by a collaborator of the NPP (ENSI 2019).
When considering the entire list of incidents and other problems during the exploitation, one has to consider
this NPP as one of the (or as the) most vulnerable nuclear plants in Switzerland.

1.5 Probability of a major nuclear accident in western Europe
This section aims to answer the question of whether the simulations of a major accident are relevant or not.
Practically, the question is whether the probability of a large core damage and the massive release of
radioactive material is ‘very unlikely’ and ‘remote’ (1 major accident for ≥ 1.0E+06 years of reactor operation),
as official authorities say (IAEA 2009, 8; 2018b, 45)? Or whether it is ‘unlikely’ (in the order of 1 accident per
1.0E+05 years)? Or would it actually be ‘possible’, in the order of 1 accident per 1.0E+04 years? And what
would that mean in our understanding of nuclear safety of NPP’s in general? Answer this question will decide
whether or not this study is relevant from the perspective of the respective strategies of the involved
countries.
We start by a brief presentation of the debate about the scientific validity of the probability numbers
published by official bodies and the nuclear industry.
(i) What are deterministic and probabilistic safety analyses?
The question of the probability of a major accident has been discussed by the scientific community, regulatory
bodies and above all by the IAEA (IAEA 2009, 2018b). The most widely accepted method for the evaluation of
a severe, or a major accident is called “deterministic safety analysis”. According to IAEA: “Safety analyses are
analytical evaluations of physical phenomena occurring at nuclear power plants, made for the purpose of
demonstrating that safety requirements, such as the requirement for ensuring the integrity of barriers against
the release of radioactive material and various other acceptance criteria, are met for all postulated initiating
events that could occur over a broad range of operational states, including different levels of availability of
the safety systems” (IAEA 2009, 7–8). Such analyses are completed by probabilistic safety analyses to identify
the sequences that lead to core degradation and also to quantify the more frequent sequences leading to
limited damage or no-damage scenarios (IAEA 2009, 7). They aim at identifying and quantifying the many
possible accidental sequences, through the use of event tree models that enable the determination of the
frequency of each accidental sequence (triggers and event paths) (IAEA 2009, 8; Wheatley et al. 2017, 99;
ENSI 2014b, 11). The Swiss Federal Nuclear Safety Inspectorate (hereafter ENSI) enumerates the following
initial events that may cause reactor failure: fire, explosion, turbine failure, flood, loss of cooling equipment,
failure of various systems, untimely activation of safety systems, accidental aircraft fall, tornadoes, plugging of
water intake, and earthquakes.8 It is admitted that well implemented Probabilistic Safety Analysis (PSA) is a
useful method to provide methodological support for the safety assessment and for improving the safety of
nuclear reactors (Löffler et al. 2017, 29) (infra iii).
(ii) Normative requirements
Table 1.2 summarizes the probability of a certain accident level in accident per year, to which NPPs should
comply. The IAEA criteria states that events having an expected frequency between 1.0E-04 and 1.0E-02
should not have a radiological impact outside an exclusion area (IAEA 2009). In a more recent publication it is
specified that in an “emergency exposure situation” the constraint shall be set between 20 to 100 mSv, and

8
  The appreciation of the probability of earthquakes has been modified since recent studies have shown that the
frequency of severe earthquakes is higher than previously assumed. Improvements have since been made to improve
resistance to seismic events. Although extreme earthquakes in Switzerland have a low frequency of occurrence, "an
earthquake exceeding the dimensioning thresholds cannot be excluded" (ENSI 2014b, 11). Such an earthquake could
cause a core meltdown accident and radioactive releases outside the affected nuclear power plant.
                                                                                                                 5
Biosphere Institute, Geneva, Strategic study n°2, May 2019, https://institutbiosphere.ch/eunupri_2019.html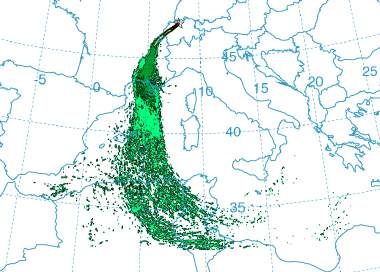
that in a “planned exposure situation” the dose constraint for the exposure of the public should not be
greater than 1 mSv per year (IAEA 2018b, 51).
Table 1.3 shows how Article 123(2) of the Radiological Protection Ordinance of the Swiss Federal Council sets
the limit of exposure in the range defined by IAEA (Swiss Federal Council 2019 Art. 123(2)(c)(d)). The expected
frequency of any event serves as a criterion for setting the limit of different committed effective doses
expressed in mSv. If Article 123(5) enjoins the supervisory authority (ENSI) to define the methodology and
boundary for the analysis of failure conditions in vague terms, another text specifies its content. The Nuclear
Energy Ordinance specifies that “each risk assessment must incorporate an up-to-date, plant-specific
probabilistic safety analysis (PSA) (Swiss Federal Council 2004 Art. 33(1)(a))”, considering internal or external
events able to trigger large releases of radioactive substances into the atmosphere, as well as a quantitative
evaluation of preventive mitigating measures (Swiss Federal Council 2004 Annex 3(2), Technical documents
on PSA).

 Table 1.2. Probabilities of an accident and the related              Table 1.3. Probabilities of an accident and the related
 normative criteria (IAEA)                                            normative criteria (Swiss Federal Council)
 Occurrence           Characteristics   Criteria                      Expected frequency     Criteria
 1.0E-04 – 1.0E-02    Possible          No radiological impact        1.0E-04 – 1.0E-02      The dose resulting from a single such event for
                                        outside the exclusion area                           members of the public must not be greater
                                                                                             than 1 mSv.
 1.0E-06 – 1.0E-04    Unlikely          Radiological impact           1.0E-06 – 1.0E-04      The dose resulting from a single such event for
                                        outside the exclusion area                           members of the public must not be greater
                                        within limits (20-100 mSv)                           than 100 mSv; the licensing authority may
                                                                                             specify a lower dose in individual cases
  1.0E-06 year per reactor, (ii) they won’t create a
public exposure > 1 mSv while the ‘expected frequency’ of the event is between > 1.0E-04 and < 1.0E-2 year
per reactor. In some respects, they would be ‘allowed by law’ to release doses > 100 mSv in the event of an
accident with an expected frequency < 1.0E-06 year per reactor (infra 2.6(iii)).
To conclude this point, the PSAs of the five NPPs under scrutiny in this study have to satisfy the above-
mentioned limits. However, for newly built plants, plant specific core damage frequencies (CDFs) without
notable radioactive releases obtained by PSA have to comply with the limit of 1.0E-06 per reactor-year, rather
than the former usual limit of 1.0E-04 per reactor-year (Sornette et al. 2013, 61).
(iii) Structural shortcomings of PSA
A certain arbitrariness lies behind PSA that causes analysts’ predictions to be altered by structural
shortcomings. As stated in the report subsidized by the European Commission and coordinated by IRSN
(Institut de Radioprotection et de Sûreté Nucléaire), PSA models – as well as advanced approaches such as
dynamic PSA, fuzzy probability approaches, or multi-state Markov-process modelling – do not include certain
parts of the risk, either intentionally or due to lack of knowledge (Löffler et al. 2017, 12). PSA models suffer
from lack of data, incompleteness, insufficient methods for the assessment of some human actions (Löffler et
al. 2017, 29–30). Additionally, as recognized by the Swiss official body ENSI and the study coordinated by the
French official body IRSN, industrial sabotage, or terrorist attacks, such as willful plane crashes or acts of war
are not taken into accounts by PSA (ENSI 2014b, 11–12; Löffler et al. 2017, 65). These considerations can also
be put into perspective with the fact that the conception of none of the 9 reactor pressure vessels under
scrutiny have benefited from the lessons drawn by the Three Mile Island, Chernobyl, and Fukushima accidents
(supra 1.4). Ageing and outdated pressure vessels would therefore worsen the consequences of willful acts
due to the so-called human factor that PSA ignore almost systematically. In other terms, since PSAs include
neither the wide range of human malignity nor administrative and political negligence they are not suited to
specify the risk related to NPPs.
In addition, empirical evidence seems to confirm the inability of PSA to specify the whole truth about the risk
of a major nuclear accident (infra).
                                                                                                                                                6
Biosphere Institute, Geneva, Strategic study n°2, May 2019, https://institutbiosphere.ch/eunupri_2019.html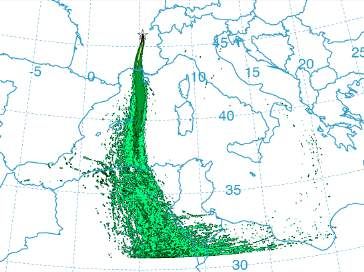
(iv) Is there any empirical evidence of PSA shortcomings?
According to the literature, probabilities calculated in PSA do not fit the experienced frequencies of major
reactor failures. The French Institut de Radioprotection et de sûreté nucléaire (IRSN) pointed out that severe
accidents with core damage have happened more often than predicted by PSA analysts (Löffler et al. 2017,
28). Furthermore, several independent studies have performed statistical analyses of historical data through a
“bottom-up” approach and have almost universally found that PSA dramatically underestimates the risk of
accidents (Wheatley et al. 2017). On the one hand, several studies have observed four large releases in
around 14,500 operating-years (depending on the date of assumption), which makes about 1 large release per
4,000 operating years (2.5E-04) instead of the PSA probability limit of < 1.0E 06) (Lelieveld et al. 2012; Piguet
2015); the discrepancy with PSA is a factor of 250. On the other hand, these historical data do not predict the
future occurrence of significant releases, since the safety standards of nuclear power plants have evolved
over the seven decades of their history (Rangel & Lévêque 2012, 90).
(v) What could be the probability of a major nuclear accident in the 5 NPPs and the related 9
reactors?
The vast majority of existing reactors in the world pertains to the so-called Generation II and were developed
and built between the 1960s to the 1990s. Only Generation III reactors adopted passive safety features
instead of active ones (requiring power) (Wheatley et al. 2017, 105). As a matter of consequences, a statistical
approach should take into account the historical trend in a wide range of accidents and historical safety
improvements (Rangel & Lévêque 2012, 96). The historical approach goes beyond the PSA and, although far
from being perfect, it is better suited to protect the public interest than the PSA (as well as to protect the
insurer’s interest). We summarize two important articles among several others below.
According to Rangel & Lévêque (2012, 92), such a purpose requires extending the observations to accidents
with levels ≥ level 3 INES and to use a model called Poisson Exponentially Weighted Moving Average
(PEWMA) suited for studying time series. This model is more suitable than other statistical models due to the
fact that nuclear reactors are in operation for a long lifetime, and the fact that innovations take time to be
installed by operators (ibid., 97). As a result, when looking at the core meltdown accidents (with or without
large releases), it appears that the expected frequency can be estimated at 1.95E-03 per reactor-year9, a
number considerably higher than 2.00E-05 determined by Gaertner on US reactors through PSA (Gaertner et
al. 2008, 3), and twenty times higher than the 1.0E-04 IAEA criterion for a release corresponding to a
population dose of < 1mSv. These results are corroborated by another study (infra).
Wheatley et al. have analyzed the occurrence of a major accident using a more complete and unique data set
containing 216 events; 175 of which have cost values (Wheatley et al. 2017, 102). Estimating cost aims to
encompass total economic losses, including environmental remediation, court and insurance claims, and loss
of life, estimated at 6 Mio USD per death. This has the advantage of reaching a single metric in USD combining
all possible negative effects of accidents (albeit not without imperfection) (Wheatley et al. 2017, 102).
Eventually, the analysis shows that, in terms of costs, there is a 50% chance that (i) a Fukushima accident (or
larger) occurs once in 62 years, and (ii) a Three-Mile-Island accident (or larger) occurs once in 15 years (under
the assumption of a constant number of NPPs) (Wheatley et al. 2017, 112). If we consider the 448 operational
reactors in the world in year 2017 (IAEA 2018a, 15), the risk of a Fukushima event occurring with large release
is roughly 1.8E-05 per reactor-year, a figure 18 times higher than the maximum permissible probability of one
large radioactive release per 1,000,000 reactor-years as set by IAEA and other official bodies (IAEA 2009, 8;
2018b, 45).
All in all, many other bibliographic sources (Ha-Duong & Journé 2014; Sornette et al. 2013) show that such
kind of statistical methods are widely explored among scholars finding similar results. The gap between the
historical approach and PSA can be explained by the numerous limitations of the latter (supra 1.5(iii)).
Therefore, the probability per reactor and per year of a major accident evaluated at 1.8E-05 by Wheatley et
al. likely describes the expected frequency of a major nuclear release by one among the 9 above reactors.

9 (Rangel & Lévêque 2012, 96) The article provides four main results through four methods, (i) MLE Poisson (6.66 10-4), (ii) Bayesian
Poisson-Gamma (4.39 10-4), (iii) Poisson with time trend (3.2 10-5), (iv) PEWMA model (1.95 10-3). The authors give precedence to the
latter model and result over the three other approaches.
                                                                                                                                   7
Biosphere Institute, Geneva, Strategic study n°2, May 2019, https://institutbiosphere.ch/eunupri_2019.html
If one would consider such a probability at the scale of the fleet of 9 reactors for an operational time of 50
years, one would discover that such ‘catastrophe’ has a probability of 0.8% (Table 1.4)10. IAEA itself
categorizes such level of risk as “possible” (IAEA 2009, 8), which means it is neither “remote”, nor “very
unlikely” as it should be, nor even “unlikely”. It is “possible”. In other words, to know what a major nuclear
accident would imply for the Swiss and European people becomes a strategical question, besides an ethical
one11.
 Table 1.4. Probability of a major nuclear release during the operating time of a fleet of 9 reactors designed – and
 connected to the grid for 8 of them – before or during 1979, year of the Three Mile Island Accident
                                               Probability of a major accident    Probability of a major accident    Probability of a major accident
 Source:                                          for 1 reactor over 1 year      for 1 reactor over 1 year    (%)   for 9 reactors over 50 years (%)

     1.8E-05 is from Weathley et al. 2017.                1.8E-05                           0.0018%                             0.810%

           The norm ≤ 1.0E-06 is from IAEA*.             ≤ 1.0E-06                         ≤ 0.0001%                           ≤ 0.045%
 * According to the law, IAEA and many regulators, in case of a major nuclear release entailing a committed expected dose ≥100 mSv, the expected
 frequency of the initiating event should not overpass a probability of 1.0E-06 as calculated by a probabilistic safety analysis (PSA).

1.6. Existing studies on the simulations of the impacts of major accidents in European NPPs
Lelieveld et al. (2012) assessed the exposure to an INES 7 major accident, using particulate 137Cs and 131I as
proxies for the fallout. Their results notably indicated that the average surface area in which ≥ 40 kBq of 137Cs
would be deposited would be about 165,000 km2. Using a global model of the atmosphere, they found that
more than 90 % of the 137Cs release would be transported beyond 50 km.
A study using the Lagrangian particle model FLEXPART has explored systematically the consequences of a
major nuclear accident in NPPs. It was found that substantial consequences (intervention measures) occur
frequently for a distance range of up to 100-300 km, and that emergency planning often focuses on too small
areas (Seibert et al. 2013).
Two experts from the official and French Institut de Radioprotection et de Sûreté Nucléaire (IRSN) have issued
a study on a core meltdown in a French 900 MWe PWR followed by (i) a severe radioactive release and (ii) a
massive radioactive release (Pascucci-Cahen & Patrick 2012, 1–9). On average, a major accident of this size
could cost more than € 400 billion, which can be compared with the cost of a large economic crisis, or to the
cost of waging a regional war (ibid., 1–9). The cost would be supported by the whole population of France and
around 100,000 persons could be in need to be permanently relocated (ibid., 1–9).
The Federal Nuclear Safety Inspectorate (ENSI) issued a report in the wake of the Fukushima accident. The
report briefly presents the components of simulations of different types of nuclear accidents in Switzerland in
order to understand their dangers (ENSI 2014b). The aim is to produce figures illustrating the health pressure
on populations in order to prepare emergency planning in the vicinity of nuclear power plants. In concrete
terms, level 7 accidents according to the International Nuclear and Radiological Event Scale (INES) are detailed
in 3 sub-categories: A4, A5, A6. Category A5 would correspond to an accident of Fukushima's severity level
and A6 of Chernobyl's severity level. Accidents are simulated for Iodine, Cesium and rare gases.
• Accident A5: iodine: 1017 Bq, cesium (class Rb-Cs): 1016 Bq, rare gases: 100% release.
• Accident A6: iodine: 1018 Bq, cesium (class Rb-Cs): 1017 Bq, rare gases: 100% release.
The report illustrates the health pressure with graphs showing the number of millisieverts received for
different categories of the population according to their distance from the affected nuclear power plant. In
particular, we learn that in the event of an A5 accident, the effective dose is 2,000 mSv for an adult staying
unprotected for 48 hours at 2 km from the accident, and 150 mSv at 20 km (ENSI 2014b, 22-23). The report

10  The question remains open whether the 9 reactors comply with the precautionary measures that are required by law, “in
accordance with experience and the state of art in science and technology” (Swiss Federal Assembly 2018) Article 4(3)(a)). It is the
third principle of the chapter entitled “Principle of nuclear Safety”.
11 If one remained totally confident about the completeness of PSA made by ENSI, IAIA or other regulators, he might be amazed by

very simple numbers about a potential major accident that the norm aims to avoid. He would discover that a probability per reactor
and per year established at 1.0E-6 would rise at 4.5 10-4 (0.045% or 0.45 ‰) for a fleet of 9 reactors in operation for 50 years. It is
‘possible’.
                                                                                                                                                   8
Biosphere Institute, Geneva, Strategic study n°2, May 2019, https://institutbiosphere.ch/eunupri_2019.html
also quantifies the dose to the thyroid as a function of accident level, distance and age. It evaluates the
influence of weather on the doses received (ENSI 2014b, 25-26).
It is noticeable that the above reports say nothing about the number of people affected (cases of cancer and
cardiovascular disease), and they do not say how many people could be displaced and what can be the overall
impact on the country – with the exception of the Pascucci-Cahen & Patrick document. They raise nonetheless
many questions that the present article intends to address.
II Methodology
2.1 Outline of the methodology questions
A few methodological points are discussed below: the quantities of Becquerels used in the simulations (source
term study) (infra 2.2); the physical coefficients of the dispersion of rare gases and aerosols in the atmosphere
(deposition velocity, in-and below-cloud removals, the Henry's constant) (2.3); the consideration of
meteorological data and their influence on the results (2.4); the assessment of impacted people, soils and
countries using a Geographic Information System (2.5); the calculation that allows to use Becquerels to
calculate the collective committed effective dose (CCED) received by the populations and the calculation
performed to compare individual CED to the legal limits in mSv (2.6); the health impact and the related
number of radio-induced diseases (2.7).
With these points, the study can be described as interdisciplinary.
2.2 Source term
(i) The release question
This section aims to define the amounts of nuclides that could possibly be released from the reactor pressure
vessel into the containment building and, more specifically, outside the containment building (source term).
Table 2.1. Comparisons of two different assessments of
The list of nuclides and their respective
the source term of Chernobyl and Fukushima quantities depends on the type of reactor and
respectively the kind of accident. If we look at the respective
Fukushima: Factors Chernobyl: Factors inferred release profiles of Chernobyl and Fukushima
inferred from IAEA*. from OECD/IAEA**.
From the lowest to the From the lowest to the
(Table A1 in the Annex), the releases from the
highest IAEA estimates. highest estimates. lanthanide and cerium groups would be
Nuclides Factor Factor between 700 to 9,700 times higher at Chernobyl
Ba-140 18.2 22.7 than during the Fukushima event (IAEA 2015, 7).
Cs-134 6.0 68.2 By contrast, the aerosols release would be only
Cs-137 2.9 3.0
9-times higher at Chernobyl compared to
I-131 4.0 1.7
Fukushima if one takes into accounts the relative
Ru-103 9.5 26.2
Ru-106 1.0 19.1
importance of each nuclide in the source term12.
Sr-89 302.3 27.4
Important discrepancies can be found between
Sr-90 42.4 20 the two major accidents when looking at the
Te-132 213.2 3.1 details. The factors range from 1.6 (134Cs), 6.3
Weighted 5.6 6.7 (137Cs), 7 (131I), 14 (132Te), 140 (90Sr) to 4.3106
average
and 3.5107 for (103Ru) and (106Ru) respectively13.
* Data inferred from IAEA (2015) (IAEA 2015, 7)
If we look at table A2 in the Annex, in relation to
** Data inferred from OECD (Devell et al. 1995, 23) and IAEA (IAEA 2015, 7)
the assessment of the Fukushima accident, the
factors from the lowest to the highest estimates are the following: 1 for 6 data, ≥ 2 for 17 data, ≥ 4 for 14
data, ≥ 6 for 12 data, ≥ 40 for 6 data, ≥ 100 for 5 data, and ≥ 3,600 on the last line of the list.
Furthermore, depending on the methods used for estimating the release of one major accident, the figures
can be quite different as shown in Table 2.1. A comparison between the respective data of OECD and IAEA
shows that there are large discrepancies between these two bibliographic sources on the Chernobyl releases,
12 The comparisons are made through the numbers of the average Fukushima release which we have computed from the low and high
IAEA estimations.
13 We inferred these numbers from: (IAEA 2015, 7)
9
Biosphere Institute, Geneva, Strategic study n°2, May 2019, https://institutbiosphere.ch/eunupri_2019.html
a situation which is globally comparable to the Fukushima one as it has been assessed by IAEA, even if the
detail of the profile differs depending on the isotope considered.
(ii) Literature on the source term of the 5 NPPs
The core inventory of the Swiss NPPs, as well as the four French reactors at Bugey, have not been published
by official bodies. A study with the purpose to shed light on the impact of possible nuclear accidents needs to
infer the figure from other bibliographic sources. First, some analogies can be built in order to infer what they
can be. For instance, Lelieveld et al. assumed that the potential release of any reactor can be scaled to the
Chernobyl accident through its gross capacity (Lelieveld et al. 2012).
Second, we had to find data in the literature and we focused mainly on the figures of the Flexrisk Report
(Seibert et al. 2013), of the Oeko-Institut Darmstadt (Ustohalova et al. 2014), and the U.S. Nuclear Regulatory
Commission (NRC) (Hanson et al. 1994).
• The Flexrisk project published few data on the source term of 88 European NPPs having between 1 and 4
  reactors, with the exception of 4 Russian NPPs having 5 or 6 or – in two cases – 8 reactors (Seibert et al.
  2013). The figures of this bibliographic source covers the 9 reactors of our study and the following
  nuclides: 133Xe, 131I, 137Cs, 90Sr et 106Ru (Seibert et al. 2013).
• The second bibliographic source covers three Swiss NPPs and provides data for some of the remaining
  nuclides: 140Ba, 134Cs, 136Cs, 89Sr, 127mTe, 129mTe (Ustohalova et al. 2014).
• The publication of the NRC documents the possible release of 60 nuclides. It is dedicated to the study of
  different types of nuclear power plants (Hanson et al. 1994), which allows one to quantify any radioactive
  release from a nuclear power plant with the same characteristics. Since each of the nine reactors is built
  on principles similar to at least one of the American reactors, by analogy, it becomes possible to derive the
  potential release of the nine reactors from the corresponding American reactor.
Analogy between the reactors are perfect for Leibstadt and Mühleberg, quite good for Beznau and Bugey, and
acceptable for Gösgen (Table 2.2).

Table 2.2. Analogies between the 5 NPPs and the well-documented U.S. reactors
Country    Type      Name                     MWth        Additional characteristics               Constructor
Swiss      PWR       Beznau I & 2              1130       WH 2LP                                   WH = Westinghouse
US         PWR       Surry 1 & 2               2587       WH 3LP (Dry Subatmospheric)              WH = Westinghouse
Swiss      PWR       Gösgen                    3002       PWR 3 Loop (wet type cooling power)      KWU=Kraftwerkunion (D)
US         PWR       Surry 1 & 2               2587       WH 3LP (Dry Subatmospheric)              WH = Westinghouse
France     PWR       Bugey 1,2,3 & 4           2785       CP0 & PWR 3 Loop                         Framatome / Westinghouse licence
US         PWR       Surry 1 & 2               2587       WH 3LP (Dry Subatmospheric)              WH = Westinghouse
Swiss      BWR       Leibstadt                 3600       BWR-6 (Mark 3)                           GE = General Electric
US         BWR       Grand-Gulf                4408       BWR-6 (Mark 3)                           GE = General Electric
Swiss      BWR       Mühleberg                 1097       BWR 4 (Mark 1)                           GE = General Electric
US         BWR       Peach Bottom 1 & 2        3951       BWR 4 (Mark 1)                           GE = General Electric
IAEA International Atomic Energy Agency, Nuclear Power Reactors in the World (IAEA 2018a)
.

The release scenario displayed by the NRC is not given with the same accuracy since the scenario compatible
with a major accident is not detailed for each reactor. On the one hand, the analogy would lead to
underestimated figures for at least 1 out of 5 NPPs (Leibstadt). On the other hand, not drawing an analogy
with these data would aggravate the underestimation of the global release (source term). Thus, we decided to
integrate underestimated data since it gives an insight on what is missing on the potential sources of
underestimation (on the possible underestimation of 134Cs, infra 4.3).
(iii) Definition of the source terms for one reactor in each of the 5 NPPs
For each NPP, the amount of the release is estimated for one reactor. Finally, it has been decided to define
the list of nuclides to examine from the NRC (Hanson et al. 1994), then to respect systematically the following
rule (for each NPP):
   1° To select the numbers of the 5 nuclides published by Flexrisk on the 5 NPPs of this study.

                                                                                                                                      10
Biosphere Institute, Geneva, Strategic study n°2, May 2019, https://institutbiosphere.ch/eunupri_2019.html
When these data do not cover the remaining nuclides on the list:
2° To select the numbers of Ustohalova et al. (2014) on the 6 following nuclides: 140Ba, 134Cs, 136Cs, 89Sr,
127m
Te, 129mTe.
If the latter data are not available for the remaining nuclides on the list:
3° To select the numbers we deduced from the NRC.
If the numbers defined in 1° and 2° are not consistent with NRC’s framework:
4° To adjust (reduce) the amounts which would exceed the released fraction of each group of isotopes
defined by the NRC as high.
We do not integrate the half-life time period in the simulation of the cloud. As many nuclides have a short
half-life, we could have overestimated the impact on health. To limit that effect, we excluded from the
calculation isotopes with a half-life less than the simulation period of the radioactive cloud (i.e. < 72h).
5° Consequently, exclude from the source term nuclides with a half-life below 72h.
As the detailed scenario RGG3 (Gran Gulf) is far from matching a major accident, we increased slightly the
figures of a release at Leibstadt with respect to the higher scenario RGG1 whose release fractions are
published for each group of nuclides: iodine, cesium, tellurium, strontium, barium, ruthenium, lanthanium
and cerium (Hanson et al. 1994, Table A11).
We therefore verified that the figures given by the
Table 2.3. Summary of the simulations: Becquerels Flexrisk report (Seibert et al. 2013) and Ustohalova
released and duration
NPP CLOUD Total Duration Per Hour
(2014) were compatible with the highest release
Amount of the Release fractions given in an aggregated way by the NRC
Released Release (Hanson et al. 1994: tables A7, A10, A11). We thus
Type Name Type Bq h Bq had to reduce the figures whenever the total of a
PWR Beznau Rare Gas 2.211E+18 0.5 4.4224E+18 radionuclide group considerably exceeded the
PWR Beznau Aerosols 5.647E+17 2.0 2.8237E+17
maximal amounts defined by the NRC for each NPP.
PWR Beznau Refractor. 1.148E+16 2.0 5.7399E+15
Consequently, the amount of 132Te defined for
PWR Bugey Rare Gas 5.152E+18 0.5 1.0304E+19 Leibstadt by Flexrisk is reduced from 7.54E+17 to
PWR Bugey Aerosols 1.619E+18 2.0 8.0945E+17 3.47E+17 (about -50%). The objective was to limit
PWR Bugey Refractor. 2.829E+16 2.0 1.4147E+16 the released fraction of the Tellurium group at 4.8%
PWR Gösgen Rare Gas 4.704E+18 0.5 9.4076E+18 of the core inventory, according to scenario RGG1
PWR Gösgen Aerosols 1.116E+18 2.0 5.5785E+17 (Hanson et al. 1994: table A.11). Similarly, for
PWR Gösgen Refractor. 3.050E+16 2.0 1.5249E+16 Mühleberg, the amount of 137Cs is reduced from
BWR Leibstadt Rare Gas 7.498E+18 0.5 1.4997E+19 8.7E+16 Bq to 6.55E+16 Bq (-25%). The aim was to
BWR Leibstadt Aerosols 1.120E+18 4.0 2.8006E+17 make the released fraction of the group of alkali
BWR Leibstadt Refractor. 4.965E+16 4.0 1.2413E+16 metals does not exceed 40% of the related core
BWR Mühleb. Rare Gas 2.282E+18 1.0 2.2824E+18 inventory, as specified for the scenario RPB6 (ibid.:
BWR Mühleb. Aerosols 1.187E+18 4.0 2.9681E+17 table A.10). Eventually, the duration of the different
BWR Mühleb. Refractor. 1.081E+17 4.0 2.7031E+16 releases was defined in accordance with Tables A7,
For more details, see Table A3 in the Annex A of these article. See also A10, A11 (ibid.). The final result of this stage is
table A7, A10 and A11 in Hanson (1994). summarized in Table 2.3.
For more details on the final selection of the potential release from the five NPPs, see table A3 in the Annex A.
In this table, the releases of the different NPPs are edited in Becquerels. The bibliographic source is indicated
at the right of the table. The different isotopes are dispatched in three groups according to their respective
deposition velocities (infra 2.3).
(iv) Comparison with the source terms of Chernobyl and Fukushima
The remaining question is, to what kind of historical nuclear disaster the accident models of this study can be
compared?
In order to get some representation of this point, Table 2.4 compares the potential releases of the different
NPPs to the Chernobyl accident. The figures express the following ratios: Beznau (Bq) /Chernobyl (Bq); Bugey
(Bq) /Chernobyl (Bq); etc. It is shown that the release of aerosols is 6-times to 2.3-times less than from the
Chernobyl accident.
11
Biosphere Institute, Geneva, Strategic study n°2, May 2019, https://institutbiosphere.ch/eunupri_2019.htmlTable 2.5 displays the previous data through their potential damage. Potential releases of the different NPPs
are compared with the Chernobyl accident. The data are expressed as a ratio of the potential Sieverts. Insofar
as the numbers are connected to Sv, they express a potential impact on people. This, however, is a theoretical
value because it does not take the population density into account.
Table 2.6 provides a comparison in Becquerel with Fukushima. The releases of aerosols in our accident models
are between 1.4-times and 3.9-times the Fukushima release and, on average, 2.7-times. With reference to
refractories, the important difference to Fukushima is due to the way Hanson et al. defined a major accident.
Table 2.7 provides a comparison in Sieverts with Fukushima. The releases correspond to 1.4-times to 4.3-
times the Fukushima release and, on average, 2.8-times.
Table 2.8 tells the same story as Tables 2.5 and 2.7, but the primary sources for Chernobyl come from OECD
(Devell et al. 1995). Here the figures are highly diverging from IAEA.
Table 2.4. Potential release of radioactiviy (Bq): Table 2.5. Potential desease impact: comparison
comparison between the 5 NPPs and Chernobyl between the 5 NPPs and Chernobyl (Chernobyl primary
(Chernobyl primary source from IAEA 2006 + 2015) source from IAEA 2006 and IAEA 2015)
Bez. to Bug. to Goe. to Lei. to Mue. to Bez. to Bug. to Goe. to Lei. to Mue. to
Cherno. Cherno. Cherno. Cherno. Cherno. Cherno. Cherno. Cherno. Cherno. Cherno.
Categories Bq/Bq Bq/Bq Bq/Bq Bq/Bq Bq/Bq Categories Sv/Sv Sv/Sv Sv/Sv Sv/Sv Sv/Sv
Rare gas 0.34 0.79 0.72 1.15 0.35 Rare gas 0.34 0.79 0.72 1.15 0.35
Aerosols 0.15 0.43 0.29 0.30 0.32 Aerosols 0.15 0.49 0.33 0.30 0.31
Refractor. 0.05 0.13 0.14 0.22 0.49 Refractor. 0.02 0.06 0.06 0.12 0.37
Table 2.6. Potential release of radioactiviy (Bq): Table 2.7. Potential sanitary impact: comparison
comparison between the 5 NPPs and Fukushima between the 5 NPPs and Fukushima (Fukushima primary
(Fukushima primary data from IAEA 2015) data from IAEA 2006 and IAEA 2015)
Bez. to Bug. to Goe. to Lei. to Mue. to Bez. to Bug. to Goe. to Lei. to Mue. to
Fukush. Fukush. Fukush. Fukush. Fukush. Fukush. Fukush. Fukush. Fukush. Fukush.
Categories Bq/Bq Bq/Bq Bq/Bq Bq/Bq Bq/Bq Categories Sv/Sv Sv/Sv Sv/Sv Sv/Sv Sv/Sv
Rare gas 0.25 0.57 0.52 0.83 0.25 Rare gas 0.24 0.57 0.52 0.83 0.25
Aerosols 1.36 3.93 2.66 2.79 2.93 Aerosols 1.36 4.33 2.95 2.62 2.75
Refractor. 244 600 647 1 054 2 295 Refractor. 47 116 125 248 776
Table 2.8. Potential desease impact: comparison
between the 5 NPPs to Chernobyl (Chernobyl primary
data from OECD – Devell et al. 1995)
Bez. to Bug. to Goe. to Lei. to Mue. to
Cherno. Cherno. Cherno. Cherno. Cherno.
Categories Sv/Sv Sv/Sv Sv/Sv Sv/Sv Sv/Sv
Rare gas 0.0238 0.0757 0.0516 0.0458 0.0482
Aerosols 0.0003 0.0007 0.0008 0.0016 0.0050
Refractor. 0.0003 0.0007 0.0008 0.0016 0.0050
To conclude this point, the different comparisons between the five NPPs with Chernobyl and Fukushima show
that the simulation of major accidents in the present study is situated between the two historical events.
2.3 Deposition velocity in- and below-cloud wet removal of different nuclides
(i) Framework
The user of Hysplit has to specify the deposition velocity of rare gas, aerosols, and particles that are rejected
by a source and dispersed by winds. Furthermore, Hysplit requires the in- and below-cloud wet
removal/scavenging parameters and, for soluble gases only, the Henry’s constant (Draxler et al., 2018). As
these parameters are partly dependent from weather condition, the numbers to be found are indicative and
managed by Hysplit accordingly.
(ii) Review of the literature
We give below a short review of the literature on the subject in order to specify below how we aggregated
the different isotopes in three clouds.
12
Biosphere Institute, Geneva, Strategic study n°2, May 2019, https://institutbiosphere.ch/eunupri_2019.html133
• Rare gases: The main rare gas with a half-life above 72h is Xe. According to Tinker and al., there is no
wet or dry removal mechanism for Xe-133 (Tinker et al. 2010). Xenon has no deposition velocity and the
related descriptor has to be set-up at ‘0’ (m/s) (Bianchi et al. 2018). The Henry’s constant for Xenon can be
established at 4.2E-05 (mol/m3 Pa) (Sander 2015).
• Cesium: The dry deposition velocity of 137cesium is given by the Hysplit dispersion program at 0.001 (m/s)
(A. Stein et al. 2015). However, Guglielmelli et al. (2016) set 0.002 (m/s). Direct observation on the
Fukushima accident leads to consider the figure of 0.001 (m/s) is robust for 137Cs, 136Cs and 134Cs (Takeyasu
& Sumiya 2014). Wet removal/scavenging in- and below-cloud is set at 8.0E-05 (1/s) by Hysplit for 137Cs.
For this same isotope, wet in- and below-cloud removal is estimated at 3.5E-05 (1/s) (Guglielmelli et al.
2016), or even at 3.36E-04 and 8.4E-05 respectively (Leadbetter et al. 2015).
• Iodine can be released as gas, aerosol, or both. Considering the uncertainty for the fraction of each form,
the Flexrisk report subsumed all iodine under the aerosol species (Seibert et al. 2013). We adopt the same
approach and look at the deposition velocity and wet removal accordingly. For the aerosol form of iodine,
Hysplit puts deposition velocity at 0.001 (m/s) and sets wet removal/scavenging in- and below-cloud at
4.0E-05 (1/s) (Stein et al. 2015).
There are few additional figures on the two parameters that we aim to define. No synthetic information is
available on the behavior of the radionuclides in the atmosphere (Doi et al. 2013), and data uncertainties of
the Fukushima accident do not assist in determining the best physical parameterization of the dispersion of
radionuclides (Mathieu et al. 2018). ENSI admits nonetheless, that the deposition velocity can be given for all
aerosols (ENSI 2009, 64).
For all aerosols: the deposition velocity is set at 0.0015 (m/s) (ENSI 2009, 64) and the in- and below-cloud
removal/scavenging is set at 7.0E-05 (1/s) (ENSI 2009, 65). The latter figures are close to the abovementioned
ones on cesium and iodine.
The question is whether the same coefficient for all aerosols can also be used for tellurium and strontium. In
order to confirm the point, the ratio Sr/Cs and Te/Cs should be constant in different impacted areas after a
nuclear accident (although it may differ for other reasons). Rosenberg et al. found that the ratio 90Sr/137Cs was
about the same although the small number of samples makes it difficult to ascertain that their dispersion is
similar (Rosenberg et al. 2017). Yanaga & Oya (2013) found that the ratio of 132Te to 137Cs was approximately
constant in Shinzuoka-city (200 km southwest of Fukushima). However, this finding is not confirmed
elsewhere and the opposite might be possible (Doi et al. 2013).
Refractory: the deposition velocity of refractory should have a specific number. Draxler states that the
deposition velocity of heavy particles can be set at 0.01 (m/s) in Hysplit (Draxler & Rolph 2012). The in- and
below cloud removal is more problematic. According to Baklanov & Sørensen (2001, 792), the washout
coefficient could be determined by particle size: ''the washout coefficient for particles of about 0.4 or 1.2 µm
is two orders of magnitude smaller than that of particles equal to 4 µm". If we infer the refractory group from
the example of plutonium, which could be about 4 µm, compared to cesium (0.68 µm) and tellurium (0.81
µm) (ibid. 2001, 788), we can assume that, for refractories, the in- and below-cloud wet removal should be set
at 7.0E.03 (1/s) (instead of 7.0E-05 (1/s) for aerosols)14. Such an assumption is indicative to the extent the size
of particles could be modified by several factors.
(iii) Deposition velocities on different types of grounds
The different kinds of land cover have different abilities to capture radioactive particles. For instance, Sehmel
quoted by Takeyasu & Sumiya (2014) give the deposition velocity for 137Cs: 0.0003 – 0.0015 m/s for water,
0.0001 – 0.0009 m/s on ‘soil’, and 0.002 – 0.005 m/s on grass. These figures nonetheless cannot be
generalized. Müller & Pröhl (1993) quoted by Baklanov & Sørensen (2001, 789) gave – for aerosol bound
radionuclides – a deposition velocity at 0.0005 m/s in case of deposition on ‘soil’, at 0.0105 m/s for deposition
on grass and at 0.0005 m/s on trees, knowing that such figures depend on the size of the deposited particles
as well as on the size and development of the foliage of trees. Due to the high complexity and the lack of a
14The impact of this hypothesis on the final result is very small. 1° The different tests we carried on with different coefficients did not
lead to significant changes in the cloud map. 2° Compared to aerosols, the importance of the refractories on the total collective
committed dose is very limited.
13
Biosphere Institute, Geneva, Strategic study n°2, May 2019, https://institutbiosphere.ch/eunupri_2019.htmlYou can also read