Petrophysical and mechanical rock property database of the Los Humeros and Acoculco geothermal fields (Mexico) - ESSD
←
→
Page content transcription
If your browser does not render page correctly, please read the page content below
Earth Syst. Sci. Data, 13, 571–598, 2021
https://doi.org/10.5194/essd-13-571-2021
© Author(s) 2021. This work is distributed under
the Creative Commons Attribution 4.0 License.

                  Petrophysical and mechanical rock property
                  database of the Los Humeros and Acoculco
                          geothermal fields (Mexico)
            Leandra M. Weydt1 , Ángel Andrés Ramírez-Guzmán2 , Antonio Pola2 , Baptiste Lepillier3 ,
         Juliane Kummerow4 , Giuseppe Mandrone5 , Cesare Comina5 , Paromita Deb6 , Gianluca Norini7 ,
      Eduardo Gonzalez-Partida8 , Denis Ramón Avellán9 , José Luis Macías10 , Kristian Bär1 , and Ingo Sass1,11
                 1 Department       of Geothermal Science and Technology, Technische Universität Darmstadt,
                                          Schnittspahnstraße 9, 64287 Darmstadt, Germany
         2 Escuela Nacional de Estudios Superiores – Unidad Morelia, Universidad Nacional Autónoma de México,

                               Antigua Carretera a Pátzcuaro 8701, 58190 Morelia, Michoacán, Mexico
                          3 Faculty of Civil Engineering and Geosciences, Delft University of Technology,

                                             Stevinweg 1, Delft 2628CD, the Netherlands
                         4 GFZ Research Centre for Geoscience, Telegrafenberg, 14473 Potsdam, Germany
               5 Department of Earth Sciences, University of Turin, Via Valperga Caluso 35, 10125 Turin, Italy
                  6 Institute for Applied Geophysics and Geothermal Energy, E.ON Energy Research Center,

                                     RWTH Aachen, Mathieustraße 10, 52074 Aachen, Germany
                     7 Istituto di Geologia Ambientale e Geoingegneria, Consiglio Nazionale delle Ricerche,

                                              Via Roberto Cozzi 53, 20125 Milan, Italy
         8 Centro de Geociencias, Universidad Nacional Autónoma de México, 76230 Juriquilla, Querétaro, Mexico
                        9 CONACYT – Instituto de Geofísica, Universidad Nacional Autónoma de México,

                               Antigua Carretera a Pátzcuaro 8701, 58190 Morelia, Michoacán, Mexico
                 10 Instituto de Geofísica – Unidad Michoacán, Universidad Nacional Autónoma de México,

                               Antigua Carretera a Pátzcuaro 8701, 58190 Morelia, Michoacán, Mexico
                            11 Darmstadt Graduate School of Excellence Energy Science and Engineering,

                                       Jovanka-Bontschits Straße 2, 64287 Darmstadt, Germany
                            Correspondence: Leandra M. Weydt (weydt@geo.tu-darmstadt.de)

                                     Received: 4 June 2020 – Discussion started: 17 July 2020
                     Revised: 12 December 2020 – Accepted: 23 December 2020 – Published: 23 February 2021

      Abstract. Petrophysical and mechanical rock properties are key parameters for the characterization of the deep
      subsurface in different disciplines such as geothermal heat extraction, petroleum reservoir engineering or mining.
      They are commonly used for the interpretation of geophysical data and the parameterization of numerical models
      and thus are the basis for economic reservoir assessment. However, detailed information regarding petrophysical
      and mechanical rock properties for each relevant target horizon is often scarce, inconsistent or distributed over
      multiple publications. Therefore, subsurface models are often populated with generalized or assumed values
      resulting in high uncertainties. Furthermore, diagenetic, metamorphic and hydrothermal processes significantly
      affect the physiochemical and mechanical properties often leading to high geological variability. A sound under-
      standing of the controlling factors is needed to identify statistical and causal relationships between the properties
      as a basis for a profound reservoir assessment and modeling.
         Within the scope of the GEMex project (EU H2020, grant agreement no. 727550), which aims to develop new
      transferable exploration and exploitation approaches for enhanced and super-hot unconventional geothermal
      systems, a new workflow was applied to overcome the gap of knowledge of the reservoir properties. Two caldera

Published by Copernicus Publications.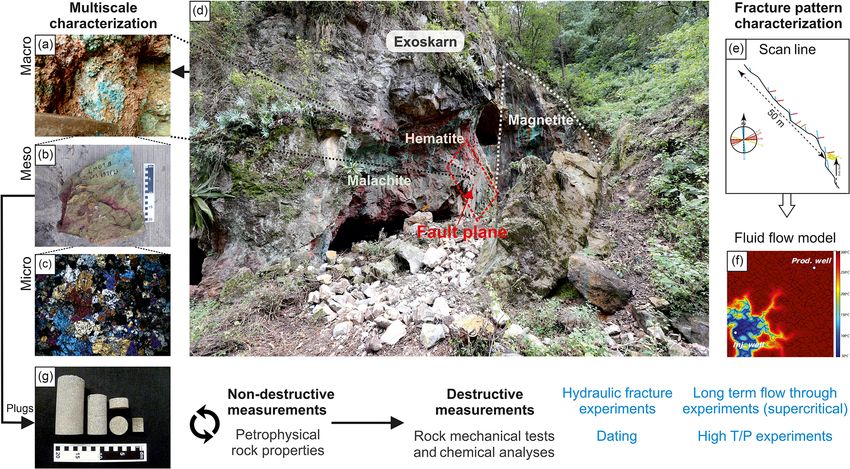
572                                                  L. M. Weydt et al.: Petrophysical and mechanical rock property database

       complexes located in the northeastern Trans-Mexican Volcanic Belt – the Acoculco and Los Humeros caldera –
       were selected as demonstration sites.
         The workflow starts with outcrop analog and reservoir core sample studies in order to define and characterize
       the properties of all key units from the basement to the cap rock as well as their mineralogy and geochemistry.
       This allows the identification of geological heterogeneities on different scales (outcrop analysis, representative
       rock samples, thin sections and chemical analysis) enabling a profound reservoir property prediction.
         More than 300 rock samples were taken from representative outcrops inside the Los Humeros and Acoculco
       calderas and the surrounding areas and from exhumed “fossil systems” in Las Minas and Zacatlán. Additionally,
       66 core samples from 16 wells of the Los Humeros geothermal field and 8 core samples from well EAC1 of
       the Acoculco geothermal field were collected. Samples were analyzed for particle and bulk density, porosity,
       permeability, thermal conductivity, thermal diffusivity, and heat capacity, as well as ultrasonic wave velocities,
       magnetic susceptibility and electric resistivity. Afterwards, destructive rock mechanical tests (point load tests,
       uniaxial and triaxial tests) were conducted to determine tensile strength, uniaxial compressive strength, Young’s
       modulus, Poisson’s ratio, the bulk modulus, the shear modulus, fracture toughness, cohesion and the friction
       angle. In addition, X-ray diffraction (XRD) and X-ray fluorescence (XRF) analyses were performed on 137
       samples to provide information about the mineral assemblage, bulk geochemistry and the intensity of hydrother-
       mal alteration.
         An extensive rock property database was created (Weydt et al., 2020; https://doi.org/10.25534/tudatalib-
       201.10), comprising 34 parameters determined on more than 2160 plugs. More than 31 000 data entries were
       compiled covering volcanic, sedimentary, metamorphic and igneous rocks from different ages (Jurassic to
       Holocene), thus facilitating a wide field of applications regarding resource assessment, modeling and statisti-
       cal analyses.

1   Introduction                                                    each relevant formation and to assess the uncertainty in the
                                                                    input parameters for different modeling approaches. How-
The knowledge of petrophysical and mechanical rock prop-            ever, on the one hand, detailed information about rock prop-
erties of the deep subsurface is essential for reservoir explo-     erties for the relevant target formations is often not avail-
ration and assessment of the reservoir potential for a variety      able, is inconsistent or is distributed over the literature. On
of industrial applications such as petroleum reservoir engi-        the other hand, important metadata such as petrographic de-
neering, geothermal heat extraction, mining or nuclear waste        scriptions, details on sample locations and applied methods
disposal. The data are most commonly used for interpreting          for data acquisition are missing (Bär et al., 2020). Without
geophysical data, creating conceptual geological models or          sufficient information, it is often not possible to evaluate and
populating numerical models (Lévy et al., 2018; Scott et al.,       profit from existing laboratory data from specific locations or
2019; Deb et al., 2019a, b; Árnason, 2020). Depending on            reservoir formations for future modeling approaches or stud-
the scale of investigation (e.g., local, regional or continen-      ies related to similar geological settings. Consequently, most
tal scale), highly accurate spatial predictions of relevant rock    reservoir models are based on assumed or generalized data
properties are required to increase the success and accuracy        sets and local geological heterogeneities are often not con-
of reservoir operations and to reduce economic risks.               sidered (Mielke et al., 2015). While most studies focus on a
   Rock formations are usually characterized by a heteroge-         single parameter (Clauser and Huenges, 1995) or a small set
neous internal structure, mineral composition, and pore and         of samples, extensive data sets are required, which contain
fracture distribution resulting in great variability in petro-      data of numerous different analyses performed on each sam-
physical and mechanical properties (Schön, 2015). Thereby,          ple in order to constrain statistical and causal relationships
tectonic events, diagenetic or metamorphic processes, and           between the parameters (Linsel et al., 2020).
hydrothermal alteration significantly affect the rock proper-          Addressing these challenges, the GEMex project (Hori-
ties (Pola et al., 2012; Aretz et al., 2015; Weydt et al., 2018a;   zon 2020, grant agreement no. 727550) embedded the petro-
Mordensky et al., 2019; Durán et al., 2019, Heap et al., 2020),     physical and mechanical rock characterization of the target
leading to a high geological heterogeneity often observed           formations in a comprehensive workflow providing the basis
within hundreds-of-meter to sub-meter scales (e.g., Canet et        for different modeling approaches, geophysical surveys, on-
al., 2010). Although most exploration methods or geologi-           going and future volcanological studies. The GEMex project
cal models are aligned to the reservoir scale, the control-         is a European–Mexican collaboration which aims to develop
ling factors within the reservoir need to be understood and         new transferable exploration and exploitation approaches for
quantified at different scales to estimate the heterogeneity of     enhanced geothermal systems (EGSs) and super-hot uncon-

Earth Syst. Sci. Data, 13, 571–598, 2021                                             https://doi.org/10.5194/essd-13-571-2021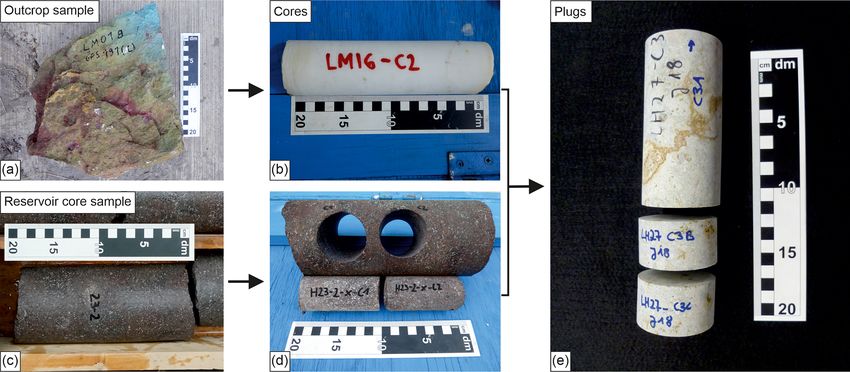
L. M. Weydt et al.: Petrophysical and mechanical rock property database                                                        573

ventional geothermal systems (SHGSs). For this purpose, the        GEMex project framework and sampling
Acoculco and Los Humeros geothermal fields have been se-
lected as demonstration sites. Both fields are linked to caldera   The geothermal system in Los Humeros is steam dominated
complexes located in the northeastern part of the Trans-           and has been under production since 1990, operated by the
Mexican Volcanic Belt (TMVB). Extensive geological, geo-           Comisión Federal de Electricidad (CFE). With a production
chemical, geophysical and technical investigations were per-       of 94.8 MWe in 2018 it is the third-largest geothermal field
formed to improve the reservoir understanding and to facili-       in Mexico (Romo-Jones et al., 2019) with 65 wells drilled so
tate future drilling operations.                                   far, of which 28 are productive and 5 are used as injection
    Up until the beginning of the project in 2016, informa-        wells. With temperatures above 380 ◦ C encountered below
tion on rock properties of the different geological units in the   2 km depth in the northern part of the field, the Los Humeros
study area was scarce or not available. Previous studies fo-       caldera complex was characterized as a suitable target for the
cused on the investigation of reservoir core samples of both       development of a SHGS within GEMex. In Acoculco two ex-
geothermal fields (Contreras et al., 1990; García-Gutiérrez        ploration wells have been drilled so far, which have encoun-
and Contreras, 2007; Canet et al., 2015). However, the exist-      tered temperatures of approximately 300 ◦ C at a depth of
ing data were not sufficient for the definition and parameter-     about 2 km (Canet et al., 2015). Although a well-developed
ization of model units within the reservoir due to the limited     fracture network exists within the area, both wells were dry
core material available (six pieces for Acoculco; Canet et al.,    (López-Hernández et al., 2009). Thus, the GEMex project
2015) or the lack of petrographic descriptions and chemical        aims to develop a deep EGS in Acoculco in order to connect
data for individual samples (Contreras et al., 1990).              the existing wells to proximal fluid-bearing fracture zones.
    Therefore, outcrop analog studies and reservoir core stud-        The project comprises a multidisciplinary approach based
ies were performed in order to characterize all relevant key       on three milestones which are (1) resource assessment,
units from the basement to the cap rock (Weydt et al.,             (2) reservoir characterization and (3) concepts for site de-
2018b; Bär and Weydt, 2019). Geological heterogeneities            velopment (Jolie et al., 2018). The first milestone focused
were investigated on different scales: (1) macroscale (out-        on a comprehensive understanding of structurally controlled
crops), (2) mesoscale (rock samples) and (3) microscale            permeability and the fluid flow in the reservoir including ex-
(thin-section and chemical analysis). Analog studies of the        tensive fieldwork regarding stratigraphy and structural ge-
geological units exposed in outcrops around the investigated       ology, fracture distribution, hydrological and geochemical
geothermal fields offer a cost-effective opportunity to inves-     studies of natural springs, comprehensive soil–gas studies
tigate and correlate facies, diagenetic and metamorphic pro-       (e.g., CO2 flux; Jentsch et al., 2020), and airborne thermal
cesses, and lithofacies-related rock properties from outcrops      imaging. The second milestone includes several geophysical
down to the subsurface (Howell et al., 2014). The definition       surveys (e.g., passive and active seismic, gravity and magne-
of thermo-facies units (Sass and Götz, 2012) and the quan-         totelluric surveys) to characterize active faults and to identify
tification of uncertainties for each parameter enable a reliable   deep structures. In addition, extensive sampling campaigns
prediction of rock properties in the subsurface.                   were conducted for petrophysical, rock mechanical, chemi-
    A comprehensive database was developed including petro-        cal and mineralogical investigations of the key lithologies in
physical, thermophysical, magnetic, electric, dynamic and          the study area. Resulting data and models of all work groups
static mechanical properties combined with chemical and            are being combined in integrated reservoir models at a lo-
mineralogical data. In total 34 parameters were determined         cal, regional and superregional scale. The third milestone in-
on more than 2160 plugs retrieved from 306 outcrop sam-            cludes the investigation of transferable concepts for devel-
ples from both caldera complexes and 66 reservoir core sam-        oping EGSs and the utilization of SGHSs; the identification
ples of the Los Humeros geothermal field as well as 8 core         of suitable materials and well designs, which can resist high
samples of the Acoculco geothermal field covering volcanic,        temperatures and corrosive fluids in the reservoir; and the
sedimentary, metamorphic and igneous rocks from Jurassic           determination of possible drill pathways along with a com-
to Holocene age. Here, we present the workflow and current         prehensive risk assessment and management.
status of the GEMex rock property database (Weydt et al.,             The work presented in this study is part of milestone 2
2020; https://doi.org/10.25534/tudatalib-201.10). These data       (reservoir characterization) and focuses on the mineralogi-
not only provide the basis for ongoing research in the study       cal, petrophysical and mechanical rock characterization of
area but also facilitate a wide field of applications in differ-   both geothermal systems. Several joint field campaigns with
ent disciplines, for example, a first assessment of the subsur-    Mexican and European partners were conducted in order to
face properties at early exploration stages (Bär et al., 2020),    cover and sample all relevant geological key units from the
different modeling approaches, geostatistical and stochastic       basement to the cap rock. In this context, work groups with
analyses, or the validation of different measurement meth-         different areas of expertise worked together in a joint ap-
ods.                                                               proach (Fig. 1). Thus, structural geologists worked together
                                                                   with volcanologists, petrologists and petrophysicists on the
                                                                   same outcrops to, e.g., combine results of fracture pattern

https://doi.org/10.5194/essd-13-571-2021                                             Earth Syst. Sci. Data, 13, 571–598, 2021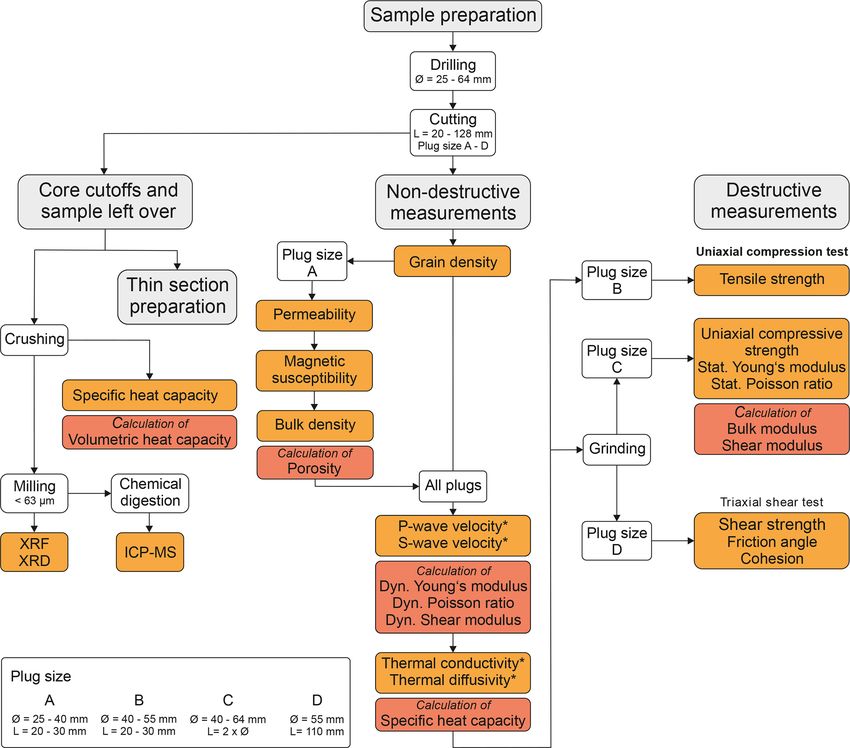
574                                                     L. M. Weydt et al.: Petrophysical and mechanical rock property database

Figure 1. Schematic workflow of the GEMex project using the example of the El Dorado mine in Las Minas (d) with view on the footwall
of the present fault (photo from Maximilian Bech). The quarry exposes exoskarn in many variations. Outcrop analysis included detailed
investigation of kinematic indicators, mineralogy (a) and the main fracture pattern (e) to create numerical fluid flow models (f) as presented
in Lepillier et al. (2019). Rock samples taken for lab investigation (b) and geochemical and thin-section analysis (c) (photo from Caterina
Bianco). Cylindrical plugs drilled from the outcrop samples (g), which were distributed between the partners in order to determine rock
properties, dating or high-T /P experiments (the experiments marked in blue are not included in this study).

characterization and rock property analysis obtained from the            CFE granted extensive sampling of wellbore core material
same outcrops in a numerical fluid flow model (Lepillier et              of both geothermal fields at the CFE camp in Los Humeros.
al., 2019). Likewise, samples for detailed mineralogical in-             In total 66 samples drilled from 37 core sections covering 16
vestigations were collected together with samples for petro-             wells drilled in Los Humeros and 8 core samples drilled from
physical experiments. Over 300 representative samples were               6 core sections from well EAC1 of the Acoculco geothermal
collected from more than 140 outcrops inside the caldera                 field were obtained. All samples were directly drilled within
complexes and in the surrounding area (Fig. 2). In addition              the field or sent as boulders to Europe or the Mexican insti-
to outcrop analysis in the Acoculco and Los Humeros ar-                  tutes and subsequently distributed between the partners. This
eas, particular attention was paid to the exhumed systems                approach ensures that further work on the project, such as
Zacatlán (east of Acoculco) and Las Minas (east of Los                   long-term flow experiments (Kummerow et al., 2020), high-
Humeros), where all units from the cap rock to the base-                 T /P experiments, hydraulic fracture experiments (Deb et
ment are exposed. These so-called “fossil systems” serve as              al., 2019c), detailed mineralogical analyses (thin-section and
proxies for the active geothermal fields and help in the un-             scattered electron microscope; Lacinska et al., 2020), isotope
derstanding of the fluid flow and mineralization processes in            analyses or dating (Kozdrój et al., 2019), can be directly cor-
the “active” geothermal reservoirs under discussion. When-               related with the results presented in this study. Furthermore,
ever possible, each geological unit was sampled several times            some parameters of the same sample set were analyzed by
at different outcrop locations to cover the unit’s heterogene-           multiple institutes to compare and validate different analyti-
ity, and only samples with an overall fresh appearance unaf-             cal approaches.
fected by weathering were considered. Hydrothermal alter-
ation of different intensities was observed in some outcrops
                                                                         2   Geological setting
in close proximity to fault zones and dikes. In these cases,
hydrothermally altered samples were deliberately collected               The Acoculco and Los Humeros caldera complexes are lo-
to analyze the effect of these processes on the rock prop-               cated in the northeastern part of the Trans-Mexican Vol-
erties. Besides analyzing outcrops and outcrop samples, the              canic Belt (TMVB), 125 and 180 km east of Mexico City,

Earth Syst. Sci. Data, 13, 571–598, 2021                                                    https://doi.org/10.5194/essd-13-571-2021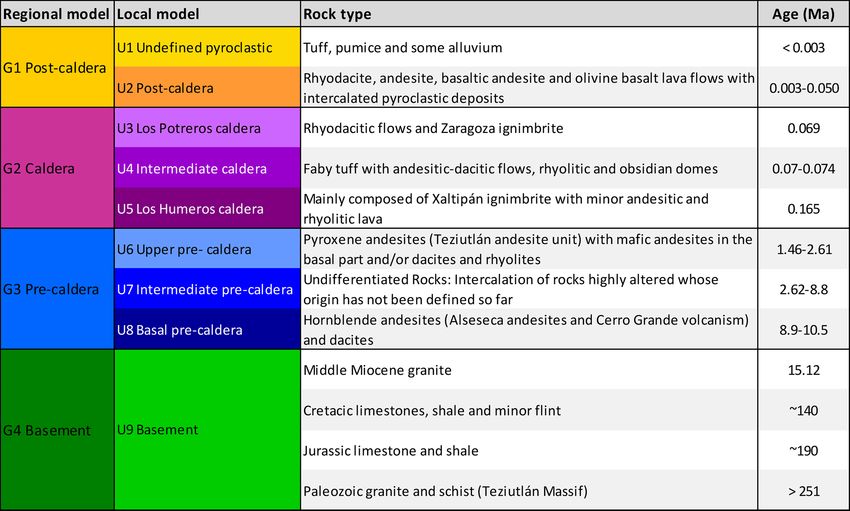
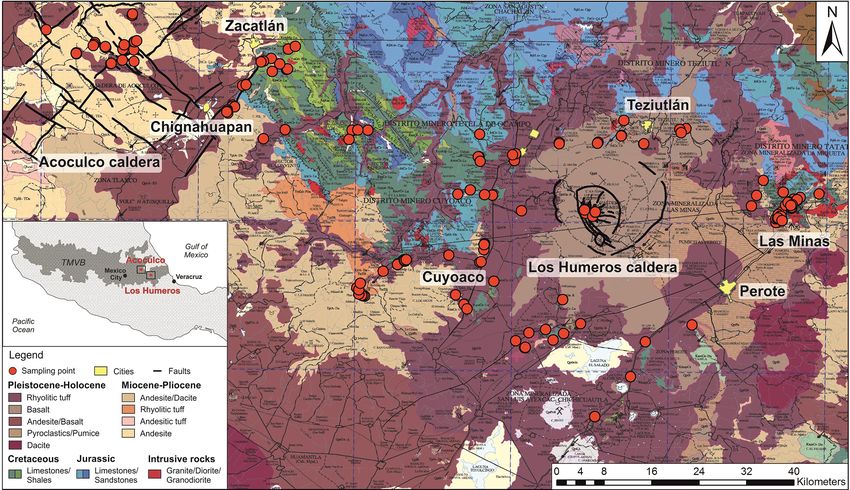
L. M. Weydt et al.: Petrophysical and mechanical rock property database                                                           575

Figure 2. Geological map of the Acoculco and Los Humeros region including the sampling points of the outcrop samples (SGM, 2002a, b).
The faults were recently mapped and characterized by Liotta et al. (2019) and Norini et al. (2019).

respectively. The E–W trending TMVB is a ∼ 1000 km long                  caldera close to Chignahuapan and Zacatlán as well as in the
calc-alkaline arc which is directly linked to the subduction             surroundings of the Los Humeros caldera. Furthermore, it
of the Rivera and Cocos plates beneath the North Ameri-                  was also cut at different depth levels in drill cores in both
can Plate along the Middle America Trench (Ferrari et al.,               geothermal fields (López-Hernández, et al., 2009; Carrasco-
2012; Macías et al., 2012; Avellán et al., 2018). The volcanic           Núñez et al., 2017a). The granitic plutons are spread over
complexes are located over a ∼ 50 km thick continental crust             the study area, and new aeromagnetic data of the Acoculco
(Pérez-Campos et al., 2008) and are situated ∼ 100 km north              caldera constrain the occurrence of at least four intrusive
of the Popocatépetl and Pico de Orizaba volcanoes, which                 bodies hosted in the Cretaceous limestones at > 1 km depth.
define the most active front of the TMVB in central eastern              Those were interpreted as a series of horizontal mafic intru-
Mexico (Ferrari et al., 2012; Macías et al., 2012; Avellán et            sions providing the energy to maintain the geothermal field
al., 2020).                                                              (Avellán et al., 2020).
   Both volcanic complexes are emplaced on intensively                      The Acoculco caldera complex has an 18 km×16 km semi-
folded Mesozoic sedimentary rocks (Mexican fold-and-                     circular shape (Avellán et al., 2018) and predominantly com-
thrust belt; Fitz-Díaz et al., 2017) belonging to the Sierra             prises Pliocene to Pleistocene basaltic to rhyolitic lavas,
Madre Oriental comprising Jurassic sandstones, shales,                   domes, cinder cones and ignimbrites. The caldera complex
hydrocarbon-rich limestones and dolomites overlain by Cre-               sits on an intersecting NE–SW and NW–SE fault system cre-
taceous limestones and shales (López-Hernández et al.,                   ating an orthogonal arrangement of grabens, half grabens and
2009; Fitz-Díaz et al., 2017). The regional tectonic setting is          horsts (García-Palomo et al., 2002, 2018). Thereby the re-
characterized by Late Cretaceous–Eocene NW–SE striking                   gional tectonic regime strongly affected the local tectonic
thrusts and folds and subordinate NE-striking normal faults              behavior and structural deformation of the caldera (Sosa-
that are associated with an Eocene–Pliocene extensional de-              Ceballos et al., 2018). The Acoculco caldera is located on
formation phase (Norini et al., 2019). Oligocene to Miocene              the NE–SW Rosario-Acoculco horst and was built on top
granitic and syenitic plutons as well as andesitic and basaltic          of Cretaceous limestones and the Zacatlán basaltic plateau
dikes intruded into the sedimentary sequences, leading to lo-            (so far undated) as well as Miocene and Pliocene lavas and
cal metamorphism of marble, hornfels and skarn (Ferriz and               domes related to the regional volcanism of the TMVB (Avel-
Mahood, 1984; Fuentes-Guzmán et al., 2020). The sedimen-                 lán et al., 2018, 2020). Thereby the pre-caldera lavas and
tary basement is exposed east and southeast of the Acoculco              scoria cones exposed north and northeast of the Acoculco

https://doi.org/10.5194/essd-13-571-2021                                                    Earth Syst. Sci. Data, 13, 571–598, 2021
576                                                L. M. Weydt et al.: Petrophysical and mechanical rock property database

caldera complex were related to the Apan-Tezontepec Vol-          of 291 km3 and a thickness of up to 880 m (Carrasco-Núñez
canic Field (Miocene and Pliocene), whereas Miocene an-           et al., 2018; Cavazos and Carrasco-Núñez, 2020). After the
desitic and dacitic lavas are exposed west of the Acoculco        emplacement of the Xaltipán ignimbrite, which caused the
caldera complex. Magmatic activity of the Acoculco caldera        characteristic trapdoor structure of the caldera, further explo-
can be divided into five different eruptive phases, includ-       sive events led to the deposition of thick rhyodacitic Plinian
ing recent deposits and hydrothermal altered areas inside the     deposits called Faby Tuff (Norini et al., 2015; Carrasco-
caldera (Avellán et al., 2018). It began with the emplace-        Núñez et al., 2017a). Afterwards, a second caldera-forming
ment of the Acoculco ignimbrite (∼ 2.7 Ma; 40 Ar/39 Ar),          eruption occurred at ∼ 69 ka and is related to the Zaragoza
followed by several early (∼ 2.6–2.1 Ma) and late (∼ 2.0–         ignimbrite emplacement forming the Los Potreros caldera
< 0.016 Ma) post-caldera volcanic events producing basaltic       within the Los Humeros caldera. The post-caldera stage is
to trachyandesitic and rhyolitic lava flows restricted within     represented by rhyolitic and dacitic domes within the center
the caldera and rhyolitic lava domes, scoria cones and            of the caldera (44.8 ± 1.7 ka) and basaltic to trachyandesitic
two ignimbrites that predominantly migrated to the caldera        lava flows (8.9 ± 0.03 ka), volcaniclastic breccias and fallout
rim and periphery, respectively. The extra-caldera volcan-        deposits (7.3 ± 0.1 ka) with a highly variable lateral and ver-
ism (2.4–0.19 Ma) comprises several basaltic trachyandesitic      tical distribution (Carrasco-Núñez et al., 2017a, 2018).
to basaltic andesitic lavas and scoria cones, related to the
volcanism of the Apan-Tezontepec Volcanic Field. Prod-
                                                                  3   Workflow
ucts of the extra-caldera volcanism are interbedded with the
lavas of the Acoculco caldera complex. It has to be empha-
                                                                  After the samples were distributed between the partners,
sized that recent studies (Avellán et al., 2018, 2020) are not
                                                                  cylindrical cores with diameters ranging from 25 to 65 mm
in line with previous volcanological studies performed by
                                                                  were drilled and subsequently cut according to standards
López-Hernández et al. (2009). In the study conducted by
                                                                  (ASTM D4543-19, 2019) for the required sample length,
López-Hernández et al. (2009), the authors concluded that
                                                                  and the irregular and rough core ends were cut to be par-
the Acoculco caldera (1.7–0.24 Ma) is nested within the older
                                                                  allel. The laboratory tests were divided into three stages:
and larger Tulancingo caldera (∼ 3.0–2.7 Ma) forming the
                                                                  (1) general petrophysical characterization including all non-
so-called Tulancingo–Acoculco caldera complex and that a
                                                                  destructive measurements, (2) mechanical rock characteri-
third volcanic episode (1.8–0.2 Ma) occurred, which was re-
                                                                  zation, and (3) chemical and mineralogical characterization.
lated to monogenetic volcanism without a caldera collapse.
                                                                  Non-destructive tests included particle density, bulk density,
   The younger Los Humeros caldera is the largest ac-
                                                                  porosity, intrinsic matrix permeability, thermal conductivity
tive caldera of the TMVB with a 21 km × 15 km irregular
                                                                  in dry and saturated conditions, thermal diffusivity in dry and
shape and comprises predominantly Pleistocene to Holocene
                                                                  saturated conditions, P-wave velocity and S-wave velocity
basaltic andesitic to rhyolitic volcanic rocks (Carrasco-
                                                                  in dry and saturated conditions, specific heat capacity, mag-
Núñez et al., 2018; Norini et al., 2019). The oldest vol-
                                                                  netic susceptibility, and electric resistivity in dry and satu-
canic activity in this area is represented by a thick sequence
                                                                  rated conditions. Afterwards the destructive rock mechanical
of Miocene andesites, dacites and basaltic lava flows of the
                                                                  tests such as the Brazilian disc test, the chevron bend test, the
Cuyoaco and Alseseca andesite unit (∼ 10.5 Ma; Yáñez and
                                                                  point load test, and uniaxial and triaxial tests were performed
García, 1982) and Pliocene to Pleistocene basaltic to an-
                                                                  to determine uniaxial compressive strength, Young’s modu-
desitic lavas belonging to the Teziutlán andesite unit (dated
                                                                  lus, the Poisson ratio, tensile strength, fracture toughness, the
between 1.44 ± 0.31–2.65 ± 0.43 Ma, 40 Ar/39 Ar; Carrasco-
                                                                  friction angle and cohesion. Samples that were identified as
Núñez et al., 2017a). Miocene lavas have a cumulative thick-
                                                                  suitable for destructive tests such as uniaxial or triaxial tests
ness of up to 900 m and can be related to the Cerro Grande
                                                                  were ground plane-parallel prior to analysis. Quantitative and
Volcanic Complex dated between 8.9–11 Ma (Carrasco-
                                                                  qualitative chemical analyses like X-ray fluorescence (XRF)
Núñez et al., 1997; Gómez-Tuena and Carrasco-Núñez,
                                                                  and X-ray diffraction (XRD) as well as thin-section analyses
2000), and Teziutlán andesite lavas have a reported thickness
                                                                  were performed for the petrological and geochemical charac-
of up to 1500 m (López-Hernández, 1995). Both units are
                                                                  terization. Figure 3 shows the schematic laboratory workflow
classified as “andesitic and basaltic volcanic basement” and
                                                                  of TU Darmstadt.
form the currently exploited reservoir in the subsurface of the
Los Humeros geothermal field (Carrasco-Núñez et al., 2018).
The beginning of the magmatic activity of the Los Humeros         4   Structure of the database and sample
volcanic complex is represented by rhyolitic lavas and abun-          classification
dant rhyolitic domes, mainly located at the western side of
the volcanic complex (270 ± 17 and 693 ± 1.9 ka; Carrasco-        The      database     is    publicly     available  under
Núñez et al., 2018). However, the caldera collapse itself is      https://doi.org/10.25534/tudatalib-201.10 (Weydt et al.,
associated with the emplacement of the high-silica rhyolite       2020) and contains petrophysical and rock mechanical
Xaltipán ignimbrite at ∼ 160 ka with an estimated volume          properties as well as chemical data obtained by laboratory

Earth Syst. Sci. Data, 13, 571–598, 2021                                            https://doi.org/10.5194/essd-13-571-2021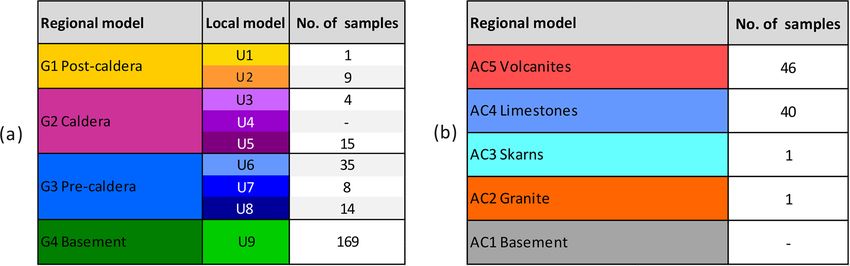
L. M. Weydt et al.: Petrophysical and mechanical rock property database                                                              577

Figure 3. Schematic workflow representing the measurement procedure at TU Darmstadt. The properties displayed in orange were deter-
mined on sample material and used to calculate those shown in red. Parameters marked with * were analyzed in dry and saturated conditions.

experiments within the scope of the GEMex project. This                well-structured form, allowing easy filtering and a transfer
database is provided in a flat file Excel format and in CSV            of data into other database formats like SQL (structural
format to keep the handling as simple as possible. Its internal        query language) to easily visualize it or to implement it for
structure is based on the PetroPhysical Property Database              modeling approaches.
– P3 – previously developed during the IMAGE project                      The first and main data sheet comprises all analyzed petro-
(Bär et al., 2020) with some project-specific modifications.           physical parameters and sample information (metadata) com-
The P3 database’s internal design comprises multiple tables            piled during this project. Each analyzed plug was provided
for petrography, stratigraphy, quality controls, chemical              with a sample ID, which acts as the primary key for all
analyses and petrophysical properties and follows the                  records. Sample information provided in the database is ex-
concept of relational database management (Codd, 1970).                plained in the following sub-sections.
As the database presented in this study is restricted to one              The second data sheet includes all chemical data, retrieved
study area, the P3 structure was simplified, and the sample’s          from composite sample material, and does not directly cor-
information has been compiled in two data sheets so far. The           respond to measurements on single plugs. The data are pro-
main objective was to provide the data in a user-friendly and          vided separately to increase handling and readability. Here,

https://doi.org/10.5194/essd-13-571-2021                                                  Earth Syst. Sci. Data, 13, 571–598, 2021
578                                                  L. M. Weydt et al.: Petrophysical and mechanical rock property database

the sample name represents the primary key which links the          y coordinates (UTM WGS84). For the reservoir core sam-
data to the petrophysical measurements provided in the first        ples, the coordinates of the well heads are included. All this
table.                                                              information is given in meters above sea level (m a.s.l.) and
                                                                    represents the surface evaluation of the outcrops or the eval-
4.1   Metadata
                                                                    uation at reservoir depth for the reservoir core samples. The
                                                                    latter was provided in measured depth (MD) by the CFE, and
The metadata include all additional sample information from         the core sample material was obtained from vertically drilled
sample ID to sample dimensions and can be used for rapid            wellbores.
filtering and the precise categorizing of parameters.                  Furthermore, the outcrop names and field trips are docu-
    Each analyzed plug or sample received a unique sample           mented as project internal information and enable the plac-
ID, which is derived from the sample name given in the field,       ing of this work in relation to other work conducted within
the geothermal reservoir (LH or AC), the field trip (e.g., M17      the study area. Samples from six field trips are provided in
for May 2017) and an abbreviation for the rock type (e.g., GD       the database as shown in Table 1.
for granodiorite). This classification was developed within            The “location” was inserted in addition to the outcrop
the project due to the high number of samples collected dur-        name and sample coordinates to classify the samples accord-
ing different field trips. Furthermore, the sample ID provides      ing to their sampling area, distinguishing between Acoculco,
information about the sample preparation. In hierarchical or-       Los Humeros, and the exhumed systems Las Minas and
der the sample name, core name and plug name are provided.          Zacatlán–San Miguel Tenango (SMT). The column “insti-
For each drilled core the sample name was complemented              tution” refers to the institution and authors that generated
with C1 (i.e., core number 1), C2, C3 and so on. Whenever           the data and indirectly links this to the applied methods de-
the core did not meet the requirements for destructive mea-         scribed in Sect. 5.
surements (length-to-diameter ratio of 2 : 1 or too fragile),          Based on the rock type and stratigraphic classification, the
the core was cut into plugs. The core name was then com-            samples were related to the model units of the regional and
plemented with capital letters A, B, C, etc. representing the       local geological models created within the GEMex project
way the core was cut (Fig. 4). The implementation of this           (Calcagno et al., 2018, 2020). The regional and local model
hierarchical order allows for quick access of the parameters        units were defined to consider the most representative geo-
per plug, per core or per sample. Whenever a core was not           logical formations in the study area, the scale of the model
cut into several plugs, the core and plug name are identi-          and the objective of the project (Calcagno et al., 2018). For
cal to avoid gaps in the database. For practical reasons the        Los Humeros four regional and nine local model units were
term “plug” was used for all cylindrical samples after sam-         defined (Fig. 5). The classification is mostly based on recent
ple preparation (cutting and grinding) ready to be analyzed.        work of Carrasco-Núñez et al. (2017a, b, 2018) and Norini
For the reservoir core samples, the existing core names were        et al. (2015, 2019) and information about formation depth,
adopted. The ID begins with the well name (e.g., H23), fol-         thickness and distribution provided by the CFE stratigraphic
lowed by the core number (e.g., number 2), the core section         drilling profiles. Samples collected from basaltic and an-
(e.g., 14, or x for undefined) and the number of the drilled        desitic dikes as well as from intrusive bodies in Los Humeros
subcore (C1 or C2).                                                 and Las Minas were related to the basement (G4 and U9).
    The samples were classified regarding their rock type and       The classification of the local units of the reservoir core sam-
stratigraphic unit based on the recently published geological       ples represents the classification used for the latest update of
maps and volcanological studies conducted in Acoculco and           the local model of Los Humeros (Calcagno et al., 2020).
Los Humeros (Avellán et al., 2018, 2020; Carrasco-Núñez et             For the regional model of Acoculco, five units were de-
al., 2017a, b, 2018). Rock types were predominantly deter-          fined (Fig. 6). All volcanic deposits were merged into one
mined using macroscopic analyses complemented by thin-              unit called AC5-Volcanites, whereas the basement rocks
section analyses (whenever available). Additionally, bulk           were split into four separate units: AC4-Limestones, AC3-
chemical analyses (XRF) were used to better characterize the        Skarns, AC2-Granite and AC1-Basement. The description
volcanic rocks using the TAS classification (Le Maitre and          and stratigraphic classification is based on López-Hernández
Streckeisen, 2003). However, this classification is only ap-        et al. (2009), Lorenzo-Púlido et al. (2010), Sosa-Ceballos et
plicable for unaltered sample material. The classification of       al. (2018) and Avellán et al. (2018).
the stratigraphic unit is based on the international chronos-          As the last entities belonging to the metadata, sample de-
tratigraphic chart of the IUGS (Cohen et al., 2013) according       scriptions and dimensions for each plug are provided. The
to international standardization. Whenever possible the local       sample description includes a brief macroscopic descrip-
stratigraphic unit is given. The volcanological studies are still   tion and gives information about the occurrence of fractures,
ongoing, and the ages of some units or areas are not yet well       joints and fissures or other remarks (e.g., chert nodules or sty-
constrained.                                                        lolites). Furthermore, the information is given as to whether
    Coordinates of the sampling locations are provided as lat-      thin sections were prepared or not. The section “sample di-
itude and longitude in decimal degrees (WGS84) and x and            mensions” includes the length, diameter (exact and drilled

Earth Syst. Sci. Data, 13, 571–598, 2021                                              https://doi.org/10.5194/essd-13-571-2021
L. M. Weydt et al.: Petrophysical and mechanical rock property database 579
Figure 4. Overview of the different preparation steps and sample labeling. Cores (b, various diameters; d, 40 mm in diameter) drilled from
outcrop samples (a) and reservoir core samples (c) and subsequently cut into plugs (e) to meet the individual requirements of the measurement
devices. The plugs were labeled with capital letters.
Table 1. Overview of the field campaigns and related work.
No. Field campaign Related work
1 January 2017 Mapping, structural and mineralogical analyses in Las Minas and Acoculco (Liotta et al., 2019;
Lepillier et al., 2019)
2 March 2017 Hydraulic fracture experiments on large blocks (Deb et al., 2019c)
3 May 2017 Structural analyses in Los Humeros and Las Minas (Norini et al., 2019); samples for high-
temperature triaxial tests (Vagnon et al., 2021; Bär and Weydt, 2019); samples for long-term
flow through experiments in supercritical conditions (Kummerow et al., 2020); samples for
scanning electron microscopy, electron probe microanalysis, cathodoluminescence microscopy
and high-temperature fluid–rock reaction experiments (Lacinska et al., 2020; Bär and Weydt,
2019)
4 June 2017 Petrophysical characterization and mechanical evolution of hydrothermal altered rocks
5 January 2018 Mapping, structural and mineralogical analyses in Acoculco and Las Minas (Liotta et al., 2019;
Lepillier et al., 2019); dating (Kozdrój et al., 2019); samples for high-temperature triaxial tests
(Vagnon et al., 2021; Bär and Weydt, 2019); samples for scanning electron microscopy, elec-
tron probe microanalysis, cathodoluminescence microscopy and high-temperature fluid–rock
reaction experiments (Lacinska et al., 2020; Bär and Weydt, 2019); samples for fluid inclusions
(Ruggeri et al., 2020)
6 March 2018 Shallow geophysical surveys, determination of mechanical properties at field scale, electrical
resistivity tomography (Mandrone et al., 2020)
diameter), weight (dry and saturated) and shape of the plug. alyze scale-dependent effects (Enge et al., 2007). Therefore,
Plug shapes were inserted for quality control and were distin- plugs with varying diameters and lengths were drilled and
guished between “ideal cylindrical plug”, “cylindrical plug analyzed. Thus, small-scale samples (25 mm in diameter) for
with a broken edge”, “irregular shape” and “cuboid”. This which the bulk volume reaches the minimal representative
information needs to be considered when the bulk density elementary volume (REV; e.g., Ringrose and Bentley, 2015)
or volume is calculated by using the sample’s dimensions. are included.
The exact sample dimensions provide the opportunity to an-
https://doi.org/10.5194/essd-13-571-2021 Earth Syst. Sci. Data, 13, 571–598, 2021580 L. M. Weydt et al.: Petrophysical and mechanical rock property database
Figure 5. Regional and local model units of the 3D geological model of Los Humeros (slightly modified from Calcagno et al., 2018, 2020).
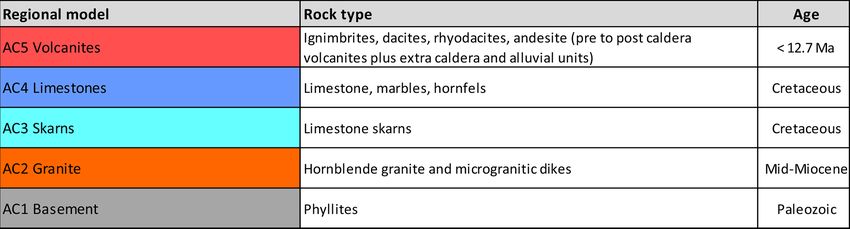
Figure 6. Regional model units of the 3D geological model of Acoculco (slightly modified from Calcagno et al., 2018).
4.2 Rock properties remarks were included to provide further details whenever
needed. Detailed information on methods and procedures is
Rock properties provided are grouped into (1) classical petro- given in Sect. 5.
physical parameters such as density, porosity and perme-
ability; (2) ultrasonic wave velocities; (3) thermal proper- 4.3 Chemical analyses
ties; (4) magnetic susceptibility; (5) electric resistivity; and
(6) rock mechanical parameters. The results are provided as The results of chemical analyses (XRF and XRD) are pro-
mean values with standard deviation (whenever possible) for vided in the second data sheet of the database. These data
each plug. For thermal conductivity and thermal diffusivity are retrieved from composite sample material, and a total of
the maximum and minimum values were added. In total 34 131 samples (reservoir core samples and outcrop samples)
different parameters were obtained following the recommen- were analyzed. The sample name acts as the primary key and
dations of international standardization institutions and com- allows for linking of chemical data with petrophysical data.
mittees (e.g., ISRM, ASTM or DIN). Columns for specific Results of the XRF analyses are presented in weight percent
Earth Syst. Sci. Data, 13, 571–598, 2021 https://doi.org/10.5194/essd-13-571-2021L. M. Weydt et al.: Petrophysical and mechanical rock property database 581
for the major elements and in parts per million for the trace ter (ASTM D5550-14, 2014) and a GeoPyc powder pyc-
elements. For both analyses (XRF and XRD) the responsible nometer (Micromeritics, 1997, 1998, 2014), analyzing par-
institution is added to relate the data to the applied method. ticle and bulk volume five times for each plug, respectively.
Bulk density was then automatically calculated by dividing
5 Material and methods the dry weight of the plug by its measured volume. After-
wards porosities were calculated from the resulting differ-
The following sections briefly describe the applied methods ences in volume and represent the gas-effective porosity, also
conducted by the different partners. A more extensive de- known as connected porosity. The accuracy of the method is
scription for the non-destructive measurements and the field 1.1 % (Micromeritics, 1998). Porosity measurements at TU
trips can be found in project reports on the GEMex web page Delft and UNAM were also performed using a helium gas
(Bär and Weydt, 2019; http://www.gemex-h2020.eu, last ac- pycnometer (Ultrapyc 1000 Version 2.12 and Ultrapyc 1200e
cess: 21 October 2020). Sample material from TU Delft (field gas pycnometers, respectively, both Quantachrome Corpora-
trip January 2017) and TU Darmstadt (field trip May 2017) tion, USA) to determine the grain density (ASTM D5550-14,
were distributed to GFZ, RWTH Aachen and UniTO for non- 2014), while bulk density was determined using caliper tech-
destructive petrophysical measurements. niques according to ASTM D7263-16 (2016). Every plug
was measured up to 20 times.
At GFZ and RWTH Aachen, particle density, bulk den-
5.1 Sample preparation
sity and porosity were determined using the triple weigh-
Drill cores with diameters ranging from 25 to 65 mm were ing method (ISRM, 1981). This method is based on the
drilled from the outcrop samples and cut into plugs as de- Archimedes principle, which uses the masses of the dry and
scribed above. More than 2100 plugs and cores with an axial fluid-saturated samples as well as that of the sample to-
length ranging from ∼ 30 to 128 mm were prepared accord- tally immersed in the fluid to calculate the pore volume and
ing to international standard ASTM D4543-19 (2019). The the porosity. The mass was determined with an accuracy of
short plugs (diameter 25 to 40 mm, length 25 to ∼ 30 mm) ±0.2 g. Usually, the accuracy is 1.5 % or better, but this es-
were predominantly used for the non-destructive petrophysi- pecially depends on the surface condition for low-porosity
cal measurements like bulk density, porosity and permeabil- samples. Thus, the measurements were performed up to three
ity due to the specific sample size requirements of the mea- times per plug. A similar approach was used at UniTO by
surement devices. Remaining plugs were prepared to meet applying caliper techniques and the dry and saturated mass
the requirements for the different destructive rock mechani- of each sample for the calculation of density and porosity
cal tests, which were conducted after the petrophysical char- (ISRM, 1979). Variations in particle and bulk density be-
acterization. For most of the rock mechanical tests a length- tween the different methods applied on the same samples
to-diameter ratio of 2 : 1 (uniaxial and triaxial tests) or 1 : 2 in this study range between 0.3 %–3 % (coefficient of vari-
(Brazilian test) is required. Furthermore, the plane surfaces ation) for limestones with porosities smaller than 3 % and
of the plugs had to be plane-parallel with a maximum angu- 0.5 %–3.5 % for pyroclastic rocks with porosities between
lar misalignment of 0.05◦ . 11 % and 15 %, verifying the different methods and sample
To ensure reproducibility of the results, the plugs were saturation procedures as sufficient to obtain data with the ac-
measured in oven-dry conditions (105 ◦ C for more than 24 h curacy needed.
or 64 ◦ C for more than 48 h) and cooled down to room tem- Matrix permeability was determined on cylindrical plugs
perature in a desiccator (20 ◦ C). Microcracking or significant (diameter and length ranging from 25 to 40 mm and ∼
mass losses caused by mineralogical changes or the collapse 20 to 80 mm, respectively) with column gas permeameters
of clay minerals during heating in the oven were not observed constructed according to ASTM D4525-13e2 (2013) and
since a majority of the outcrop samples contain no clays and ASTM D6539-13 (2013) standards at TU Darmstadt, GFZ
samples affected by hydrothermal or metamorphic processes and UNAM. The plugs were analyzed in a confined cell at
contain mineral assemblages developed at higher tempera- constant differential pressure under a steady-state gas flow
tures. using at least five pore fluid pressure levels (Tanikawa and
In order to perform measurements in saturated condi- Shimamoto, 2008). Corresponding gas flow rates were mea-
tions, the samples were evacuated in a desiccator and sub- sured with different flowmeters that allow for the detection
sequently saturated with (de-ionized) water (TU Darmstadt of flow rates in the range between 10 and 10 000 cm min−1 .
and GFZ) or the samples were fully immersed in water for This applied method is based on Darcy’s law enhanced by
up to 4 weeks (RWTH Aachen and UniTO). factors for the compressibility and viscosity of gases in or-
der to calculate the gas permeability (Scheidegger, 1974;
Jaritz, 1999). The water equivalent permeability was derived
5.2 Non-destructive tests
from the gas permeability after the Klinkenberg correction
At TU Darmstadt, density measurements were performed in (Klinkenberg, 1941). At TU Darmstadt the samples were an-
a multi-step procedure using an AccuPyc helium pycnome- alyzed with dried compressed air at five pressure levels rang-
https://doi.org/10.5194/essd-13-571-2021 Earth Syst. Sci. Data, 13, 571–598, 2021582 L. M. Weydt et al.: Petrophysical and mechanical rock property database
ing from 1 to 3 bar and 1 MPa confining pressure (Hornung dit Lab, Proceq, Switzerland according to ASTM D2845-08,
and Aigner, 2004; Filomena et al., 2014). At GFZ a con- 2008; GFZ – Panametrics HV pulser–receiver model 5058PR
fining pressure of 8.5 MPa and five pressure levels ranging in combination with digital oscilloscope model DSO6012A
between 7.5 and 35 bar were applied (operated with argon), from Agilent Technologies, USA) comprising point-source
while at UNAM the permeability was determined using a transmitter–receiver transducers. Thereby, the transducers
confining pressure of 2.8 MPa and also five pressure levels up were pressed against the parallel surfaces of the samples us-
to 1 MPa (operated with nitrogen). Measurement accuracy of ing a contact pressure of about 1 bar. Polarized pulses at high
the TU Darmstadt permeameter varies from 5 % for highly voltage in a frequency range from 20 kHz to 1 MHz for the
permeable rocks (K > 10−14 m2 ) to 400 % for impermeable USG-40 and Panametrics as well as from 54 to 250 kHz for
rocks (K < 10−16 m2 ) (Bär, 2012). The recorded flow rates the Pundit Lab were generated. The transmitted signals were
were tested for turbulent fluid flow according to Kushnir et recorded using digital oscilloscopes, and the arrival times of
al. (2018) prior to the Klinkenberg correction to ensure a lam- the P and S waves were picked manually and corrected for
inar fluid flow. A correction after Forchheimer (1901) was the dead time, which arises from the recording device (trans-
not required, since the corrected values were within the error ducer, function generator, oscilloscope).
range of the measurement device. Bulk density and P- and S-wave velocities were used to de-
At TU Darmstadt, thermal conductivity and thermal diffu- termine dynamic elastic mechanical parameters, such as the
sivity were measured simultaneously on oven-dried and satu- dynamic shear modulus, Gdyn ; dynamic Young’s modulus,
rated plugs using a thermal conductivity scanner (Lippmann Edyn ; and dynamic Poisson ratio, µdyn , after Zoback (2011):
and Rauen, Germany) after Popov et al. (1999, 2016). The
device consists of a sample platform and an optical scan- vs2
Gdyn = , (1)
ning system that moves along the sample surfaces, including ρ
a heat emitter and three infrared sensors facilitating a contin- ρvs2 (3vp2 − 4vs2 )
uous profile. Samples are heated up by a defined heat flow, Edyn = , (2)
vp2 − vs2
and the subsequent cooling rate is measured by the tempera-
ture sensors. Bulk thermal conductivity and thermal diffusiv- vp2 − vs2
ity were then calculated after Bär (2012) by using two refer- µdyn = , (3)
2(vp2 − vs2 )
ence standards. Both parameters were measured four to six
times on each plug for saturated and dry conditions, respec- where ρ is the bulk density [kg m−3 ], νp is the compressional
tively (two to three times on every planar surface including wave velocity [m] and νs is the shear wave velocity [m].
slight turning after every measurement to account for sample Additional field measurements of P-wave velocities were
anisotropy). At RWTH Aachen, the same optical scanning performed by UniTO on irregularly shaped outcrop samples
method was used to determine thermal conductivity along the by using the same Pundit Lab Proceq device along differ-
core axis of large cylindrical cores with diameters of 60 and ent directions on the sample surfaces in order to identify
64 mm. To ensure uniform reflection conditions, the samples anisotropy and the effect of fractures. Measurements were
were painted with black acrylic paint on the planar surface conducted following ASTM D2845-08 (2008) standard re-
(TU Darmstadt) and along the core axis (RWTH Aachen). quirements. At TU Darmstadt both velocities were measured
According to Lippman and Rauen (2009), the measurement four to six times on each plug in both saturated and dry con-
accuracy for thermal conductivity and thermal diffusivity is ditions. For analyzing the samples in saturated conditions,
3 % and 5 %, respectively. the samples were stored in degassed and de-ionized water to
Specific heat capacity was determined at TU Darmstadt avoid desaturation. After preparing the device and measure-
using a heat-flux differential scanning calorimeter (C80; Se- ment setup, the samples were immediately installed between
taram Instrumentation, 2009); crushed sample material was the transducers and the transmitted signals were recorded un-
heated at a steady rate from 20 up to 200 ◦ C within a period of til the sample started to desaturate. The data provided by
24 h. Specific heat capacities were derived from the resulting GFZ represent average values from at least 4 to 10 individual
temperature curves through heat flow differences. The accu- measurements per plug (dry and saturated conditions), and
racy is 1 % (Setaram Instrumentation, 2009). Volumetric heat at UniTO each sample was analyzed up to 20 times in or-
capacity was calculated by multiplying the specific heat ca- der to depict the matrix heterogeneity of the larger cores and
pacity with the associated bulk density of each sample. For outcrop samples. The error in P-wave velocities is 3 % on av-
direct comparison, specific heat capacity was calculated for erage, whereas for S-wave velocities the average error is 8 %
each plug by dividing thermal conductivity by the product of or higher, due to the higher attenuation and distortion of the
bulk density and thermal diffusivity (Buntebarth, 1980). S-wave signals.
Ultrasonic wave velocity was measured along the sam- Electric resistivity measurements were carried out on se-
ple axis with pulse generators (TU Darmstadt – UKS-D in- lected cylindric plugs at GFZ and UniTO and on out-
cluding a USG-40 pulse generator and a digital PicoScope crop samples in the field. At UniTO electric resistivity
oscilloscope from Geotron-Elektronik, 2011; UniTO – Pun- measurements were performed with a purpose-built square
Earth Syst. Sci. Data, 13, 571–598, 2021 https://doi.org/10.5194/essd-13-571-2021L. M. Weydt et al.: Petrophysical and mechanical rock property database 583
quadrupole (Syscal-Pro from Iris Instruments, France) after Furthermore, a multi-sensor core logger (MSCL) from
Clement et al. (2011). This consists of a rubber jacket with Geotek (2000) was used for measurements of gamma den-
four steel electrodes (2 mm diameter and 40 mm length), ar- sity, P-wave velocity, magnetic susceptibility and electrical
ranged at the edges of two perpendicular diameters of the resistivity at RWTH Aachen on whole cores with a diameter
core sample at half of its longitudinal length. Electrical resis- of 60–64 mm. Matrix density was calculated based on attenu-
tivity measurements were performed with a current injection ation of gamma rays emitted from cesium-137, while poros-
between two subsequent electrodes and detection of the re- ity was calculated from the density measurements. P-wave
sulting electric potential between the remaining pair of elec- velocity was measured using P-wave transducers (receiver
trodes. Current and potential electrodes were progressively and transmitter) mounted on opposite faces on the center sen-
reversed and rotated around the sample for a total of eight sor stand. A short pulse is produced at the transmitter, which
different potential measurements. The sequence was repeated propagates perpendicularly to the axis of the core and is de-
three times, and each sample was tested in both dry and sat- tected by the receiver on the other side. The outer diameter
urated (wet) conditions. Saturated conditions were reached of the core is measured with an accuracy of 0.1 mm. An ab-
by immersing the sample in a saline solution (with electri- solute accuracy of ±3 m s−1 is achievable while computing
cal conductivity equal to 1000 µS cm−1 ) for 24 h. A detailed the P-wave velocity. Magnetic susceptibility was determined
description of the measurement procedure is also included in using a Bartington loop sensor with a 5 % calibration accu-
Vagnon et al. (2019). racy. The sensor includes an oscillator circuit that generates
Electric resistivity measurements at GFZ were executed a low-intensity alternating magnetic field at 0.565 kHz.
with a four-electrode layout as well using an impedance
spectrometer (Zahner Zennium electrochemical work sta- 5.3 Destructive tests
tion; Zahner Scientific Instruments, 2008), which supplied
an AC voltage with an amplitude of 200 mV via disc-shaped Simple (non-cyclic) and cyclic uniaxial tests were performed
current electrodes to the plane-parallel faces of the sample to determine the rock’s unconfined compressive strength and
cylinders. The sample resistance was determined via detec- elastic rock mechanical properties, such as the static Young’s
tion of the impedance and the phase angle at distinct frequen- modulus, Poisson’s ratio, G modulus (also known as shear
cies. Subsequently, the bulk resistivity was calculated from modulus) and bulk modulus. For the determination of the
the sample resistance at 1 kHz, the cross-sectional area of unconfined compressive strength (UCS) at TU Darmstadt,
the sample, and the distance between the potential electrodes cylindrical plugs with a diameter of 40 mm and a length
that were pinned to the cylinder surface of the sample plugs. of 80 mm were introduced into a hydraulic uniaxial press
The measurements were performed on dry and on saturated (FORM+TEST Prüfsysteme, Germany) with a capacity of
samples. Oven-dry sample cores were saturated under vac- 1000 kN and a maximum loading rate of 0.5 kN s−1 until
uum with a NaCl solution with electrical conductivity equal sample failure. The stress at this particular point represents
to 1080 µS cm−1 and equilibrated for about 24 h. Prior to the the UCS, which was calculated according to ASTM D7012-
measurements the samples were jacketed with a tight-fitting 14 (2014) and DIN 18141-1:2014-05:
silicon sleeve to reduce the risk of desaturation. The accu-
F
racy of measurements in dry conditions is better than 3.5 %. UCS = , (4)
In contrast, in saturated conditions for porous samples, the A
error increases to a maximum of 16 % if fluid evaporates or where F is the load at failure [N] and A is the cross-
leaks from the pore space during the measurement interval. sectional area of the sample [mm2 ]. Whenever the plugs
The formation factor, F , of the samples was determined were shorter than 80 mm and did not fulfill the required 2 : 1
after Flovenz et al. (2005) from linear plots of bulk conduc- length / diameter ratio, a correction function was applied as
tivities versus fluid conductivities at different brine concen- proposed by DIN 18141-1:2014-05:
trations, where F is the reciprocal of the linear fitting lines of
the data points measured at fluid salinities varying between 8 · σU
σU(2) = , (5)
0.56–10.42 S m−1 . 7 + 2 dl
Magnetic susceptibility was analyzed using the magnetic
susceptibility meter SM30 (ZH Instruments, 2008), which where σU(2) is the corrected UCS [MPa] and σU the mea-
consists of an oscillator with a pickup coil. An interpolat- sured UCS [MPa], respectively, and d is the sample diameter
ing mode was applied including two air reference measure- [mm], while l denotes its length [mm]. At TU Darmstadt the
ments and one measurement directly on the sample surface. destructive tests using the hydraulic uniaxial press were per-
The frequency change in the oscillator is proportional to the formed “force controlled” with a maximum loading rate of
magnetic susceptibility of the rock sample. To ensure optimal 0.5 kN s−1 . The exceptions form very soft or fragile samples,
contact of the sensor on the sample surface and to reduce the such as ignimbrites, pumice or intensively fractured lime-
impact of air while measuring, only the plane surfaces of the stones. For these samples, the loading rate was individually
plugs were analyzed. reduced to 0.25 or 0.1 kN s−1 to meet the test requirements
https://doi.org/10.5194/essd-13-571-2021 Earth Syst. Sci. Data, 13, 571–598, 2021You can also read