Using R in hydrology: a review of recent developments and future directions - Hydrol-earth-syst-sci.net
←
→
Page content transcription
If your browser does not render page correctly, please read the page content below
Hydrol. Earth Syst. Sci., 23, 2939–2963, 2019
https://doi.org/10.5194/hess-23-2939-2019
© Author(s) 2019. This work is distributed under
the Creative Commons Attribution 4.0 License.

Using R in hydrology: a review of recent developments
and future directions
Louise J. Slater1 , Guillaume Thirel2 , Shaun Harrigan3 , Olivier Delaigue2 , Alexander Hurley4 , Abdou Khouakhi5 ,
Ilaria Prosdocimi6 , Claudia Vitolo3 , and Katie Smith7
1 School of Geography and the Environment, University of Oxford, Oxford, OX1 3QY, UK
2 HYCAR    Research Unit, IRSTEA, 1 Rue Pierre-Gilles de Gennes, 92160 Antony, France
3 Forecast Department, European Centre for Medium-Range Weather Forecasts (ECMWF),

Shinfield Park, Reading, RG2 9AX, UK
4 School of Geography, Earth and Environmental Sciences, University of Birmingham, Birmingham, B15 2TT, UK
5 School of Architecture, Building and Civil Engineering, Loughborough University, Loughborough, LE11 3TU, UK
6 Department of Environmental Sciences, Informatics and Statistics, Ca’ Foscari University of Venice, 30172 Venice, Italy
7 Centre for Ecology & Hydrology, Maclean Building, Crowmarsh Gifford, Wallingford, OX10 8BB, UK

Correspondence: Louise J. Slater (louise.slater@ouce.ox.ac.uk)

Received: 31 January 2019 – Discussion started: 18 February 2019
Revised: 4 June 2019 – Accepted: 14 June 2019 – Published: 12 July 2019

Abstract. The open-source programming language R has               ences, application programming interfaces (APIs) providing
gained a central place in the hydrological sciences over           new avenues for data acquisition and provision, enhanced
the last decade, driven by the availability of diverse hydro-      teaching of hydrology in R, and the continued growth of the
meteorological data archives and the development of open-          community via short courses and events.
source computational tools. The growth of R’s usage in hy-
drology is reflected in the number of newly published hy-
drological packages, the strengthening of online user com-
munities, and the popularity of training courses and events.       1   Introduction: the rapid rise of R in hydrology
In this paper, we explore the benefits and advantages of
R’s usage in hydrology, such as the democratization of data        In recent decades, the hydrological sciences, like many other
science and numerical literacy, the enhancement of repro-          disciplines, have witnessed major changes due to the growth
ducible research and open science, the access to statistical       of diverse data archives and the development of computa-
tools, the ease of connecting R to and from other languages,       tional resources. Hydrology has benefited from the increase
and the support provided by a growing community. This pa-          in publicly accessible data, including (a) observational river
per provides an overview of a typical hydrological work-           flow archives (Hannah et al., 2011) such as the World Mete-
flow based on reproducible principles and packages for re-         orological Organization’s Global Runoff Data Centre, which
trieval of hydro-meteorological data, spatial analysis, hydro-     currently includes more than 9500 stations from 161 coun-
logical modelling, statistics, and the design of static and dy-    tries, (b) gridded reanalysis climate data products such as
namic visualizations and documents. We discuss some of the         Copernicus’s ERA-Interim (Dee et al., 2011) or ERA5 (Hers-
challenges that arise when using R in hydrology and use-           bach et al., 2018; Copernicus Climate Change Service,
ful tools to overcome them, including the use of hydrologi-        2018), (c) measurements from sensors and satellites, such as
cal libraries, documentation, and vignettes (long-form guides      total water storage variations from the Gravity Recovery and
that illustrate how to use packages); the role of integrated de-   Climate Experiment (GRACE; Tapley et al., 2004) or snow
velopment environments (IDEs); and the challenges of big           cover area from NSIDC MODIS (Hall and Riggs, 2016), and
data and parallel computing in hydrology. Lastly, this paper       (d) catchment attributes such as the Global Streamflow In-
provides a roadmap for R’s future within hydrology, with           dices and Metadata Archive (Do et al., 2018) or national
R packages as a driver of progress in the hydrological sci-        datasets such as GAGES-II (Falcone, 2011) and CAMELS

Published by Copernicus Publications on behalf of the European Geosciences Union.
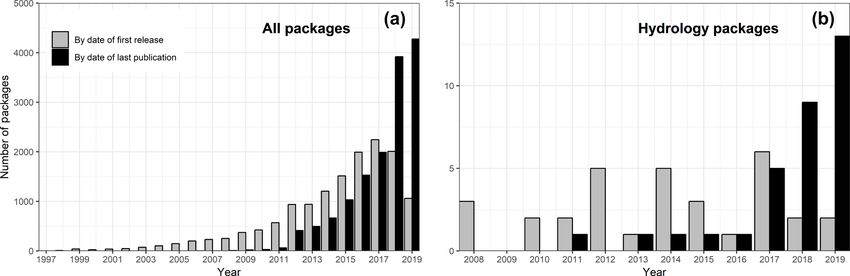
2940                                                                                             L. J. Slater et al.: R in Hydrology

(Addor et al., 2017). Together, these datasets have facilitated        satile and has a wide range of uses, including data acqui-
the investigation of many catchments as well as interdisci-            sition and provisioning, manipulation, analysis, modelling,
plinary research linking meteorology, climatology, hydrol-             statistics, visualization, and even well-developed geospatial
ogy, and the earth sciences.                                           and geographic information system (GIS) applications. R
   In addition to the availability of large-scale data archives,       can be used for generating reports, making interactive pre-
the increase in computational power and uptake of program-             sentations for teaching or conferences, or even prototyp-
ming languages have also been a major driver of change in              ing dashboards and web applications. One of the greatest
the discipline. Increasingly, hydrologists are using data sci-         strengths of R is its extremely active community of users,
ence approaches to derive process insights from large and              who, in the past 25 years, have developed and released in the
complex datasets (e.g. Guo, 2017). The ability to explore and          public domain more than 14 000 packages spanning many
mine these datasets has facilitated a move from in-depth ex-           scientific disciplines. The Comprehensive R Archive Net-
periments in single catchments towards large-sample studies            work (CRAN; https://cran.r-project.org) is the main repos-
(e.g. Villarini et al., 2009; Berghuijs et al., 2014; Slater et al.,   itory for these packages, hosted by a network of FTP and
2015; Archfield et al., 2016; Blöschl et al., 2017; Blum et al.,       web servers around the world. The abrupt increase in the
2017; Harrigan et al., 2018). By applying an analysis to many          number of hydrological package updates in 2018–2019 ex-
catchments, or grouping those with similar characteristics,            emplifies the growing importance of the language in hydrol-
hydrologists have been able to test the broad applicability            ogy and strengthening of the community (Fig. 1). These de-
of hydrological theories and draw systematic insights about            velopments have allowed the R language to fit comfortably
hydrological processes (e.g. Blöschl et al., 2013). Large-             in production-ready ecosystems (e.g. web applications) and
sample studies are increasingly being employed to develop              take advantage of cutting-edge technologies and tools for im-
novel (conceptual and/or physical) models that are applica-            proving reproducibility, testing, and continuous integration.
ble across diverse catchment conditions, thereby improving                This paper aims to provide a broad overview of the utility
process understanding and leading to more robust predictions           of R in the hydrological sciences and of important develop-
(e.g. Gupta et al., 2014). At the same time, a broad range             ments in recent years. In Sect. 2 we provide a summary of
of well-established lumped (e.g. GR4J; Perrin et al., 2003)            the many benefits and advantages of using R in hydrology. In
and semi-distributed (e.g. TOPMODEL, Beven, 1997) mod-                 Sect. 3 we describe some of the key hydrological packages
els of the hydrological cycle – many of which were initially           that have been developed by the community as well as gen-
developed in older languages such as Fortran – have now                eral packages of broad application in the sciences. In Sect. 4
been incorporated into R packages. Some of them have been              we discuss some of the challenges that the hydrologic R users
translated into R, and others remain in their initial languages,       (R-Hydro) community faces, including tools and solutions to
e.g. SWAT (Neistsch et al., 2005). The uptake of empirical,            overcome these challenges. Finally, in Sect. 5 we list some of
conceptual, and physically based computational hydrologi-              the future directions to strengthen the computational hydrol-
cal models as well as the growth of large-sample studies               ogy community.
have driven the emergence of a field that can be described
as computational hydrology (e.g. Hutton et al., 2016; Melsen
et al., 2017): a scientific paradigm that allows hydrologists          2     The benefits and advantages of using R in hydrology
to explore hydrological questions with a computational ap-
proach. Computational hydrology aims to develop repro-                 2.1    Democratizing open science and numerical literacy
ducible hydrological analyses that can be applied to many
catchments, with the aim of generating novel and system-               One of the principal advantages of R is its ease of use, result-
atic process insights that improve our physical understanding          ing from typically detailed documentation, a large number
of the hydrological cycle. The field differs somewhat from             of online resources, object-oriented programming (the lan-
both hydroinformatics (e.g. Abbott et al., 1991), which has a          guage is organized around objects with unique attributes),
greater focus on information and communication technolo-               functional programming (the code can be written with func-
gies and/or black-box approaches to address water-related              tions to facilitate modularity and avoid changing-state data),
issues, and geocomputation, (e.g. Openshaw and Abrahart,               and the availability of the source code under the open-source
2000; Lovelace et al., 2019), which uses similar computa-              license. Further, R can be run on all major operating sys-
tional techniques for spatial data analysis.                           tems (i.e. Microsoft Windows, macOS, and Linux), making
   The growth of computational hydrology has been en-                  it ideal for institutional or personal use. In contrast with com-
hanced by the development of the open-source program-                  piled languages, such as C or Fortran, R is an interpreted
ming language R, originally developed for statistical com-             language, which means that the code can be written and ex-
puting by Ross Ihaka and Robert Gentleman in the 1990s                 ecuted line by line. In practice this means that achieving a
(Ihaka and Gentleman, 1996; R Core Team, 2018) and sup-                basic hydrological analysis can be as simple as writing a se-
ported by an enthusiastic and rapidly growing online com-              quence of commands for reading a file, cleaning the data, and
munity. As a free multiplatform language, R is highly ver-             plotting a graph. These sequences of commands are typically

Hydrol. Earth Syst. Sci., 23, 2939–2963, 2019                                        www.hydrol-earth-syst-sci.net/23/2939/2019/
L. J. Slater et al.: R in Hydrology                                                                                                     2941

Figure 1. The number of R packages available on CRAN (1997–2019). All packages are shown in (a), and hydrology packages only (defined
as those that include the string “hydro” within the package metadata; erroneous packages containing terms like hydrocarbon were removed)
are shown in (b). Bar colours indicate number of packages published based on (1) date of first release (grey bars; https://cran.r-project.org/
src/contrib/Archive/) and (2) date of last publication – i.e. most recent publication date of packages that are currently available on CRAN
(black bars; https://cran.r-project.org/web/packages/available_packages_by_date.html). In both cases each package is counted only once; for
example the package hydroTSM was first released in 2010 (grey), but its most recent update was in 2017 (black). The script to produce this
figure is provided in the Supplement. Data were downloaded from CRAN on 23 June 2019; thus the year 2019 is incomplete.

collated in an R Script; together, multiple scripts may con-             computing skills to researchers since 1998, and R now forms
stitute a hydrological workflow (see Fig. 3). A high level of            a central part of their training. Over the past decade or so,
documentation and support exists for each of the tasks within            R has become one of the core tools for scientific compu-
a hydrological workflow, including a diverse range of pack-              tation in hydrology. Hosted instances of R allow the user
ages (see Sect. 3). R users may search for R-relevant con-               to run R and RStudio® (an integrated development environ-
tent (such as expressions, packages, and functions) using the            ment – IDE; described in greater detail in Sect. 4.2) in the
dedicated Internet search engine, RSeek (https://rseek.org),             cloud, i.e. in a web browser rather than locally on one’s own
as well as generalist search engines. For many R newcomers,              computer. These hosted instances have made the language
the initial hurdle is finding the time required to gain a basic          more accessible to non-specialists due to the large range
understanding of R itself; but these efforts pay off rapidly as          of pre-installed packages. Importantly, the RStudio Cloud
one learns how to find solutions on the Internet (see Sect. 2.5)         (https://rstudio.cloud/) has recently been developed to make
and to navigate help files provided within R.                            it easy for professionals, hobbyists, trainers, teachers, and
   One of the advantages of writing a script is that it can              students to do, share, teach, and learn data science using R
be reused and improved incrementally over time so that the               and provides many learning materials, including interactive
author never has to repeat a task manually (in contrast to               tutorials covering the basics of data science, cheat sheets for
point-and-click software that lacks a programmatic inter-                working with popular R packages, and a guide to using RStu-
face). Moreover, the same script can be reused repeatedly by             dio Cloud. Such hosted instances of R remove the initial hur-
different people to reproduce a given result (avoiding dupli-            dle of installing R and the required packages (i.e. the techni-
cation of efforts) or to analyse different data, e.g. different          calities) and ultimately make scientific work more accessible.
catchments, different types of gridded data, or the same data               The R-Hydro community has developed a number of plat-
at different points in time. Thus, scripts written in R (or other        forms to share computational hydrology analyses, and code
languages) have wide-ranging benefits, as they facilitate the            is increasingly being shared via repositories (see Sect. 5.1).
testing and quality control of the scientific workflow, can be           Code and results can be published as traditional media (e.g.
shared and improved by a team of users, lessen the risk of               as articles, supplemental material, scripts, packages, or com-
making manual mistakes, and significantly enhance the speed              putational environments) or on the web via blog posts, snip-
with which analyses can be conducted and updated.                        pets, or tutorial documents, allowing users to engage inter-
   Recent developments in R have contributed to enhancing                actively. The “literate programming” paradigm (i.e. inter-
open science and numerical literacy in the hydrological sci-             spersing snippets of code and written text within a unique
ences. R’s ease of access and use has improved what might                document; see Knuth, 1984) has also become increasingly
be termed “scientific computing literacy” within the hydro-              popular due to the development of dashboards and online
logical community. Volunteer projects such as the Software               publishing platforms. Dashboards are interfaces that may in-
Carpentry (Wilson, 2006, 2014) have been teaching basic                  clude a group of related data visualizations such as charts,

www.hydrol-earth-syst-sci.net/23/2939/2019/                                             Hydrol. Earth Syst. Sci., 23, 2939–2963, 2019
2942 L. J. Slater et al.: R in Hydrology
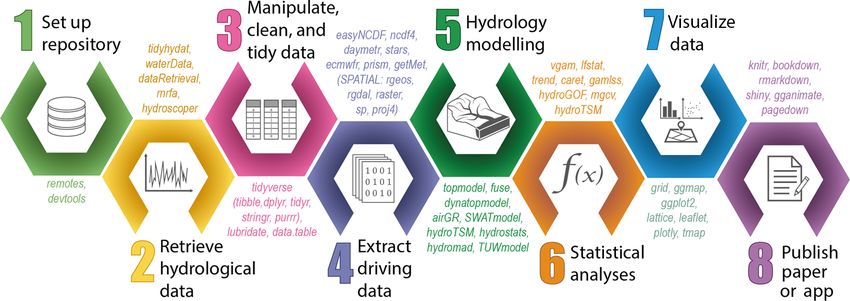
Figure 2. The EGU short course Using R in Hydrology, 11 April 2018.
Figure 3. A typical hydrological workflow in R, containing eight steps. A selection of relevant R packages used within each script is indicated
in coloured text; these packages are described in further detail in Sect. 3.1 to Sect. 3.8.
graphs, tables, and maps (e.g. Fig. 6). They can be fixed reproduce and verify previous findings. Encouraging repro-
(e.g. a non-interactive web page) or dynamic (e.g. allow- ducible practices helps reduce the likelihood of errors (meth-
ing users to alter input values and see how outputs change ods can be tested by other researchers) while increasing the
virtually in real time). Hydrologists have increasingly em- uptake of any positive developments within a discipline (Hut-
ployed dashboards to display their analyses in an interac- ton et al., 2016). However, scientific research is increasingly
tive, user-friendly manner, using packages such as plotly, under fire for its lack of reproducibility due to an inadequate
a graphing library that makes publication-quality graphs methodology description (Ceola et al., 2015) and model and
online (Sievert, 2018), the shiny web application frame- data availability. True reproducibility requires more than the
work (Chang et al., 2015), shinydashboard (Chang and mere repeatability of results with the same computer code
Borges Ribeiro, 2018), or the flexdashboard package and data: one must also be able to reproduce a study’s con-
(Iannone et al., 2018). Additionally, free services such as clusions when testing the theory with different data or a dif-
RPubs (a free web-publishing platform; https://rpubs.com) ferent model set-up (Melsen et al., 2017).
and the aforementioned plotly enable the publishing of The open-source nature of R packages and the CRAN
these static or interactive documents and visualizations on- repository set-up are one key added value of R to repro-
line. In doing so, these publishing services facilitate immedi- ducible geoscientific research (Pebesma et al., 2012). The
ate interaction and knowledge transfer. CRAN repository ensures the traceability of past analy-
ses by archiving former versions of the packages com-
2.2 Enhancing reproducible hydrological research and piled on any platform (https://cran.r-project.org). In addi-
open science tion, packages are citeable in reports and papers together
with their version number, allowing the user to track which
Reproducibility is a key feature of the scientific method and code was used. The package developers are also “trace-
can be broadly defined as the ability for the community to
Hydrol. Earth Syst. Sci., 23, 2939–2963, 2019 www.hydrol-earth-syst-sci.net/23/2939/2019/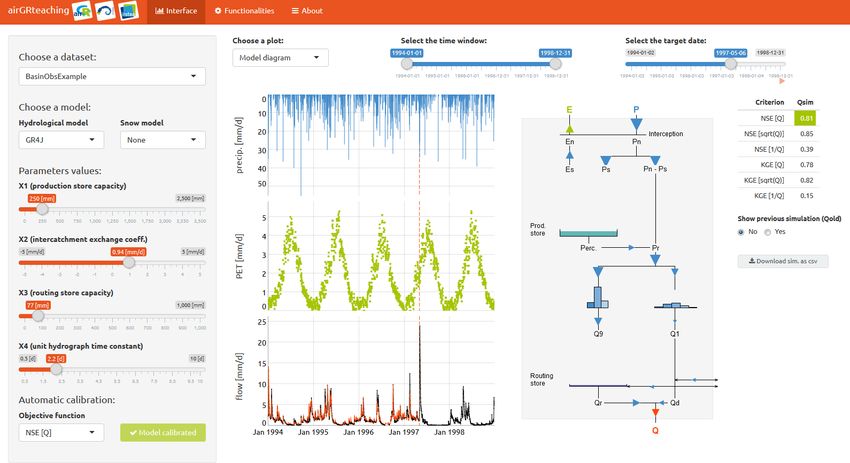
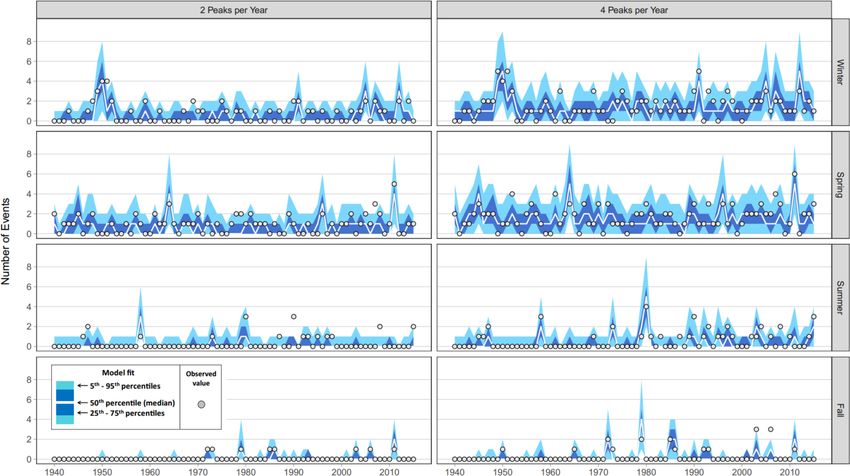
L. J. Slater et al.: R in Hydrology                                                                                                    2943

Figure 4. An example of a figure in a paper produced in R with the package ggplot2 using the facet_grid function, which allows the
user to split a dataset by categories (rows and columns). Here, a probabilistic time-series GAMLSS model of flood frequency at one gauging
station in Ohio, USA, is shown for four different seasons (rows) and two peak-over-threshold quantities (columns: two to four peaks per
year). The probabilistic model is plotted in the background as colour ribbons (using geom_ribbon), and the observed values are plotted in the
foreground as grey circles (geom_point). Source: Neri et al. (2019).

able” on the CRAN via their ORCID (Open Research and                     nal of Water Resources Planning and Management and Jour-
Contributor ID) number, which provides an indication of                  nal of Hydrologic Engineering now actively encourage au-
whether they also authored any corresponding scientific pa-              thors to publish the data and computer codes underlying the
pers. The CRAN Task Views provide guides to the pack-                    results presented in their papers. The journal Nature states
ages and tools that exist on CRAN for the different dis-                 that a manuscript can be rejected if the code used to generate
ciplines. Note that many packages are submitted to online                new analyses cannot be provided to the editors and review-
repositories such as GitHub that never make it to CRAN                   ers. Despite the advantages of sharing hydrological code, few
for a range of reasons, but this does not necessarily make               computational hydrologists do this because cleaning and an-
them less reliable. The Task Views provide a list of tools               notating the code places an additional burden on the pub-
which can enhance reproducibility in R (see https://cran.                lishing time frame. However, it is reasonable to assume that
r-project.org/web/views/ReproducibleResearch.html). Rely-                as more journals require submission of codes with papers,
ing on well-established publishing platforms such as CRAN                the community of computational hydrologists (and associ-
and GitHub has promoted the use of best practice in writ-                ated fields) will continue to grow and strengthen the field. In
ing R code. Packages such as rhub (Csárdi, 2017) pro-                    addition to the sharing of open-source code, reproducibility
vide code checks for packages on certain operating systems,              experts also advocate the use of software tool sets such as
while roxygen2 helps users create documentation for their                version control, scripting, container technology, and compu-
R packages (Wickham et al., 2018a). Other initiatives, such              tational notebooks to enhance the reproducibility of scien-
as rOpenSci (carefully vetted scientific R software tools; see           tific results (Perkel, 2018). Hydrological tutorials, vignettes,
https://ropensci.org) and their code peer review, have facili-           or teaching documents increasingly implement literate pro-
tated the implementation of best practice whilst holding au-             gramming (Sect. 2.1), where the code and results are de-
thors to scientific scrutiny.                                            scribed in plain English within the same document or web
   Journals in the field of hydrology such as Hydrology and              page.
Earth System Sciences, Water Resources Research, and the                     In the hydrological sciences, several ongoing open scien-
American Society of Civil Engineers (ASCE) journals Jour-                tific initiatives can be noted other than the R packages that

www.hydrol-earth-syst-sci.net/23/2939/2019/                                            Hydrol. Earth Syst. Sci., 23, 2939–2963, 2019
2944                                                                                                  L. J. Slater et al.: R in Hydrology

Figure 5. Use-case scenario for implementation of APIs developed within hydrological sciences. Group A collates the most recent earth-
and ground-based observations of land cover, topography, and climate data for an in-house project yet allows an API to interact with an
analysis-ready, spatially explicit dataset for their region of interest. Group B is interested in geomorphological processes and has developed
a model to predict likely occurrence of mass movements, which they also provide access to via an API. During a period of extreme rainfall
over a scientifically unrelated region, both groups decide to adjust their methods and API to provide pertinent data (group A), which feed into
predictions of landslide risk (group B). Finally, a disaster relief organization (group C) can swiftly act and use the outputs from the adapted
API (A + B) to develop a simple web application with maps and warnings for use by the general public in the affected area.

are discussed in Sect. 3. These initiatives include the Hy-               flow, the question and answer website for programmers, on
droShare web-based system for sharing hydrologic data and                 18 May 2019 generated 12 339 results with the tag “R”,
models, which allows hydrologists to visualize, analyse, and              9582 results with Python, 4916 with Java, 2623 with C#,
work with data and models on the HydroShare website (e.g.                 and 48 with Fortran. R is GNU S, a language which can
creating and publishing a web app resource; Essawy et al.,                be described as the modern implementation of the S lan-
2018). Additionally, the Sharing Water-related Information                guage (Becker and Chambers, 1984; Chambers, 1998), and
to Tackle Changes in the Hydrosphere for Operational Needs                is specifically optimized for statistical computing. In addi-
(SWITCH-ON) virtual laboratory aims to explore the poten-                 tion to the standard statistical techniques within base-R (i.e.
tial of open data for water security and management (Ceola                the inbuilt basic functions that define R as a language), R
et al., 2015). The reproducibility agenda has benefited from              also provides access to a large variety of advanced and re-
strong political and financial support, with European Union               cent statistical packages, which have been developed by its
projects like FOSTER Plus (Fostering the practical imple-                 user community of statisticians and statistically minded sci-
mentation of Open Science in Horizon 2020 and beyond) that                entists working in a range of research fields. When compar-
aim to encourage open science. The European Commission’s                  ing R with other similar open-source languages, users often
Science with and for Society programme, implemented as                    describe R’s unique selling point as the vast number of sta-
part of Horizon 2020 (European Commission, 2015, p. 17),                  tistical packages which liken it to a free, community-driven
similarly noted that the reuse of research data generated with            statistical software.
public funding should have beneficial impacts for science,                   The statistical and graphical packages provided in R are
the economy, and society. As such, open science is expected               particularly useful for the hydrological sciences and include
to encourage interdisciplinary research and is considered a               techniques such as linear and non-linear modelling, statisti-
key approach to tackle the grand challenges of our time.                  cal tests, time-series analysis, classification, or clustering. A
                                                                          description of specific statistical packages relevant to hydrol-
2.3    Providing statistical tools for hydrology                          ogy is provided in Sect. 3.6.

There are many different types of software for statistical                2.4   Connecting R to and from other languages
analysis, but R is still considered the most powerful and pop-
ular language and environment for statistical computing. For              Many different programming languages are used in hydrol-
example, a search for the word “statistics” on Stack Over-                ogy, including older languages such as Fortran, developed in

Hydrol. Earth Syst. Sci., 23, 2939–2963, 2019                                            www.hydrol-earth-syst-sci.net/23/2939/2019/
L. J. Slater et al.: R in Hydrology 2945
Figure 6. The airGRteaching interface that is used for teaching hydrological modelling. Students can choose a catchment dataset and a
hydrological model and activate a snow model on the top left panel of the interface. Modifying the parameters values (on the left) by using
the sliding bars will automatically update the graphs and scores displayed (on the right). This interface highlights in an interactive manner the
basic principle of the rainfall–runoff relationship and its description in hydrological models. At the bottom left of the interface, an objective
function can be chosen and an automatic calibration procedure can be launched within the interface.
the 1950s (e.g. Backus, 1978), and C in 1972 (e.g. Ritchie, Bellosta, 2012), and XRPython (Chambers, 2017). Addi-
1993); proprietary commercial languages, e.g. MATLAB® , tionally, R can also be connected to JavaScript (e.g. pack-
initially released in 1984 (MathWorks, 2018); and more re- age V8; Ooms, 2017), MATLAB (e.g. package R.matlab;
cent open-source languages like Python, which appeared in Bengtsson, 2018), or Julia (packages JuliaCall and
1990 (e.g. Sanner et al., 1999; Guttag, 2013), R in 1993 (e.g. XRJulia; Chambers, 2018; Li, 2018). Conversely, connect-
R Core Team, 2018; Ihaka, 1998), and Julia in 2012 (Bezan- ing other languages to R is also possible. For example, rpy2
son et al., 2012). (Gautier, 2018) is the Python interface to the R language and
S and R were both built using algorithms implemented runs an embedded R, providing access from Python using R’s
mostly in Fortran and sometimes in C (Chambers, 2016, own C application programming interface (API). The Python
p. 55), which is why R can be connected natively to both library pyRserve (Heinkel, 2017) also connects Python
languages. Interconnections between R and other languages with R using Rserve (a TCP/IP server which allows other
can be very useful for taking advantage of each language’s programs to use facilities of R). The RCall package allows
strengths or using pre-existing scripts that were originally users to call R from Julia (Bates et al., 2015).
written in other languages. For example, C and Fortran are
both efficient in performing loop tasks. This is the reason 2.5 Interacting with the R-Hydro community: scientific
why the apply function loops are coded in C. The airGR hy- resources and courses
drological models (Coron et al., 2017, 2018) also make use
of Fortran in order to take advantage of its CPU efficiency. One of the major advantages of R is the extensive user
R can also be connected to different languages using community, which provides ample support to newcomers
a range of packages, e.g. C++ (package Rcpp; Eddel- through various initiatives and is growing at a fast pace.
buettel and Balamuta, 2017) and Java (package rJava; R-Hydro beginners are strongly encouraged to join the
Urbanek, 2018). Connections to Python can be achieved discussion on various R-related topics on social media.
with the packages reticulate (Allaire et al., 2018b), On Twitter, the “#rstats” community is particularly active,
rPython (Bellosta, 2015), rJython (Grothendieck and and users are exposed to communication about a range
of new packages and recent developments. Stack Overflow
www.hydrol-earth-syst-sci.net/23/2939/2019/ Hydrol. Earth Syst. Sci., 23, 2939–2963, 20192946 L. J. Slater et al.: R in Hydrology (https://stackoverflow.com) is the go-to online discussion fo- governance and foundation model that supports the world- rum for any user, from beginners to expert developers, and wide community of users, maintainers, and developers of R provides code snippets to solve a wide range of common software. The R Consortium provides support to the com- problems. In addition, the R Project also offers thematic munity in multiple ways. One example of such support is mailing lists (https://www.r-project.org/mail.html), relating the grant programme run by the R Consortium’s Infrastruc- to usage (R-help), package development (R-package-devel), ture Steering Committee (ISC), which funds development of and language development (R-devel), in order to help oth- projects seeking to promote improvement of the R infrastruc- ers, report bugs, or propose solutions. More recent but al- ture and to achieve long-term stability of the R community. ready extremely active is the RStudio Community forum (https://community.rstudio.com), which includes users inter- ested in RStudio-developed applications and packages. A wide range of scientific resources, including online 3 R packages in a typical hydrological workflow manuals and tutorials in several languages, have been de- veloped by the community. The rOpenSci project (https: R is an ever-growing environment, as can be seen in the num- //ropensci.org) brings together a community of volunteers ber of R packages that are developed every year (Fig. 1). who promote the open development of packages in a non- There are now hydrological packages for every step of a profit initiative by reviewing scientific R packages before standard hydrological workflow (Fig. 3); we describe each they are uploaded to CRAN. rOpenSci has contributed no- of these steps in subsequent sections. tably to the development of best practice through free code reviews and targeted or invited blog posts. Resources can be 3.1 Setting up a repository and finding the right found in many places online, such as the Journal of Open packages Source Software (JOSS), which hosts a wealth of short pa- pers documenting R packages. Setting up a repository with version control (i.e. a review- Short courses, i.e. voluntary training sessions for R users able and restorable history) at the start of a research project run during conferences like the European Geosciences Union has many advantages. A repository is a structured set of files (EGU) General Assembly, have also grown in popularity in that will track edits any team member makes to the project, the hydrological community in recent years (Fig. 2). Since similar to the track-changes function in common word pro- the 2017 EGU General Assembly, the Using R in Hydrol- cessors. In R, version control can be implemented quite sim- ogy short course has been organized in conjunction with ply by connecting RStudio with Git or Subversion through the Young Hydrologic Society (YHS; https://younghs.com) hosting services like Bitbucket, GitHub, GitLab (which are as part of the annual Hydrological Sciences division pro- like Dropbox for code). There are just a few initial steps gramme. The core aim of the short course is to bring to- to set up a repository. These include (1) creating a local gether the R-Hydro community, including both users who directory (folder) to host your (RStudio) project, (2) creat- are learning to program and advanced users who are either ing a Git or a Subversion repository online, and (3) link- teaching computational hydrology or developing packages ing the two. Beyond those three steps, all the user needs to for hydrological analysis. Recent advances in R for hydrol- do is regularly commit (i.e. save) their code together with ogy applications are demonstrated during the short course, a very brief summary of the changes made. These changes and a platform for open discussion between guest speak- can then be uploaded, updating and synchronizing the online ers and course participants is provided. By rotating topics repository with labelled annotations (username and times- each year, a valuable repository of slides, code examples, and tamp). The repository can be public or private, with differ- follow-up material is provided to the community on GitHub ent levels of administrator access for users. Many tutorials (https://github.com/hydrosoc; see Sect. 5.6 for further infor- on how to set up a repository in R can be found online. mation). It is also worth noting that a regular short course One example is the Software Carpentry course on R for Re- is also run at the EGU on R package development. In addi- producible Scientific Analysis (https://swcarpentry.github.io/ tion to the EGU, other regular conferences and meetings such r-novice-gapminder/), which also provides valuable sugges- as those run by the International Association of Hydrologi- tions on how to structure a project repository (e.g. with read- cal Sciences (IAHS) and the Prediction in Ungauged Basins only source data, disposable generated data, and folders such (PUB; PUB Summer School) also organize R courses during as “scr” for scripts and “doc” for documentation). their meetings. The IAHS Statistical Hydrology (STAHY) Once a project folder or repository has been set up, one commission regularly organizes workshops and short courses might need to identify the most useful R packages and func- on various statistical topics, which typically come with a tions for the task at hand. CRAN Task Views were recently computer-based component in R. developed to provide thematic lists of the packages that are Finally, it is worth mentioning that the continued growth most relevant to specific disciplines. The Hydrology Task of the R community is supported by the R Consortium (https: View for “Hydrological Data and Modelling” (https://cran. //www.r-consortium.org/about), a group with an open-source r-project.org/web/views/Hydrology.html) was published to Hydrol. Earth Syst. Sci., 23, 2939–2963, 2019 www.hydrol-earth-syst-sci.net/23/2939/2019/
L. J. Slater et al.: R in Hydrology                                                                                       2947

the CRAN in January 2019 and lists over a hundred pack-               Additionally, many data retrieval packages that are rele-
ages under the following categories:                               vant to hydrological analyses have been developed by related
                                                                   scientific disciplines, such as meteorology and climatology.
  – Data retrieval. This includes hydrological data sources
                                                                   In the future it seems likely that most water and meteoro-
    (surface or groundwater, both quantity and quality) and
                                                                   logical agencies around the world will facilitate access to
    meteorological data (e.g. precipitation, radiation, and
                                                                   these data via APIs and open-source packages (see Sect. 5.4
    temperature, both measurements and reanalysis).
                                                                   for further information on APIs and the possible future of
  – Data analysis. This includes data tidying (e.g. gap fill-      hydro-meteorological data provision). Table 1 is far from ex-
    ing, data organization, and quality control), hydrograph       haustive, and there are many other relevant packages that are
    analysis (functions for working with streamflow data,          available on CRAN. For example, the new ecmwfr package
    including flow statistics, trends, and biological indices),    provides a straightforward interface to the public ECMWF
    meteorology (functions for working with meteorologi-           Web API Services and the Copernicus Climate Data Store
    cal and climate data), and spatial data processing.            (CDS), where open datasets such as the ERA5 reanalysis are
                                                                   openly available (Hufkens, 2018).
  – Modelling. This includes process-based modelling
    (scripts for preparing inputs and outputs and run-             3.3   Packages for reading, manipulating, and cleaning
    ning process-based models) and statistical modelling                 the data
    (hydrology-related statistical models).
                                                                   Once data have been retrieved or downloaded, a broad range
   Additionally, many of the other 38 Task Views that were         of packages are available for reading different types of data
available in January 2019 were relevant to hydrology (https:       and their associated metadata. However, these packages are
//cran.r-project.org/web/views). For example, the Environ-         not specifically hydrological and so will be discussed here
metrics Task View contains a Hydrology and Oceanography            with brevity. Note that in many cases, for example with the
section, and the High-Performance and Parallel Computing           dataRetrieval package, the data are imported directly
with R Task View can also be useful for hydrologists us-           into the R workspace. Basic data formats such as csv and
ing large amounts of data. Other relevant Task Views cover a       txt can be read with base-R (read.table function) or with ad-
range of topics such as time-series analysis, machine learn-       ditional packages that form part of the tidyverse pack-
ing, or spatial analysis.                                          age suite (Wickham, 2017), which facilitate reading a range
   One last way of discovering relevant and useful hydrolog-       of formats including XLS(x), TSV, and FWF (e.g. package
ical packages is social media, such as Twitter, where many         readr; Wickham et al., 2018b). The rio package facili-
hydrologists share their most recent publications as well as       tates data import and export by making assumptions about
links to useful resources and packages. Some of the Twitter        data structure from the file extension (Chan et al., 2018).
handles that highlight relevant packages for computational            For reading or writing netCDF files, a number of pack-
hydrology include the USGS group supporting R scientific           ages like ncdf4 (Pierce, 2017), easyNCDF (BSC-CNS and
programming (https://twitter.com/USGS_R) or the rOpenSci           Manubens, 2017), stars (Pebesma, 2018b), or raster
page (https://twitter.com/ropensci).                               (Hijmans, 2017) can be used. GRIB files can also be handled
                                                                   with packages such as raster or gribr (Wendt, 2018).
3.2   Packages for retrieving hydro-meteorological data
                                                                   There is still relatively minimal support for Open Geospatial
One of the most useful computational advances in recent            Consortium (OGC) services in R, although there are some
years has been the development of packages designed specif-        packages such as sos4R (of which a new version is expected
ically to retrieve data from online hydrological archives. Dif-    to be released on CRAN soon), ows4R (Blondel, 2018b), or
ferent packages have been designed for importing hydro-            geometa (Blondel, 2018a).
metric data from repositories such as dataRetrieval                   Observed hydro-climatological time-series data typically
for the US Geological Survey (USGS) National Water In-             need to be “cleaned” because they suffer from various data
formation System (Hirsch and De Cicco, 2015) or rnrfa              gaps and errors. For an overview of the different issues with
for the UK’s National River Flow Archive (Vitolo et al.,           hydrological data, see Wilby et al. (2017). This step may in-
2016a). Many of these packages provide vignettes that il-          volve handling missing data, checking data completeness, re-
lustrate how to use the functions. For example, the USGS’s         shaping and aggregating data, or converting strings to date
waterData package allows the user to import USGS daily             format. We do not develop this section specifically because
hydrological data from the USGS web services, plot time-           these are general tasks in R. However, for overviews and tu-
series data, fill in missing values, or visualize anomalies over   torials on manipulating and cleaning hydrological data, we
a range of timescales (e.g. 1 year, 30 d, or 1 d) in just a few    point the reader to published resources from the Using R in
lines of code (see the waterData package vignette on the           Hydrology workshop (see Sect. 5.6).
CRAN; Ryberg and Vecchia, 2017). Other relevant packages
are listed in Table 1.

www.hydrol-earth-syst-sci.net/23/2939/2019/                                    Hydrol. Earth Syst. Sci., 23, 2939–2963, 2019
2948 L. J. Slater et al.: R in Hydrology
Table 1. Examples of packages for hydrological and/or meteorological data retrieval. See the Hydrology Task View for latest additions
(https://cran.r-project.org/web/views/Hydrology.html).
Package Description
Hydrological data
dataRetrieval Retrieve USGS and EPA hydrologic and water quality data (Hirsch and De Cicco, 2015)
hddtools Hydrological data discovery tools (Vitolo, 2017)
hydroscoper Interface to the Greek national data bank for hydrometeorological information (Vantas, 2018)
rnrfa Retrieve, filter, and visualize data from the UK National River Flow Archive (Vitolo et al., 2016a)
tidyhydat Extract and tidy Canadian hydrometric data (Albers, 2017)
waterData Retrieve, analyse, and calculate anomalies of daily hydrologic time-series data (Ryberg and Vecchia, 2017)
Climatological data
daymetr Interface to the Daymet web services: NASA daily surface weather and climatological summaries over
North America, Hawaii, and Puerto Rico (Hufkens et al., 2018)
ecmwfr Interface to the public ECMWF API web services (Hufkens, 2018)
getMet Get meteorological data for hydrologic models (Sommerlot et al., 2016)
prism Access the Oregon State PRISM climate data using the web service API data (Hart and Bell, 2015)
rnoaa Interface to NOAA weather data (Chamberlain, 2019)
3.4 Packages for extracting driving data, spatial an interface to the Geometry Engine Open Source (GEOS)
analysis, and cartography library for geometrical operations, or package sf (Pebesma,
2018a), which provides support for simple features to encode
spatial vector data. Version 3.0 of ggplot2 offers support
In the past, R may have been a less powerful alternative to
for visualizing sf objects directly with a specific geometric
the more established spatial software for processing large
object (geom_sf), which allows users to visualize spatial data
datasets and extracting information. Now, however, R can be
(raster and shape files) easily. There is also a range of pack-
parallelized more easily than other software (harnessing the
ages for handling raster data, like raster (Hijmans, 2017),
power of multiple processor cores to handle large datasets)
which can be used to read, write, manipulate, analyse, and
and can integrate GIS analyses within a complete, automated
model gridded spatial data, and stars (Pebesma, 2018b) for
hydrological workflow, which includes data processing steps
reading, manipulating, writing, and plotting spatio-temporal
(before or after any GIS analyses) and any subsequent statis-
arrays. With all these packages, R now has full cartogra-
tical analyses. It is this integration of GIS as one step within
phy and mapping functionality and can produce sophisticated
the hydrological workflow that makes R extremely attractive.
maps that are either static or interactive. Packages such as
As a result, in recent years, R has become the go-to method
cartography (Giraud and Lambert, 2016) or tmap (Ten-
for geocomputation and geostatistics and can now be used as
nekes, 2018) can both be used for creating symbols, choro-
a GIS in its own right. Multiple books have been published
pleth, or other types of maps and for facilitating the visual-
on the topic of spatial analysis and mapping with R (Bruns-
ization of spatial data distributions in thematic maps. These
don and Comber, 2015) or, more broadly, geocomputation
two packages are quite similar in content but not in form:
with R (Lovelace et al., 2019), which includes topics such as
cartography uses the painter’s model, while tmap uses
reading and writing geographic data and making maps in R.
The Grammar of Graphics and allows users to draw static
Many methods are now implemented within R for han-
and dynamic maps with the same code. Additionally, ggmap
dling vectorial data, with packages such as sp (Pebesma and
(Kahle and Wickham, 2013) is commonly used for visual-
Bivand, 2005; Bivand et al., 2013) for plotting data as maps
izing, geolocating, and routing spatial data on top of static
or, for spatial selection, the package rgdal (Pebesma and
maps such as Google Maps; RgoogleMaps is used to in-
Bivand, 2005; Bivand et al., 2013), which provides bindings
teract with Google Maps, while the JavaScript leaflet
to the Geospatial Data Abstraction Library (GDAL) for read-
(Cheng et al., 2018) library can be used for creating inter-
ing and writing data and access to projection and transfor-
active web maps. R software can also be linked to a range
mation operations from the PROJ.4 (Urbanek, 2012) library,
of other GIS software to take advantage of specific capa-
package rgeos (Bivand and Rundel, 2018), which provides
Hydrol. Earth Syst. Sci., 23, 2939–2963, 2019 www.hydrol-earth-syst-sci.net/23/2939/2019/L. J. Slater et al.: R in Hydrology 2949
bilities. R can access ArcGIS geoprocessing tools (ESRI, a dedicated R package called fuse (Vitolo et al., 2016b)
2018) by building an interface between R and the ArcPy that is a re-implementation of the FUSE 2011 model. The
Python side package using the RPyGeo package (Brenning vast majority of the models in the above packages are deter-
et al., 2018b). R can also call wrappers for GDAL–OGR util- ministic; however, the fuse package can also provide en-
ities (GDAL Development Team, 2018) using gdalUtils sembles of conceptual lumped hydrological models, and the
(Greenberg and Mattiuzzi, 2018). There are also interpreted hydromad package is intended to provide a flexible frame-
interfaces between the GRASS GIS (GRASS Development work for assembling different soil moisture accounting and
Team, 2019) and R from within the GRASS environment routing schemes.
or from R using the packages spgrass6 (Bivand, 2016) The above packages typically allow the user to run the
or rgrass7 (Bivand, 2018). R can be integrated with hydrological models, and usually provide some sample in-
the QGIS software (QGIS Development Team, 2018) using put data, with executable examples. Some packages provide
RQGIS (Muenchow et al., 2017) or with SAGA GIS (SAGA optimization algorithms, criteria calculation, and dedicated
Development Team, 2008) using RSAGA (Brenning et al., plotting functions (e.g. airGR and RHMS). Developing hy-
2018a). drological modelling packages in R is relatively straightfor-
ward because of the language’s flexibility; additionally, as
3.5 Packages for hydrological modelling discussed in Sect. 2.4, R can be connected to other pro-
gramming languages. This property allows R users to embed
The next step in a typical hydrological workflow is to conduct model codes that already exist into R and provides a more
hydrological modelling by using the data inputs prepared in friendly environment, as many packages ease the analysis of
previous steps. Hydrological modelling often proceeds by data and model simulations.
simplifying hydrological processes to test hypotheses about
the water cycle, manage water resources, reconstruct incom- 3.6 Packages for hydrological statistics
plete flow time series, predict extreme events (floods or low
flows), or anticipate the effects of future climatic or anthro- R was initially developed as a statistical computing language
pogenic changes. In Table 2 we highlight some of the key and is still the primary language in which novel statistical
packages that facilitate the implementation of certain hy- methods are coded and distributed. Statistical approaches are
drological models in R. As R can be used for every step employed for an extremely wide range of tasks in hydrology,
within the hydrological modelling process, from importing and it is virtually impossible to give complete coverage of all
and cleaning data to exploratory analyses, data modelling, possible packages that might be useful to hydrologists. The
data analysis, and graphical visualization, it represents an skimr package provides compact and flexible summaries
ideal language for hydrological modellers. of data; it can be used with pipes and displays nicely in
Several well-known hydrological models are provided the console. Many estimating procedures can be carried out
in these packages, such as the HBV model in the using the base-R stats package, which includes, for ex-
TUWmodel package (Viglione and Parajka, 2019), TOP- ample, correlation analysis and Mann–Kendall testing, lin-
MODEL in the packages topmodel (Buytaert, 2018) and ear regression, Poisson regression, and Gamma regression.
dynatopmodel (Metcalfe et al., 2015, 2018), SWAT in There are also generalist packages for non-parametric trend
SWATmodel (Fuka et al., 2014), GR4J in airGR (Coron tests such as trend (Pohlert, 2018), which includes a broad
et al., 2017, 2018), and hydromad (Andrews et al., 2011; range of tests for trend detection, correlation, and detection
Andrews and Guillaume, 2018). Some packages also in- of change points or non-randomness. Many general mod-
clude degree-day snow models (e.g. airGR, hydromad, elling packages have been found to be useful by hydrologists,
and TUWmodel) that are used in nival basins to simulate for example mgcv (Wood, 2017), VGAM (Yee et al., 2015),
the accumulation and melt of the snowpack, which greatly and GAMLSS (Rigby and Stasinopoulos, 2005), which im-
impacts the flow regimes. Many of the models included in plements generalized additive regression models for a large
these packages are lumped (i.e. consider the catchment as a number of distributional families. While mgcv can be useful
single unit with area-averaged variables) or conceptual (i.e. for more complex smoothing approaches (e.g. tensor prod-
provide a simplified representation of the physical processes uct smooths or varying coefficient models), the focus of
with empirical equations describing the interactions between GAMLSS is to develop flexible models for a large class of
the processes) models. Some packages, such as TUWmodel distributions which are not part of the exponential family of
and topmodel, allow a spatial distribution of the hydro- distributions, allowing for parameters other than the location
logical processes. TUWmodel, for instance, allows the user to be modelled as a smooth function of the covariates of in-
to implement a semi-distributed application with differentia- terest. A hydrologist might therefore choose which package
tion into elevation zones, while topmodel allows the user to use depending on the most likely distribution of the data
to make topographic index classes from a topographic index which are being analysed and the complexity of the analysis.
map. The FUSE model (Clark et al., 2008), originally im- The caret package (Kuhn et al., 2018) is more commonly
plemented in Fortran, is still actively developed and also has used for predictive modelling and machine learning, as it al-
www.hydrol-earth-syst-sci.net/23/2939/2019/ Hydrol. Earth Syst. Sci., 23, 2939–2963, 20192950 L. J. Slater et al.: R in Hydrology
Table 2. Examples of packages for hydrological modelling. See the Hydrology Task View for latest additions: https://cran.r-project.org/web/
views/Hydrology.html.
Package Description
airGR Suite of GR hydrological models for precipitation-runoff modelling (Coron et al., 2017, 2018)
brook90 Implementation of the BROOK90 hydrologic model
(Federer, 1995; Schmidt-Walter, 2018; Kronenberg and Oehlschlägel, 2019)
dynatopmodel Implementation of the dynamic TOPMODEL hydrological model (Metcalfe et al., 2015, 2018)
Ecohydmod Ecohydrological modelling (Souza, 2017)
fuse Ensemble hydrological modelling (Vitolo et al., 2016b)
hydromad Hydrological model assessment and development (Andrews et al., 2011; Andrews and Guillaume, 2018)
RHMS Hydrologic modelling system for R users (Arabzadeh and Araghinejad, 2018)
topmodel Implementation of the hydrological model TOPMODEL in R (Buytaert, 2018)
TUWmodel Lumped/Semi-distributed hydrological model for education purposes (Viglione and Parajka, 2019)
lows the user to develop an impressive range of predictive 3.7 Packages for static and dynamic hydrological data
models (e.g. neural networks, deep learning, and decision visualization
trees).
There are many packages available for common hydro- Data visualizations play an important role in hydrological
logical tasks. A comprehensive set of functions for carry- analysis: R makes them straightforward to implement and
ing out extreme value analysis (Coles, 2001) can be found allows considerable flexibility. R includes three main fami-
in the extRemes package (Gilleland and Katz, 2016), and lies of graphics packages: a painter model, natively present
a more complete overview can be found in the CRAN Ex- in R and based on the S language’s GR-Z model (Becker and
treme Value Analysis Task View. nsRFA consists of a col- Chambers, 1977), the trellis graphs (e.g. the lattice pack-
lection of statistical tools for objective (unsupervised) appli- age; Sarkar, 2008) initially implemented in S, and The Gram-
cations of the regional frequency analysis methods in hydrol- mar of Graphics (Wilkinson, 1999). The last two families
ogy (Viglione, 2018). L-moments can be implemented using are both based on the grid package (R Core Team, 2018),
the lmom Hosking (2019b) package, while the lmomRFA a low-level abstraction layer that allows the development of
package (Hosking, 2019a) enables regional frequency anal- graphical packages with different philosophies, which means
ysis. The lfstat (Koffler et al., 2016) package provides that the created graphics can be stored in objects to be up-
functions to compute statistics and plots for low flows sim- dated and plotted again later.
ilar to those in the manual on low-flow estimation and pre- base-R can produce publication-quality figures; it includes
diction (WMO, 2009). Many of the standard model evalu- a series of functions and methods that allow the user to
ation metrics are provided directly within these packages. plot various types of visualizations and the output of sta-
The caret package, for instance, imports other packages, tistical models. Visualizations are produced in base-R us-
such as ModelMetrics (Hunt, 2018), to facilitate model ing the graphics package (R Core Team, 2018), which
evaluation directly. A range of packages have also been de- relies on the philosophy of superimposing elements of the
veloped specifically for model evaluation. The hydroGOF graphics (with no provision for deleting an element once it
package (Zambrano-Bigiarini, 2017a) provides goodness-of- is drawn) and includes a range of functions to add straight
fit functions specifically for comparison of simulated and ob- lines, arrows, axes, boxes, grids, legends, or annotation to
served hydrological time series. In Table 3 we present a brief a plot. While visualizations produced in base-R are highly
overview of some other packages for hydrological statistics. customizable, other packages provide more consistent in-
For a broader overview of available packages and further ex- teractions and a suite of highly useful functions to sum-
amples, we point the reader to the CRAN Task View on ma- marize, highlight, and split and/or layer data with a min-
chine learning and statistical learning (https://cran.r-project. imal amount of code. A community favourite is the pack-
org/web/views/MachineLearning.html). age ggplot2, created by Wickham (2016b), which allows
a high level of flexibility and “tuning” of the graphs de-
pending on the users’ needs. ggplot2 is an implemen-
tation of The Grammar of Graphics and allows users to
build almost any type of graphic (see the R graph gallery at
Hydrol. Earth Syst. Sci., 23, 2939–2963, 2019 www.hydrol-earth-syst-sci.net/23/2939/2019/L. J. Slater et al.: R in Hydrology 2951
Table 3. Examples of packages for hydrological statistics.
Package Description
berryFunctions Function collection related to plotting and hydrology (Boessenkool, 2018)
hydroGOF Goodness-of-fit functions for comparison of simulated and observed hydrological time series
(Zambrano-Bigiarini, 2017a)
hydrolinks Hydrologic network linking data and tools (Winslow et al., 2018)
hydrostats Hydrologic indices for daily time-series data (Bond, 2018)
hydroTSM Time-series management, analysis and interpolation for hydrological modelling (Zambrano-Bigiarini, 2017b)
lfstat Calculation of Low Flow Statistics for daily stream flow data (Koffler et al., 2016)
https://www.r-graph-gallery.com). ggplot2 also contains Choosing the appropriate colour gradients for hydrolog-
functions like “facets” (https://plot.ly/ggplot2/facet), which ical graphs and maps is key. It is widely accepted now
allow the user to split and plot the data by categories in many that certain colour schemes, and notably the infamous rain-
different rows or columns. Figure 4 provides a hydrologi- bow colour scale, are poor choices for data visualization
cal example of faceting where a statistical model is visu- (Light and Bartlein, 2004; Stauffer et al., 2015). The rain-
alized for different seasons (rows) and different peak-over- bow scheme has been shown to distort perceptions of data
threshold quantities (columns). and alter meaning by creating false boundaries between val-
Dynamic charts – where the user can, for instance, hover ues; additionally it is not colourblind-safe, and other alterna-
over one or multiple points to read the associated data or tives like perceptually uniform colour maps have been sug-
metadata (e.g. a hydrometric station number or the value gested (Crameri, 2018). The R language is strong in the
of a point) – have also grown in popularity in hydrological area of colour gradients, and there are many colourblind-
analyses in recent years. These dynamic graphics are par- friendly palettes available for hydrology that follow effective
ticularly useful in inspecting data, such as outliers, or ex- data visualization guidelines (Kelleher and Wagener, 2011).
plaining an analysis when teaching hydrology in the class- There are both manually defined and predefined palettes us-
room (e.g. by zooming in on different parts of a time se- ing packages such as RColourBrewer (Neuwirth, 2014),
ries). Dynamic graphics including maps can be created by colorspace (Zeileis et al., 2019), colorRamps (Keitt,
using the plotly package (Sievert, 2018), a graphic li- 2012), or viridis (Garnier, 2018). For example, the
brary that allows the user to make graphs interactive with colorspace package can be used for colour palettes based
minimal extra code. A number of JavaScript-based visual- on hue chroma luminance (HCL colour palettes are based on
ization libraries can also help achieve dynamic graphics. how humans perceive colour, in contrast to the RGB colour
For interactive time-series data requiring axis display fea- space, which is based on technical demands of TV/computer
tures such as zooming and panning and highlighting of se- screens) in meteorological visualizations (Stauffer et al.,
ries and points, the dygraphs package (Vanderkam et al., 2015).
2018) provides an interface to the JavaScript charting li-
brary. The manipulate package (Allaire, 2014) allows the 3.8 Packages for creating presentations and documents
user to easily add sliders and other control tools to other-
wise static plots. Other JavaScript-based packages include A vast array of packages have been developed in R for creat-
rbokeh (Hafen and Continuum Analytics, Inc., 2016), ing dynamic presentations and documents, which are partic-
which provides an interface to Bokeh, allowing the user to ularly useful for illustrating hydrological concepts. Dynamic
create web-based plots with hover and dynamic functional- interfaces and web-based applications can be created with
ities. rAmCharts (Thieurmel et al., 2018) creates interac- shiny (Chang et al., 2015), such as the airGRteaching
tive charts based on the amCharts JavaScript library, while (Delaigue et al., 2018a, b) interface (Fig. 6; see Sect. 5.5). R
the highcharter (Kunst, 2017) package is based on the can also be used to generate animated GIF files for presen-
Highcharts JavaScript library of graphics. Examples of all tations, for example to highlight temporal changes in land
of these implementations (including leaflet, dygraphs, cover or reservoir levels from earth observation. GIFs can be
plotly, rbokeh, highchart, and other visualization li- created using, for example, gganimate (Pedersen, 2018)
braries) can be found at https://www.htmlwidgets.org. We to animate ggplot2 and create videos and animated image
encourage the reader to explore these HTML widgets, as they files or caTools (Tuszynski, 2018) for reading and writing
show how simple it is to implement dynamic graphics with GIF and ENVI (flat-binary raster files with an accompanying
just a line or two of R code. ASCII header file) files.
www.hydrol-earth-syst-sci.net/23/2939/2019/ Hydrol. Earth Syst. Sci., 23, 2939–2963, 2019You can also read