MIND THE CHASM Beyond Social Services February 2021 - COVID-19 & Deepening Inequalities in Singapore - Beyond Social Services Research
←
→
Page content transcription
If your browser does not render page correctly, please read the page content below
Beyond Social Services
February 2021

MIND
THE
CHASM
COVID-19 & Deepening
Inequalities in Singapore

                            1
Copyright © Beyond Social Services
First published 2021

Report writing team:
Stephanie Chok, PhD (lead author)
Isaac Neo (data analysis and visualisation)
Suraendher Kumarr (research assistance)

Beyond Social Services started out as the Bukit Ho Swee Community Service Project more than 50 years
ago. It has grown and morphed significantly since and is currently a community development agency
dedicated to helping children and youths from less privileged backgrounds break away from the poverty
cycle. BSS adopts an asset-based community development approach to its work with low-income com-
munities, and seeks to provide support and resources that enable families and communities to care for
themselves and each other. The organization’s current reach extends to 64 rental housing blocks spread
out over 14 neighbourhoods, involving 3,029 families and a total of 11,710 persons.

Address: 26 Jalan Klinik, #01-42/52, Singapore 160026
Tel: +65-6375 2940
Website: www.beyond.org.sg

All rights reserved. Nevertheless, short excerpts may be reproduced without authorization, on condition
that the source is indicated. For rights of reproduction or translation, application should be made to Beyond
Social Services by email: mail@beyond.org.sg.

CONTENTS

Foreword                                                         5

Acknowledgements                                                 6

Abbreviations and Acronyms                                       7

List of Figures and Tables                                       8

Executive Summary                                                9

Chapter 1

COVID-19: A Pandemic Unfolds in Singapore                        12

  COVID-19 in Singapore: A Timeline                              12

  Impacts of COVID-19                                            15

Chapter 2

Beyond’s COVID-19 Study: Key Findings                            19

  Beyond’s COVID-19 Response                                     19

  Beyond’s COVID-19 Study: An Analysis of FAF Applicants’ Data   20

  Section I: Demographic Information                             21

  Section II: Employment                                         26

  Section III: Work Income                                       27

  Section IV: Housing Costs and Arrears                          29

Chapter 3

Qualitative Findings: Multiple Forms of Insecurity               32

  Section I: Non-Standard Forms of Employment                    32

  Section II: The Collision of Multiple Forms of Insecurity      35

Chapter 4

Conclusion & Recommendations                                     43

  COVID-19 and Inequality: A Deepening Income Gap                43

  Recommendations                                                44

  Concluding Remarks                                             47

                                                                      3
FOREWORD

    The coronavirus outbreak upended life as we knew it.      activity, the people who sought assistance from us did
    The dark shadow cast over Singapore was illuminat-        not.
    ed by demonstrations of compassion, social justice,
    and trust within our community. The government            Today, we have a vaccine, and there is optimism that
    led the way with an unprecedented introduction of         COVID-19 will soon be reined in. But the coronavi-
    four budgets, with $93 billion set aside for COVID-19     rus has also exposed the need for our society to be
    support measures. Fortitude, Solidarity, Resilience and   collectively inoculated against the upheaval of so-
    Unity were the names of these budgets, as our leaders     cio-economic stability and the ensuing hardship that
    rallied the country to come together for its common       threatens family stability, children’s educations, and
    good.                                                     livelihoods. Based on the reported experiences of
                                                              some 1200 financial assistance applicants during the
    To flatten the virus curve, everyone had to assume        period April to September 2020, this report provides
    responsibility for their personal safety, as caring for   a fuller picture of the stories in the media that
    oneself was caring for the community. However,            generated the empathy and support which enabled
    it quickly became clear that not everyone had the         those in need to receive essential funds and services.
    resources to do so, despite their best intentions.        These findings contribute to our understanding of the
    Hence, one of the first things Beyond did was to tell     economic and social environments within low-income
    our members to approach us if they needed financial       families during this pandemic. The information can be
    assistance to visit a doctor.                             a tad uncomfortable, because it suggests that despite
                                                              our compassion and generosity in responding to the
    Bolstered by the offers of help from volunteers,          plight of those hard hit by the pandemic, there is still a
    donors, and members of the public, we watched             lot more that needs to be done to protect the precari-
    the situation carefully. When the circuit breaker was     ous and ensure financial stability.
    announced, we reorganized ourselves to aid with food,
    finances, digital access, and employment. We were         This pandemic has shown us how our collective
    humbled and grateful that the Singapore community         wellbeing is closely linked with the wellbeing of others,
    stood with our initiative and trusted us as a conduit     both near and far. We hope that this report will help to
    for some $4 million to help families in these areas.      encourage efforts that demonstrate the compassion,
    Approximately, another $1 million dollars worth of        solidarity, and trust that arose during the worst of the
    cooked food, surgical masks, sanitizers, and services     crisis, efforts that will see us through the dark spectre
    (such as the diagnosis and refurbishing of pre-loved      of COVID-19, and enable us to rebuild a more socially
    computers) also flowed through us.                        and economically integrated and just Singapore.

    The plight of those who were badly hit by the
    pandemic was covered extensively in the media and         Gerard Ee
    it would be safe to say that the support was signifi-     Executive Director, Beyond Social Services
    cantly driven by empathy for the less fortunate among     February 2021
    us. As we administered the assistance and gained a
    deeper understanding of peoples’ circumstances, it
    became clear that while the more privileged had some
    immunity against the severe disruption of economic

4
ACKNOWLEDGEMENTS

Beyond Social Services’ COVID-19 Family Assistance        Thank you, Associate Professor Teo You Yenn (Head,
Fund (FAF) would not have been possible without the       Sociology, Nanyang Technological University), for
generousity of its donors. A deep thank you to the        reading through an early draft and sharing important
corporate donors, foundations, and members of the         feedback.
public who stepped up to give in a time of immense
need.                                                     Thank you, Ranganayaki T (Deputy Executive Director,
                                                          Beyond Social Services) and Gerard Ee (Executive
The FAF team at Beyond was expertly managed by            Director, Beyond Social Services), for believing in this
Beyond staff members, Maizy Tan and Lim Shaw Hui,         project and for setting aside the resources necessary
who took on the daunting task of leading the FAF          to see it though.
process. The FAF team consisted of over 30 staff,
interns, and volunteers who fielded almost 2,000          This report and its findings are significant, and they
calls and filled in as many forms: thank you, each        reflect the empirical realities of those who have shared
and every one of you, for what has been difficult and     their experiences with Beyond’s FAF team. Thank you,
heart-wrenching work in 2020. Those many conversa-        FAF applicants, for your trust, and for allowing us to
tions have culminated in this report, and I hope you      speak of your lived realities.
feel gratified and proud of your contributions.

Credit goes to Isaac Neo for the meticulous work
done in terms of data cleaning, data analysis, and data
visualization. This core work, which involved handling
a large body of data, was significant, laborious, and
required much attention to detail—thank you, Isaac.

A big thank you to Beyond’s Research and Communi-
cations teams for your support—Suraendher Kumarr,
Kaylin Toh, and Diana Rahim. Thank you very much
Amanina Binte Jaffar (Nina), for the quick work on the
COVID-19 timeline.

Vikki Khung agreed to help with design and layout at a
late stage and has done a wonderful job—thank you
Vikki.

This study benefitted tremendously from the expert
guidance of Dr Ng Kok Hoe, Senior Research Fellow
and Head of CSU at the Lee Kuan Yew School of Public
Policy, National University of Singapore. Thank you,
Dr Ng, for the immensely valuable feedback from
beginning to end, and for carefully editing an early
draft.

                                                                                                                     5
ABBREVIATIONS

    CBD		    Central Business District

    CPF		    Central Provident Fund

    FAF		    Family Assistance Fund

    F&B		    Food and Beverage

    HDB		    Housing and Development Board

    HBL		    Home-Based Learning

    HSA		    Health Sciences Authority

    ILO		    International Labour Organization

    IMF		    International Monetary Fund

    ITE		    Institute of Technical Education

    MC       Medical Certificate

    MOM		    Ministry of Manpower

    MSF		    Ministry of Social and Family Development

    NSFE		   Non-Standard Forms of Employment

    PCI		    Per Capita Income

    PMET		   Professionals, Managers, Executives & Technicians

    PWM		    Progressive Wage Model

    S&CC		   Service and Conservancy Charges

    SSO      Social Service Offices

    UK		     United Kingdom

    US		     United States

    WHO		    World Health Organization

6
LIST OF FIGURES AND TABLES

List of Figures

Figure 1     COVID-19 Timeline (Jan 2020 to Jan 2021)

Figure 2     Ages of FAF Applicants

Figure 3     Races of FAF applicants

Figure 4     Citizenship status of FAF applicants

Figure 5     Household sizes of FAF applicants

Figure 6     Educational qualifications of FAF applicants

Figure 7     Employment status of applicants

Figure 8     Drop in median household income from work

Figure 9     Drop in median per capita income from work

Figure 10    Percentage loss of work income by pre-COVID-19 income brackets

Figure 11    Monthly rent paid by FAF applicants living in public rental flats

Figure 12    Rent or mortgage as percentage of household income pre- and post-COVID-19

Figure 13    Percentage of families with arrears

Figure 14    Non-Standard Forms of Employment (adapted from ILO)

List of Figures

Table 1      Beyond Social Service’s COVID-19 Response Efforts (Feb–Sep 2020)

Table 2      Median gross monthly income from work by industry in 2019

Table 3      FAF households’ median household income compared to national median

                                                                                         7
EXECUTIVE SUMMARY

    2020 was a harrowing year for many families. It was                 work among applicants fell to S$500—a 69% drop;
    especially difficult for those already on the margins.          •   Pre-COVID-19, the median per capita income
    Not only did many households see their incomes                      (PCI)—calculated by taking total household
    vanish entirely or drastically reduce, everyday life                income from work and dividing it by the number
    was disrupted in unforeseen ways: during the circuit                of persons in the household—was S$425. Post-
    breaker, schools and childcare centres closed, digital              COVID-19, the median PCI fell to S$113, a 74%
    access became a necessity, grocery shopping was                     decline;
    unpredictable and stressful, and families were forced
                                                                    •   Post-COVID-19, 35% of FAF applicants saw their
    to spend most of their time at home, often in over-
                                                                        household incomes drop to S$0.
    crowded conditions. Staying safe comfortably, eating
    regularly and healthily, working from home (and
    getting paid): these are marks of privilege, and out of         The majority of FAF applicants (80%) lived in public
    reach for many lower-income families.                           rental housing. These applicants reported monthly
                                                                    rents that ranged from below $50 to $800. Rent as
    Beyond Social Services (Beyond) responded to the                a percentage of their household income more than
    COVID-19 crisis by reorganizing staff and volunteers            doubled pre- and post-COVID-19, from 7% to 19%,
    in response efforts. In March 2020, the organization            creating additional financial strain. Meanwhile, more
    launched its COVID-19 Family Assistance Fund (FAF)              than half of FAF applicants (54%) reported that their
    to support low-income families adversely impacted               households were already struggling with arrears.
    by the crisis. By end September 2020, Beyond had
    committed over S$3 million in financial assistance to           A significant majority (80%) of FAF applicants had
    more than 1,900 families. The data that was collected           secondary school level or below educational qualifica-
    during this process was also examined, so as to un-             tions; almost half had primary school level and below
    derstand the financial circumstances of the families            educational qualifications. This created additional
    and the economic impact of this crisis. The findings in         disadvantages for them in the labour market, and was
    this report are based on an analysis of Beyond’s FAF            reflected in the types of employment many of them
    applications done between April and September 2020.             were engaged in: low-paid and precarious forms of
    After data cleaning, the total sample size was 1231.            work, primarily in the service industry, including the gig
                                                                    economy.
    The key findings demonstrate the devastating financial
    impact this pandemic has had on low-income families.            While Beyond’s FAF focused on providing short-
    Drops in reported household incomes from work prior             term financial relief to applicants, it was clear from
    to COVID-19 (pre-COVID-19) and after the applicants’            continued interactions that the situation was not
    incomes were affected by the COVID-19 crisis (post-             improving even after the circuit breaker was lifted.
    COVID-19) are stark:                                            Additionally, many households were experiencing
                                                                    multiple forms of insecurity. Not only were applicants
    •   Pre-COVID-19, the median household income                   and their family members dealing with labour insecu-
        from work among applicants was S$1,600.* Post-              rity, the pandemic was causing strain in other facets of
        COVID-19, the median household income from                  everyday life. Applicants grappled with food insecurity,

    * All amounts are in Singapore dollars (SGD) unless otherwise
    indicated.

8
housing insecurity, health insecurity and, for transna-
                                                          Due to COVID-19, median
tional families, uncertainty over family members’ legal
and employment statuses. The COVID-19 crisis exac-        household income from work
erbated work-care gaps and also worsened household        among FAF applicants fell by 69%
indebtedness.
                                                          to $500. Meanwhile, per capita
This report concludes with some recommendations,          income from work fell 74% to $113.
the first of which relates to strengthening employ-
ment rights and social protections. The pandemic has      (HDB) announced a 50% rent rebate for three months
made clear how much our society—and economy—              for persons residing in public rental flats in October
relies on the industry and labour of essential workers    2020.1 However, in light of the steep income drops, the
(such as supermarket cashiers, garbage collec-            protracted nature of this crisis, and the varying rental
tors, cleaners, delivery riders, as well as healthcare    rates paid by public rental flat residents, it is suggested
workers). Essential work, however, is not just under-     that rental fee waivers be extended and reduced
appreciated, it is often poorly paid and, now, much       more substantially, to reflect the significant declines
more perilous: as the privileged retreat into safety      in income.
when infections peak, essential workers occupy the
frontlines, often without adequate social and labour      The final recommendation relates to debt relief.
protections. Measures to create jobs need to take         Household indebtedness, already a cause for concern
heed that employment can only be a means to lift          among FAF applicants, looks likely to worsen in the
people out of poverty if decent work—which includes       coming year. Debt relief programmes should be con-
adequate earnings, job security, fair treatment, and      sidered, as well as greater scrutiny of predatory credit
safe working conditions—is ensured. Ongoing debates       schemes that may potentially create debt spirals.
on establishing a minimum wage need to be engaged
with seriously, as well as growing concerns over the      While Beyond’s FAF was conceived as a temporary
deterioration in pay and working conditions for gig       measure, post-circuit breaker, it is evident that the
economy workers.                                          economic circumstances of many households remain
                                                          fraught and unstable. If this unprecedented crisis is
The second recommendation recognizes the financial        presenting us with opportunities to emerge stronger,
strain rent is placing on low-income households and       this strengthened society needs to be built fairer,
the stress that is invoked when arrears accumulate.       embed universally recognized labour rights and princi-
It is noted that the Housing and Development Board        ples, and enable all to thrive.
                                                                                                                        9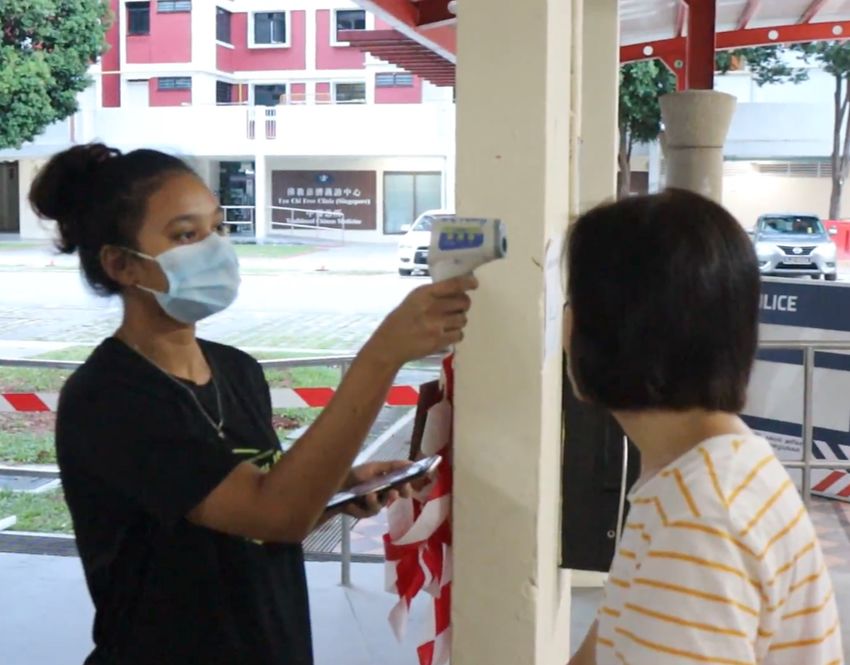
CHAPTER
ONE

    COVID-19: A PANDEMIC
   UNFOLDS IN SINGAPORE
CHAPTER 1 COVID-19: A Pandemic Unfolds in Singapore
The year 2020 has indubitably been defined and 2020, the Singapore government sought to quickly
altered by the COVID-19 crisis. While initially compared contain the situation: on 22 March 2020, short-term
to the common flu, cavalier attitudes toward the pass holders were barred from entering or transiting
coronavirus were swiftly corrected by the virus’s brisk
in Singapore. Shortly after, on 26 March 2020, the
spread and the severity of its impacts. Declared a
COVID-19 Temporary Measures were implemented.12
pandemic by the World Health Organization (WHO)
In summary:
in March 2020, the coronavirus has since spread to
at least 218 countries,2 infected more than 96 million
• Gatherings outside school and work were limited
persons, and claimed an alarming two million lives
to a maximum of 10 people;
globally by January 2021.3 In Singapore, the first cluster
• All entertainment venues—cinemas, nightclubs,
and community infection was detected in February
karaoke outlets, theatres—had to close;
2020. By mid-April 2020, despite the country’s
• Centre-based tuition and enrichment centres had
stringent measures, the number of COVID-19 infec-
to suspend operations;
tions had exceeded 5,000.4 As of 21 January 2021,
• Religious services and congregations were also
there were 59,235 confirmed COVID-19 infections in
suspended.
Singapore, and 29 recorded fatalities.5
March 2020 was also the month when Malaysia
COVID-19 in Singapore: A Timeline imposed a lockdown on travel, causing massive disrup-
In Singapore, a series of hitherto unprecedented tion to the lives of those who commuted daily between
measures took place at what seemed like an unrelent- Singapore and Malaysia for work or study.13
ing pace as the outbreak worsened (Figure 1). On 7
February 2020, days after Singapore’s first community In quick succession, the Singapore government
announced two more budgets, the Resilience Budget,14
infection, the Singapore government raised the
which included the COVID-19 Support Grant,15 and
country’s alert level to Dorscon Orange,6 spurring a
the Solidarity Budget.16 As the number of COVID-19
wave of panic buying in the supermarkets.7 Work-
infections continued to rise, the government decided
places were urged to allow staff to work from
home and implement split team arrangements;
temperature screenings were required at
events.8 Doctors were advised to give patients
with respiratory symptoms five days of medical
leave, during which patients were asked to stay
at home.9 Later that same month, the gov-
ernment rolled out its first COVID-19-related
budget, the Unity Budget,10 which included a
series of measures to assist those affected by
the COVID-19 situation, including its Care and
Support package and Jobs Support Scheme.11
After two persons died from COVID-19 in March
11CHAPTER 1 COVID-19: A Pandemic Unfolds in Singapore
COVID-19 IN SINGAPORE: A TIMELINE (Jan 2020 - Jan 2021)
January 2020 23 Jan: 1st confirmed case of COVID-19
4 Feb: 1st COVID-19 cluster detected February
7 Feb: Country alert level raised to Dorscon Orange
18 Feb: Government announces Unity Budget
March 11 Mar: WHO declares coronavirus outbreak a
pandemic
18 Mar: Malaysia imposes lockdown on travel
21 Mar: First two fatalities from COVID-19
22 Mar: Short-term pass holders barred from
entering/transiting in SG
26 Mar:
• COVID-19 temporary measures implemented
• Government announces Resilience Budget
6 Apr: Government announces Solidarity Budget April
7 Apr: Circuit breaker begins: most workplaces
closed, dining in at eateries not allowed
8 Apr: Schools closed till 4 May
14 Apr: Mask-wearing outside the home made
mandatory
17 Apr: COVID-19 infections exceed 5,000
20 Apr: Peak of migrant worker infections in dorms
21 Apr: Circuit breaker extended till 1 June
May 26 May: Government announces Fortitude Budget
1 Jun: Circuit breaker lifts: Phase 1 of reopening June
2 Jun: Schools reopen
19 Jun: Phase 2 of reopening
July 26 July: COVID-19 cases in SG exceed 50,000
29 Sep: Global COVID-19 deaths exceed 1 million September
December 24 Dec: First case of new coronavirus strain (B117)
confirmed in SG
28 Dec: Phase 3 of reopening
21 Jan: January 2021
• Total COVID-19 infections in SG: 59,235
• Total COVID-19 fatalities in SG: 29
12 Figure 1: COVID-19 Timeline (Jan 20 to Jan 21)CHAPTER 1 COVID-19: A Pandemic Unfolds in Singapore
to implement a circuit breaker on 7 April 2020 for a breaker was officially lifted. This involved a gradual
month, in which most workplaces were closed, and reopening of workplaces and services that were
dining in at eateries was no longer allowed. Social deemed more essential (such as barbers), as well as
gatherings with family or friends who did not live in the schools. Phase 2 of the reopening began on 19 June
same household were banned.17 Retail outlets, other 2020, in which dining in at eateries was allowed, but
than those providing essential services (for example with restrictions on the number of diners per group,
supermarkets and pharmacies), also had to close. and with safe distancing measures in place. The
School closures followed: home-based learning (HBL) number of visitors allowed to visit a household was
was implemented for a month between April and May. also increased to five persons. Home-based businesses
Pre-schools, kindergartens, and student care centres were able to resume operations.25
were also closed.18 Wearing a face mask outside the
home became mandatory in April.19 As 2020 drew to a close, Singapore moved into Phase
3, which began on 28 December.26 This allowed for up
to eight persons at social gatherings and household
By 17 April 2020, Singapore’s COVID-19 infections had
visits, and the increase of capacity limits for religious
exceeded 5,000. As the number of migrant worker
services, weddings, and indoor live performances,
infections escalated,20 the government extended the
among others. The Health Sciences Authority (HSA)
circuit breaker for yet another month, till June 2020.21
approved the COVID-19 vaccine developed by Pfiz-
These extended circuit breaker measures, imple-
er-BioNTech on 14 December 2020,27 and on 30
mented on 21 April 2020, involved more businesses
December 2020, Singapore began vaccinating health-
closing—such as barbers and bubble tea shops—and
care workers.28
the imposition of entry restrictions on popular places,
like wet markets.22 These additional restrictions also
Meanwhile, a new strain of the coronavirus (B117) led
affected home-based businesses that provided food
to a record-high number of COVID-19 cases in the
and beverages, who were not allowed to operate.23
United Kingdom (UK) in December 2020; this variant
In May 2020, the government unveiled its Fortitude
is deemed to be more transmissible.29 The first case in
Budget,24 which included enhancements to the Jobs
Singapore of a patient infected with this coronavirus
Support Scheme and extended various fee waivers.
variant was confirmed on 24 December 2020.30 As of
The reopening process was done in phases. Phase 1,
21 January 2021, almost a year since the first COVID-19
which started on 2 June 2020, was when the circuit
case in Singapore, there were 59,235 reported
COVID-19 cases. Government officials also gave indi-
cations that as community cases continued to rise in
Singapore, there could be further restrictions imposed
ahead of Chinese New Year in February 2020.31
Impacts of COVID-19
Global & Regional Economic Impacts
The global economic impact of the coronavirus has
been dramatic and crippling.
• In June 2020, the World Bank forecast a 5.2% con-
traction in global GDP in 2020, what it termed ‘the
13CHAPTER 1 COVID-19: A Pandemic Unfolds in Singapore
deepest global recession in decades’;32 and increases in the working poverty rate.41 The World
Bank foresees a ‘growing class of “new COVID poor”’ in
• The International Monetary Fund, meanwhile,
the East Asia and Pacific region, with up to 38 million
estimated losses to the global economy of around
expected to remain or fall back into poverty by the end
US$12 trillion, with poorest countries the hardest
of 2020.42 The pandemic, observed the World Bank,
hit;33
unleashed a ‘triple shock’ on these economies: ‘the
• Real GDP growth in the United States (US) fell
impact of the pandemic itself, the economic impact of
by 31.4% during the second quarter of 2020,
containment measures and the regional impacts of the
‘numbers not seen since the Great Depres-
broader global recession’; economies dependent on
sion’; there were 6.8 million more unemployed
tourism and exports will be especially hard hit.43
workers in October 2020 than there were in
February 2020.34 The COVID-19 recession has
Socio-Economic Impacts: Singapore
been termed ‘the most unequal recession’ in the
In Singapore, unemployment rates reached a 16-year
country’s modern history: at its height, ‘low-wage
high in 2020,44 and retrenchments, as of the third
jobs were lost at about eight times the rate of
quarter of 2020, had doubled from the previous
high-wage ones’.35 Recovery has also been uneven:
year—over 20,000 workers were retrenched in the first
by September 2020, it was assessed that the
three quarters of 2020.45 The total number of people
downturn was largely over for the wealthier (in
employed in Singapore ‘dropped off a cliff’ during the
white-collar jobs, and who could work from home),
circuit breaker (April to June 2020): in that quarter, em-
while employment figures for low-wage workers
ployment fell by a record 103,800.46 Between March
remained low. The hardest hit groups were con-
and September 2020, around 250,000 employees had
centrated in the service sector—hotels, restau-
their wages cut.47 Between June and November 2020,
rants and other hospitality jobs—with women (es-
40,000 persons applied for the Ministry of Social and
pecially those with elementary school-age children)
Family Development’s (MSF) ComCare assistance—
and racially marginalized populations encounter-
social assistance for low-income families48—a 25%
ing the largest barriers to returning to work;36
increase from the same period last year.49
• In the UK, it was estimated that the pandemic has
plunged almost 700,000 persons into poverty, The Singapore economy shrank by 5.8% in 2020.50 The
with the hardest hit being young workers, those impacts of this recession were ‘highly uneven’, with
in low-paid jobs, and persons working in sectors some sectors flourishing, while others, notably the
like hospitality and retail;37 of this population, labour-intensive service sector, bore the brunt.51 The
about 270,000 had slipped more than 50% below circuit breaker measures brought many businesses to
the UK poverty line (what has been termed ‘deep a standstill, with those in the travel, events, as well as
poverty’).38 food and beverage industry ‘financially pummelled’ by
the mandatory closures.52 A number of eateries didn’t
Southeast Asia is said to have suffered fewer casualties survive Phase 1 of the circuit breaker, and closed
from the pandemic: with around 9% of the global pop- permanently.53 According to the Restaurant Associa-
ulation, it has only registered 2% of total cases, and 1% tion of Singapore, in July 2020, about 70% of eateries
of fatalities.39 Economically, however, the predictions in the Central Business District (CBD) were reporting
are grim: the International Labour Organization (ILO) sales of less than 50% compared to pre-COVID days;
estimates a ‘jobs gap’ of 81 million across the Asia-Pa- outside of the CBD and city areas, around 40% of food
cific in 2020,40 with significant drops in work income and beverage operators reported sales of between
14CHAPTER 1 COVID-19: A Pandemic Unfolds in Singapore
50%–70% compared to pre-COVID-19 levels.54 Retail leave. Families struggling financially were negatively
outlets have also suffered tremendously,55 with affected by bouts of panic buying and fluctuations
shuttered storefronts an indication that many have not in food pricing; by directives to work or study from
survived the extended circuit breaker measures and home and to be digitally-ready to cope with these new
shifts in consumer patterns.56 technological demands;60 by disruptions to work-care
arrangements as childcare and student care centres
In Singapore, the unemployment closed.
In a DBS report, Same Storm, Different Boat: Impact
rate reached a 16-year high in 2020 of COVID-19 on Financial Wellness in Singapore, it was
and retrenchments doubled from predicted that Singapore’s GDP would sink to -6.5%,
‘making it the worst recession since Independence’.61
the previous year. After examining the bank’s database of 1.2 million
‘non-wealth’ customers,62 these were some of the
The unemployment rate was predicted to ‘stay report’s key findings:
elevated’ in 2021, with ‘wage growth low’;57 any
recovery in employment will be ‘uneven and slow’.58 • The percentage of customers who experienced a
News reports have noted how low-wage workers have significant decline in income—defined as income
been especially hard hit: circuit breaker restrictions declines of more than 10%—increased from 15%
affected blue-collar workers disproportionately,59 as in March 2020 to 26% in May 2020;63
many were not able to work from home, and were
• Among this affected group who experienced signif-
more vulnerable to being laid-off or placed on unpaid
icant income declines:
15CHAPTER 1 COVID-19: A Pandemic Unfolds in Singapore
oo 43% experienced an income drop of between cially economically vulnerable in times of crisis.
11% and 30%;
oo 57% experienced an income drop of more The COVID-19 crisis has exposed and deepened
than 30%; existing inequalities in many countries. In Singapore,
the financial impact has been devastating, particularly
• About a third of this group saw their
for communities already on the margins. The impacts
incomes decline in excess of 50%; this
cited in the previous section and in news reports
includes customers who lost their income
detailing how the pandemic has affected the poor71
entirely during this period;64
align with what Beyond was encountering among its
• The impacts were disproportionately felt by the members living in public rental housing. The following
lower-income: 49% of lower-income earners— chapter briefly outlines Beyond’s COVID-19 response,
defined as those earning $2,999 and below—ex- before delving into the findings of Beyond’s own study
perienced drops in salary. Among this group, 51% on the impact of COVID-19 on low-income households.
experienced salary declines of more than 50%; 65
meanwhile, the impact on higher-income groups
was ‘considerably modest’;66
If vulnerability is understood as
• The highest share of affected workers were those
increased exposure to shocks,
aged between 35-44 years old: 56% of customers stress, and risk, and ‘a lack of
in this age group saw their incomes plunge by 30%
means to cope without damaging
or more;67
loss’, then low-income families are
• In terms of sectors, customers working in the
food and beverage (F&B), hospitality, and aviation especially economically vulnerable
sectors were the worst hit in terms of income in times of crisis.
deterioration;68
• In May 2020, 64% of
customers who experienced
significant declines in income
had less than three months
of emergency funds; 42%
had less than a month of
emergency funds available.69
This lack of emergency funds
means families on already tight
budgets have little financial buffer
to cushion income loss. If vulner-
ability is understood as increased
exposure to shocks, stress, and
risk, and ‘a lack of means to cope
without damaging loss’,70 it is clear
that low-income families are espe-
16CHAPTER
TWO
BEYOND’S COVID-19 STUDY:
KEY FINDINGSCHAPTER 2 BEYOND’S COVID-19 STUDY: KEY FINDINGS
Beyond’s COVID-19 Response leave or had their pay cut; others suffered income loss
In February 2020, as the coronavirus situation from a lack of demand for their services (for example
continued to worsen, staff and volunteers at Beyond Grab drivers).72 Parents, primarily women, were also
started making phone calls to members—i.e. residents grappling with school closures and the disruptions to
in rental flats that Beyond does outreach work with— work-care arrangements, as well as the abrupt need to
to find out if and how they have been impacted by be digitally-ready for home-based learning (HBL).
the COVID-19 crisis. It soon became clear that many
members were negatively impacted by the pandemic, Beyond reorganised its work to meet the immediate
primarily in terms of employment and reductions in needs of its members as the crisis deepened. Broadly,
household income. Members were disproportionately staff were assigned to four key teams in the following
engaged in low-paid and insecure work in the service areas: food, finance, digital access, and employment.
and retail sectors, or the gig economy, and experi- Table 1 provides a summary of Beyond’s recovery
enced retrenchment or reductions in working hours. efforts between February 2020 and September 2020:
As businesses closed, some were asked to take unpaid
18 18TABLE 1: Beyond’s COVID-19 Response Efforts
(Feb - Sep 2020)
Food • 88,497 cooked meals distributed
• 3,975 food ration packs distributed
• $453,450 worth of supermarket vouchers distributed to 1,253 families
Finance • $3,159,470 committed to 1,937 families (COVID-19 Family Assistance Fund)
Digital Access • 584 devices distributed with Wi-Fi connections
• 1 void deck with Wi-Fi connection serving 300 households
• 70 volunteers matched with 70 students for online tutoring
• Ongoing support for NeuPC applications
Employment • 345 persons were provided with emotional and practical assistance
• 44 income-generation projects benefiting 14 persons
• Online training benefiting 5 home-based micro business owners
• 1 youth-driven initiative to build employment competency for youth
The money dispensed (see ‘Finance’, Table 1) was Beyond’s COVID-19 Study: An
done via Beyond’s COVID-19 Family Assistance Fund Analysis of FAF Applicants’ Data
(FAF), set up to provide temporary financial relief to Methodology
families affected by the crisis. As of September 2020, When the circuit breaker was announced on 7 April
more than S$3 million had been committed to 1,937 2020, many operations had to shift online, including
families, spread across 724 residential blocks across Beyond’s application process for temporary financial
Singapore. Households affected by the pandemic assistance (under the COVID-19 FAF scheme). Persons
generally received between $300 to $500 a month for applying for financial assistance spoke to Beyond staff
up to six months; in certain cases, for example where and volunteers from the FAF team, who subsequent-
there were larger families, families received between ly filled in online application forms. Data collected
$600 to $800 a month for up to six months. The key included demographic data, employment data, as
governing principles for Beyond’s FAF team were ‘high well as information on household incomes pre- and
trust, low barriers, and good enough governance’: 73
post-COVID-19, rental or mortgage payments, and
it was important that the process, while administra- arrears, among others. This presented an opportunity
tively accountable, was not overly onerous, and that for Beyond to analyse the information and come to a
families in distress were listened to with empathy, not better understanding of applicants’ economic situation
suspicion. While the FAF was initially set up to support and the impact of the crisis. Informed consent was
Beyond’s members, who lived in public rental flats, as sought from applicants; those who did not wish for
the crisis worsened, the fund also included families their information to be part of this analysis continued
from different housing types situated outside of the to receive financial assistance but had their details
neighbourhoods Beyond usually worked in. removed from the data set.
19 19CHAPTER 2 BEYOND’S COVID-19 STUDY: KEY FINDINGS
While Beyond’s COVID-19 FAF was launched in March programme. The situation has been relatively dynamic,
2020, the key findings presented in this chapter with four new budgets rolled out in a space of four
involve an analysis of Beyond’s FAF applications months.74 Many applicants were confused by the
done between April and September 2020. After different schemes announced and could not name
data cleaning, the total sample size was 1,231. Data them accurately, particularly in the earlier months.
cleaning involved detecting and correcting errors, Some were clearer about the different schemes
standardizing language and units of measurement, available, but were in transition: waiting for the
as well as removing applicants who did not wish for circuit breaker to be lifted; waiting for confirmation
their details to be used for research. The findings are on whether or not their application was successful;
presented in four sections: the first section details waiting for news on whether their assistance would be
demographic information, the second section relates renewed (this was before the government announced
to employment, the third section presents findings that ComCare would be automatically renewed for
on work incomes, and the fourth section discusses recipients);75 waiting for offices and shops to open
housing costs and arrears. so they could collect, verify, and make copies of
the required documents. Some applicants received
While FAF applicants were asked if they received assistance not in cash but through rent waivers or
or applied for social assistance, it was difficult to fee subsidies. The household income data presented
determine, with adequate precision, how much they therefore, refers to income from work, and does not
did or did not receive and under which scheme or include government transfers.
Ages of FAF AppLICants
200 199
182
180
167
162
160
140 136
126
120
100 99
80
60 56 54
40
26
20
8 10
1
0
18-19 20-24 25-29 30-34 35-39 40-44 45-49 50-54 55-59 60-64 65-69 70-79 80+
20 Figure 2: Ages of FAF Applicantsrace of faf AppLICants
Arab
Boyanese
Burmese
Chinese
Eurasian
Filipino
Indian
Indonesian
56.4%
Japanese (self identifies as Malay)
Malay
Javanese
Javanese Indonesian
Kyrgyzstani
Malay
Malay-Indian
Pakistani
Pathan
Portuguese
Sikh
Thai
Vietnamese
23.4%
Chinese
9.8%
Indian
Figure 3: Races of FAF applicants
Section I: Demographic Information services, cleaning and landscaping, and land transport
Age, gender, and race and supporting services (such as taxi drivers), sectors
While most of the applicants were clustered in the which also reported the lowest wages.76
30s–50s age range, there were 91 applicants aged 60
and above (Figure 2). There was even an 81 year old Most of the applicants Beyond spoke to were female
applicant who was still working, doing ad hoc cleaning (63%), and slightly more than half (56%) were Malay
work. Several applicants in their ‘70s were also (Figure 3). There were a range of other races, as trans-
working, and engaged in low-paid work in the service national families also received financial assistance.
sector (for example cleaning, tending to hawker
stalls). This aligns with the Ministry of Manpower’s
(MOM) 2019 labour force report, in which it was noted
that there was an above-average incidence of older
workers aged 55 and above in sectors such as F&B
21CHAPTER 2 BEYOND’S COVID-19 STUDY: KEY FINDINGS
Citizenship status educational subsidies); who struggled to find or keep
While most applicants were Singaporeans, at least 10% employment due to their temporary pass (some could
of applicants were foreigners married to Singaporeans not work because they did not have consent from the
and holding permanent residency status, long-term authorities, such as those on social visit passes).77
visit passes, or social visit passes (Figure 4). Figure
4 only captures the citizenship status of the family Household size
member who called for assistance: applicants may Most of the families that applied for FAF (77%) were
have been Singaporean, but others in their household households with children aged 18 years and below,
may not have been. In fact, there were more transna- which reflects the key demographic Beyond usually
tional families than statistically represented. engages with (Figure 5). Almost 40% were households
with five or more persons (the median household size
That households bore differential impacts from the in Singapore is three).78 Even in households with one
crisis was evident when it came to transnational person, these persons were often supporting depen-
families. There were transnational families who were dents not living with them—for example non-Singapor-
separated by travel restrictions and immigration reg- ean spouses and children separated because of travel
ulations; who shouldered large healthcare or school restrictions and immigration regulations; divorcees
fee debts due to the foreigner status of spouses paying child support; or adult children supporting
or children (who were not eligible for healthcare or elderly parents or other relatives.
figure 4: CITIZENSHIP STATUS OF FAF APPLICANTS
1200
1,107
1100
1000
900
800
700
600
500
400
300
200
100 48 57
12 1 5
0
LTVP Holder LTVP+ Holder Malaysian Permanent Singaporean Social Visit
Resident Citizen Pass Holder
22 Figure 4: Citizenship status of FAF applicantsHOUSEHOLD SIZES of faf AppLICants
300
281
263
250
228
200
165
150
125
100
57
50 44 41
13 9 4 1
0
1 2 3 4 5 6 7 8 9 10 11 12
Figure 5: Household sizes of FAF applicants
Educational qualifications versity degrees, nine were unemployed and looking
Almost half of FAF applicants (41%) had primary school for work at the time of applying for assistance. The
level and below educational qualifications (Figure 6). majority of FAF applicants are clustered in low-wage
Almost 40% had secondary school level educational sectors and are competing in a labour market where,
qualifications. Among those who had diplomas or according to MOM statistics, up to 58% of the resident
certificates, 72% were in the Institute for Technical labour force are tertiary-educated (where tertiary-ed-
Education (ITE). Among the 11 applicants with uni- ucated refers to those with a diploma, professional
certification, or degree).79
EDUCATIONAL qualifications of faf AppLICants
550
507
500 487
450
400
350
300
250
200
150
108
100
50 7 35
11
0
Primary & Secondary (‘O’ ‘A’ Levels Diploma/ University Others
Below Level or ‘N’ Level) Cert Degree
23 Figure 6: Educational qualifications of FAF applicants 23CHAPTER 2 BEYOND’S COVID-19 STUDY: KEY FINDINGS
Section II: Employment Occupations
The employment status of applicants only captures The majority of FAF applicants are engaged in low-paid
the employment status of the family member who and precarious forms of work, primarily in the service
called for assistance: there could have been others industry. Common sectors and occupations of FAF
in the household employed (Figure 7). Among those applicants—and their family members—include:
who were not employed and not looking for work,
• Service sector: for example, cleaners, F&B or
the reasons were predominantly related to care
hospitality workers (such as cook, wait staff, room
responsibilities, then health-related issues. For some, attendant, food stall assistant), retail (such as
this was temporary—with schools, student care, and cashiers, sales assistants);
childcare centres closed at some point during the • Gig economy: for example, delivery riders, Grab or
Gojek drivers, parcel deliverers;
circuit breaker, some women had to take unpaid leave
• Blue-collar work: for example, security guards,
or else put off trying to find employment because they
transport workers (bus or lorry drivers), pest
had to look after their children. Other women who control, movers, technicians, warehouse logistics;
cited childcare responsibilities as a reason they are • Home-based work: for example, baking, catering,
not looking for work often had younger children. With sewing, babysitting;
health-related reasons, some applicants were unable • Ad hoc work (‘odd jobs’): for example, labourers,
to work due to physical and mental health ailments, or painters, packers, dishwashers, cleaners;
were looking after family members with serious health • Administrative work;
conditions that required constant care (see case • Self-employed: for example hawkers, canteen stall
operators.
studies in Chapter 3).
employment status of faf AppLICants
700 672
600
500
400 356
300
203
200
100
0
Employed Unemployed & looking Unemployed & not
for work looking for work
24 Figure 7: Employment status of applicantsThe COVID-19 crisis resulted in significant income loss workers, who worked in jobs that required direct
for many FAF applicants, who either lost their jobs contact with consumers, for example, food stall
or had their take-home pay reduced, the latter due assistants, cashiers, or sales staff at retail stores. The
impacts were especially severe given not just the
to pay cuts, reduced demand and thereby revenue
nature of their work but the types of employment
(such as Grab drivers or hawkers), reduced work hours
relationships they were in: many were part-time, casual
and being asked to take unpaid leave (like many in
or contract employees; some were hired via third-par-
the service sector), and loss of overtime pay (which ties (‘agents’), who would call them when work was
affected security officers and other hourly-rated available (a number were daily-rated workers). In other
workers). Some were temporarily but directly affected words, many were already experiencing high levels of
by business and school closures, for example those job and income insecurity, and were in jobs with few
operating school canteen stalls, during which period paid benefits such as paid sick leave or paid childcare
leave, entitlements that became increasingly important
they had no revenue. When enhanced circuit breaker
during the pandemic. Despite this lack of paid sick
measures were imposed on home-based businesses
leave, those who still had to report to work (albeit less
in April 2020,80 FAF applicants who were home bakers
frequently) had to grapple with the anxiety of working
or home caterers also suffered income loss; some had in the midst of a pandemic health experts were still
to deal with the additional stress of having purchased trying to fully understand, but which was known to be
raw materials to produce their baked goods, which highly infectious.
they were subsequently unable to make and sell.
While work-from-home became the norm for many
PMETs (Professionals, Managers, Executives & Tech-
nicians), this was not possible for many essential
25CHAPTER 2 BEYOND’S COVID-19 STUDY: KEY FINDINGS
• Prior to COVID-19, the median PCI—calculated
The COVID-19 crisis resulted in by taking the total household income from work
significant income loss for many and dividing it by the number of persons in the
FAF applicants, who either lost household—was S$425. After COVID-19, the
median PCI fell to S$113, a 74% decline (Figure 9);
their jobs or had their take-home
pay reduced. • Post-COVID-19, 35% of FAF applicants saw their
household incomes drop to S$0.
Median household income from work pre- and
Section III: Work Income
post-COVID-19
Here is a summary of reported household incomes
The data indicates that most of the families who
from work prior to COVID-19 (pre-COVID-19) and after
have reached out to Beyond are in the bottom 20%
the applicants’ incomes were affected by the COVID-19
nationally,81 in terms of household income, even
crisis (post-COVID-19):
before COVID-19. According to the government’s Key
Household Income Trends, 2019 report, the median
• Prior to COVID-19, the median household income
household income from work for resident households
from work—derived from totalling work income
in Singapore for 2019 was S$9,425.82 The median
in the household—was S$1,600. Post-COVID-19,
household income from work per household member
the median household income from work among
in 2019 was S$2,925. Nationally, the average monthly
applicants fell to S$500—a 69% drop (Figure 8);
household income from work per household member
median household income from work
pre- and post-COVID-19
$1,800
$1,600
$1,600
$1,400
$1,200
$1,000
$800
$600 $500
$400
$200
$0
Pre-Covid Post-Covid
Figure 8: Drop in median household income from work
26median per capita income from work
pre- and post-COVID-19
$600
$500
$425
$400
$300
$200
$113
$100
$0
Pre-Covid Post-Covid
Figure 9: Drop in median per capita income from work
percentage loss of work income by
pre-covid-19 income brackets
300
250
Number of Applicants
200
150
100
50
0
0-499 500-999 1000-1499 1500-1999 2000-2499 2500-2999 3000-3499 3500-3999 4000-4499 4500-4999 5000-5499 5500-5999 6000-6499 6500-6999 7000-7999 9000+
0%
-10%
-20%
Average % Loss of Income
-30%
-40%
-50%
-60%
-70%
-80%
-90%
-100%
Figure 10: Percentage loss of work income by pre-COVID-19 income brackets
27CHAPTER 2 BEYOND’S COVID-19 STUDY: KEY FINDINGS
for those in the 1–10th percentile was S$597:83 FAF Section IV: Housing Costs and
applicants’ median household income from work per Arrears
household member pre-COVID was S$425. Monthly rent paid by FAF applicants
In terms of housing types, 80% of FAF applicants lived
Percentage drop in household income in public rental housing, while 18% lived in purchased
Figure 10 charts the average percentage change in HDB flats. The remaining 2% consisted of homeless
pre- and post-COVID-19 income for applicants in persons and those who rented rooms off the private
different income brackets. As can be seen from the rental market.
upward sloping trend line, the drops in income have
been more severe for those in the lower-income FAF applicants who lived in public rental flats reported
brackets. The percentage income drop for those quite a wide range of rental payments per month
earning less than $500 was 90%; for those earning (Figure 11). While the monthly rent for public rental
between $500 and $999, it was 75%; for those earning housing listed on HDB’s website ranges from S$26
between S$1,000 and $1,499, it was 65%; for those to S$275 (depending on whether it is a 1-room or
earning between S$1,500 and $1,999, it was 58%. 2-room flat; and whether the occupant is a ‘first-tim-
While declines were significant overall, those already er’ or ‘second-timer’),84 63 FAF applicants reported
surviving on less experienced greater drops in income, paying rents much higher than that, with several
signalling deepening income inequality. paying rents above $700 (the highest reported figure
monthly rent paid by faf applicants living
in public rental flats
353
350
300
250
Number of Applicants
200
175 167
150
124
100
65
50
37
25
20
5 6 4 3
0
0-49 50-99 100-149 150-199 200-249 250-299 300-349 350-399 400-449 450-499 500-549 500 and
above
28 Figure 11: Monthly rent paid by FAF applicants living in public rental flatsCHAPTER 2 BEYOND’S COVID-19 STUDY: KEY FINDINGS
While declines were significant
Rent or mortgage
as percentage of
overall, those already surviving
household income
on less experienced greater drops pre- and post-COVID-19
in income, signalling deepening household
income inequality. 30%
27%
25%
was $800 a month). Rental rates are reviewed at the
20%
point of tenancy renewals every two or three years by 18%
HDB—if household incomes increase, rent may also 15%
be increased. When household incomes shrink, rental 12%
10%
housing tenants are required to make appeals to the 7%
5%
HDB or to Social Service Offices (SSO) for assistance. 85
(It is noted that in October 2020, the HDB announced 0%
Before Covid-19 After Covid-19
50% rebates for three months for persons residing in
public rental flats.)86 Figure 12: Rent or mortgage as percentage of household
income pre- and post-COVID-19
Rent or mortgage as a percentage of household
income more than doubled as a result of drops in
household income (Figure 12), adding considerable percentage of families
financial strain for households. with arrears
No
Arrears
41%
More than half the applicants (54%) reported that (503)
their households were already dealing with arrears
(Figure 13). Applicants had arrears in rent, mortgages,
utilities (water and electricity), service and conservancy
charges (S&CC), phone or Wi-Fi bills, and hire purchase
payments, among others. Some were servicing loans
taken out to pay for vehicles related to work, for
example motorcycles, cars, or vans for private car hire
drivers and food delivery riders. With such drastic
income losses, it is expected that household indebted-
Yes
ness will increase.
54%
(667)
Not Answered
5%
(61)
Figure 13: Percentage of families with arrears
29CHAPTER
THREE
QUALITATIVE FINDINGS:
MULTIPLE FORMS OF INSECURITYCHAPTER 3 QUALITATIVE FINDINGS: MULTIPLE FORMS OF INSECURITY
The pandemic has made clear how much our society—
and economy—relies on the industry and labour Essential work, however, is not
of essential workers such as supermarket cashiers, just underappreciated—it is often
garbage collectors, cleaners, delivery riders, as well
poorly paid and, now, much more
as healthcare workers, among others. Essential work,
perilous: as the privileged retreat
however, is not just underappreciated—it is often
poorly paid and, now, much more perilous: as the into safety when infections peak,
privileged retreat into safety when infections peak, essential workers occupy the
essential workers occupy the frontlines, commute frontlines, often without adequate
by public transport, and contend with hostility and
social and labour protections.
harassment from customers when trying to enforce
social distancing measures;87 all this without adequate
and temporary work, subcontracted work, dependent
social and labour protections. While the pandemic has
self-employment (gig work), and work with variable and
decimated these workers’ earnings, the underlying
non-guaranteed hours.89
precarity is not a new phenomenon generated from
the COVID-19 crisis. Many FAF applicants or members of FAF applicants’
households are part of the gig economy (as food or
This chapter delves into the precariousness experi- parcel delivery persons or private car hire drivers),
enced by FAF applicants and is divided into two key which continues to grow and absorb those who have
sections. As many FAF applicants are engaged in lost jobs as a result of COVID-19. The ILO places gig
economy workers in the category of ‘disguised employ-
non-standard forms of employment (NSFE), Section I
ment’ or ‘dependent self-employment’, which ‘lends
discusses the forms of labour insecurity characterized
an appearance that is different from the underlying
by NSFE, with an emphasis on gig economy workers.
reality, with the intention of nullifying or attenuat-
Section II uses case studies, drawn from the experi- ing the protection afforded to workers by law’.91 The
ences of FAF applicants, to demonstrate how labour framing of gig economy workers as ‘self-employed
insecurity interacted with other dimensions of insecu- independent contractors’ remains controversial and
rity for many low-income families during this outbreak. continues to be subject to legal scrutiny,92 with some
deriding this classification as ‘sham self-employ-
ment’ that disguises the risks involved in such work,93
Section I: Non-Standard Forms of risks that are disproportionately borne by individual
Employment workers.
The ILO terms employed persons who live in poverty
the ‘working poor’; this situation is generally attributed Nonetheless, local news outlets have reported a
notable surge in delivery rider sign-ups for food
to ‘low earnings’ and ‘inadequate working conditions’.88
delivery platforms since April 2020.94 Deliveroo added
The employed FAF applicants, who are situated in the
an additional 1,000 riders to its fleet in the month
bottom 20% nationally in terms of household income,
of April 2020 (leading to a total of 7,000 riders), and
sit firmly in this category. Many are engaged in pre- expected to hire another 2,000 riders by end June
carious NSFE (Figure 14), which includes part-time 2020. Grab reported an 80% increase in applications
31You can also read