THE COST OF CASH IN THE UNITED STATES
←
→
Page content transcription
If your browser does not render page correctly, please read the page content below

THE INSTITUTE FOR
                                     BUSINESS IN THE
                                     GLOBAL CONTEXT

THE COST OF CASH IN THE UNITED STATES
                BHASKAR CHAKRAVORTI & BENJAMIN D. MAZZOTTA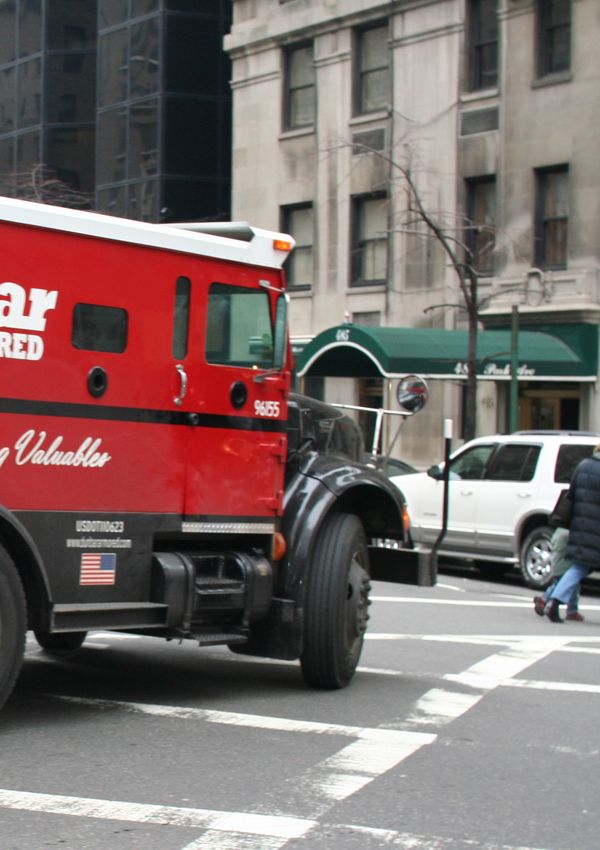
ii

       THE INSTITUTE FOR
       BUSINESS IN THE
       GLOBAL CONTEXT

     THE COST OF CASH IN THE UNITED STATES
     Part one of a series on the cost of cash around the world, including
     Egypt, India, and Mexico.
     September 2013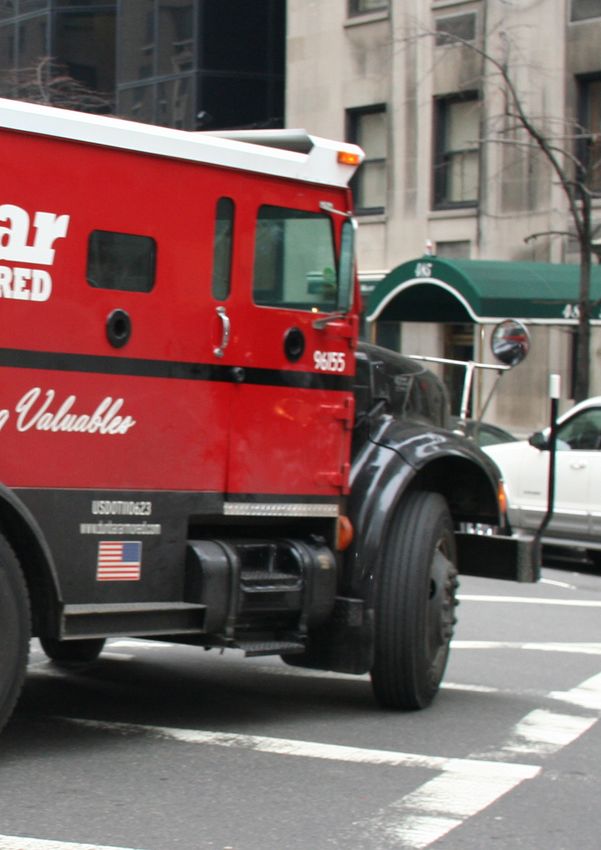
iii

ACKNOWLEDGMENTS
      The authors are grateful for the support and counsel of their colleagues and sponsors.

      Without the advice and critiques of many distinguished experts, this work would not

      have been possible. The views expressed in this report and any remaining errors are the

      authors’ alone. A special thanks to Barbara Bennett, Scott Schuh, Oz Shy, Joanna Stavins,

      and Tamas Brigelvics of the US Federal Reserve; Gonzalo Santamaria, Trish Halligan, Rich-

      ard Haycock, and Robynn Haycock of Currency Research; Eugenie Foster; Kim Huynh,

      Carlos Arago, and Chris Foster of Bank of Canada; Jim Pitts of Financial Services Round-

      table; David Wolman; Yuwa Hedrick-Wong, Mike Angus, Pilar Ramos, and Hemant Baijal

      of MasterCard Worldwide; George Smirnoff of Morgan Stanley; Michal Polasik of

      Nicolaus Copernicus University; Patricia Hewitt of Mercator Advisory Group; Kevin

      Mellyn of MPayMe; and from The Fletcher School, Kim Wilson, Nicholas P. Sullivan,

      Jenny Aker, Stacy Neal, Juan Arce, and Katrina Burgess.
iv

     AUTHORS
                            Bhaskar Chakravorti
                            Senior Associate Dean for International Business and Finance

                            The Senior Associate Dean of International Business and Finance at The Fletcher School,
                            Bhaskar Chakravorti is also the Executive Director of Fletcher’s Institute for Business in
                            the Global Context and a Professor of Practice in International Business. Dean Chakravorti
                            has extensive experience in academia, strategy consulting, and high-tech R&D. Prior to
                            Fletcher, Dean Chakravorti was a Partner at McKinsey & Company and a Distinguished
                            Scholar at MIT’s Legatum Center for Development and Entrepreneurship. Chakravorti has
                            also served on the faculty of the Harvard Business School and the Harvard University
                            Center for the Environment.

                            Benjamin D. Mazzotta
                            Postdoctoral Research Fellow for Inclusive Growth

                            Dr. Benjamin D. Mazzotta is a Postdoctoral Research Fellow for Inclusive Growth at the
                            Institute for Business in the Global Context, where he works on the Cost of Cash study,
                            which analyzes how cash payments affect a broad array of economic stakeholders in
                            different countries. Dr. Mazzotta has held a number of research positions within Tufts
                            University and elsewhere: with the Institute for Global Maritime Studies, the Space Policy
                            Working Group, the Cultural Change Institute, the University of Duhok’s School of Eco-
                            nomics and Business Administration, and the US Cyber Consequences Unit (US-CCU).

     Editors

     Melita Sawyer              Jamilah Welch

     Research Assistants
     Ayesh Ariyasinghe          Quang Truong

     Kimberly Corcoran          Ravi Chaturvedi

     Betsy Ness-Edelstein       Nikhil Joseph

     Institute for Business in the Global Context
     The Fletcher School, Tufts University
v

ABOUT THE INSTITUTE FOR
BUSINESS IN THE GLOBAL CONTEXT
       The Institute for Business in the Global Context (IBGC) connects the world of business
       to the world. It is the hub for international business at The Fletcher School at Tufts
       University, the oldest exclusively graduate school of international affairs in the United
       States. The Institute takes an interdisciplinary and international approach, preparing
       global leaders who can cross borders of many kinds and integrate business skills with
       essential contextual intelligence. The Institute is organized around four core activity
       areas: education, research, dialogue, and a lab. The Master of International Business
       degree and executive education offerings, coupled with original research in the areas
       of inclusive growth, innovation, and global capital flows, facilitate vibrant conferences,
       symposia, and speaker dialogues.

       IBGC gratefully acknowledges support from The Bill & Melinda Gates Foundation, Citi
       Foundation, Chicago Bridge & Iron, The Global Fund, Hitachi Corporation, Hitachi
       Research Institute, K&L Gates, MasterCard Foundation, MasterCard Worldwide, Oliver
       Wyman, The Rockefeller Foundation, Dr. Thomas Schmidheiny, State Street Corporation,
       and Tata Group.
THE INSTITUTE FOR
                                                                   BUSINESS IN THE
                                                                   GLOBAL CONTEXT

THE COST OF CASH IN THE UNITED STATES
                               BHASKAR CHAKRAVORTI & BENJAMIN D. MAZZOTTA

          Acknowledgments ............................................................... iii

          Authors. . ...............................................................................iv

          About the Institute for Business in the Global Context...............v

          Introduction.......................................................................... 3

          Consumer Study: Overview and Findings. . ............................... 9

          Business Study: Overview and Findings................................ 25

          Government Study: Overview and Findings........................... 31

          Salient Findings and Implications.......................................... 37

          Bibliography. . ...................................................................... 41

          Appendix 1: Consumer Cash Habits....................................... 45

          Appendix 2: Merchant Study. . ............................................... 57
RAI STONES
Stone discs were used as a form
of currency on the island of Yap
Introduction    3

INTRODUCTION

                    On the island of Yap, in the Western Pacific, large discs made of lime-
                    stone — some up to 12 feet in diameter — were used as form of currency for
                    important social transactions such as marriage, inheritance, political alliance
                    and, in times of great need, in exchange for food. Most of the time, these
                    heavy stone discs did not change hands; everybody in the village just ac-
                    knowledged that the stone had a new owner. The stone need not even be
                    on the island to be regarded as something of monetary value. Once upon a
                    time, according to Yap lore, a stone disc was lost at sea by a crew bringing
                    it back from a limestone quarry on another island. Everyone on the island
                    accepted the crewmen’s account that the stone lay at the bottom of the sea
                    and so, granted someone’s claim over its value. This stone, or the idea of it,
                    was thereafter considered good money and accepted as fair compensation.1

               Money is an abstraction built on trust. As such, alternatives to the most tan-
               gible form of money — currency or cash — and its replacement with cashless
               payments have become possible. Such an ecosystem is one where no transac-
               tion requires money in the form of notes and coins, and where value can be
               exchanged through the transfer of information between transacting parties.
               There have been multiple waves of such alternatives. Established alterna-
                                     tives to cash include checks, credit cards, debit cards,
  MONEY IS AN ABSTRACTION            and prepaid debit cards. More recently, innovative op-
            BUILT ON TRUST.          tions have sprung up that not only threaten to imperil
                                     the ubiquity of cash but also upend the traditional pay-
               ment ecosystem. These include smartphone-enabled credit card acquirers,
               such as Square, and Automated Clearing House or ACH acquirers, such as
               PayPal and Dwolla. And then there are even more ambitious alternatives to
               cash that have been proposed, such as Bitcoin, a web-based cryptocurrency.
               Unlike traditional money, such alternatives do not derive their value from
               government fiat. Each of these alternatives have evolved networks within
               which they are uniformly accepted as a means of payment; the more estab-
               lished alternatives, of course, have the widest networks.

                    This study starts from a simple observation: cash derives its value from the
                    information it contains and is a classic information good, which can be re-
                    placed by a digital substitute.2

                    1   William Henry Furness, Island of Stone Money, Uap of the Carolines (Philadelphia: J.B. Lippincott Company,
                        1910).
                    2   Hal R Varian, “Markets for Information Goods,” October, 1998; Carl Shapiro and Hal R. Varian, Information
                        Rules: a Strategic Guide to the Network Economy (Harvard Business Press, 1999).

                                                          © 2013 THE FLETCHER SCHOOL OF LAW AND DIPLOMACY, TUFTS UNIVERSITY
4 THE COST OF CASH IN THE UNITED STATES
Today most information goods with a sufficiently developed digital substitute have been disrupted and
displaced. Cash, however, is different from the usual examples that spring to mind: communication, mu-
sic, movies, and, increasingly, books. Money in the form of cash is a tangible embodiment of value. Cash
is itself nothing more than a promise to pay: a completely interchangeable, transferable promise to pay
the bearer. The purpose of money is to have stored wealth on hand for purchases today and tomorrow.
Individuals derive a certain utility from holding cash that stems from many factors combining rational,
behavioral, institutional and emotional drivers. That said, cash must be held in physical form, counted,
guarded, and accounted for. It can be difficult to transport and send. Being possibly the last thing you can
expect to recover from a stolen wallet, acceptable everywhere, and anonymous, it is inherently insecure.
In any serious quantity, most legitimate businesses prefer some other party, such as a bank, to handle cash
on their behalf. In other words, cash satisfies two of the most significant criteria of digital disruption: there
are viable digital alternatives with wide networks of adopters and cash presents the carrier with multiple
forms of disutility or costs.
This begs the questions: why has cash not been completely displaced, what are the costs and benefits of
its continued use, and what are the implications for innovation in the use of cash and its alternatives?
There are many factors that account for the continued prevalence of cash use:
First, there is a powerful force of habit and inertia that helps lock in behaviors and expectations, particu-
larly when there are multiple stakeholders involved. Both parties to a transaction must be plugged into
a compatible network. Both the payer and the payee must have compatible payment accounts, whether
with depository institutions, issuing and acquiring banks, or disruptive innovators such as Bitcoin and
Paypal. If payer and payee do not have compatible accounts, third parties such as check cashing stores
must stand in for one of the counterparties’ depository institutions. Merchants are used to processing
payments in the same way their customers are used to paying for them. Everyone finds the status quo
convenient and can be assured that all stakeholders accept cash as a legitimate form of payment. Adopt-
ing a new payment interface, whether it involves a new interface for an existing account or a new set of
hardware to acquire payments from familiar payment cards, entails new behaviors, risks or expectations
that merchants and consumers are ill-equipped to assess.
Second, network effects are hard at work in endowing money with value. Because more or less everyone
accepts it — including the government and banks — money is the natural way to denominate prices in the
economy. Cash can, in principle, be used to buy, well, anything that money can buy. The origins of curren-
cy notes are in promises to redeem the notes for something scarcer still: a quantity of precious metal, or an
amount of money issued by a different authority. But with the closure of the gold window in 1973, money
became a snake biting its own tail, a promise to repay the bearer with an abstraction, a dollar is, ultimately
another identical currency note. Cash represents the ultimate guarantee to all sides of the transaction. In
a way, holding cash provides a sense of comfort and assurance, which is an important consideration for
consumers who wish to have a certain minimum amount of cash.
© 2013 THE FLETCHER SCHOOL OF LAW AND DIPLOMACY, TUFTS UNIVERSITYIntroduction 5
THE CENTRAL INCONVENIENCE OF MONEY
IS ITS VERY PHYSICAL MANIFESTATION.
Third, cash gives the spender a sense of control over spending and visibility over how much of a budget
has been expended. This feature is convenient not just for the spender but also for others who care about
the spender’s budget — for example, parents who wish to establish limits on their children’s spending.
Fourth, cash offers anonymity and financial privacy. This feature is a strong motivation for many con-
sumers who do not wish to establish a traceable record for their personal transactions in general or for
particular purposes.
Fifth, there are multiple alternatives to cash, ranging from credit cards and checks to mobile payments
services, among others. The field is quite fragmented, particularly for newer alternatives, which creates
barriers to adoption, since every potential adopter may worry about whether they can reliably use the
option as a substitute for cash in a sufficiently wide variety of transactions.
Sixth, in order to truly see cash replaced with alternatives, key traits of the tangible features of currency
would have to be replicated. Something or someone would have to ensure that when an e-dollar entered
one person’s wallet, it also left the wallet of some other person. An e-dollar, shouldn’t be allowed to be
in two places at once, but there are very few examples of such technology in the world. By default, most
computer files can be copied. If one copy of an e-dollar exists, as many copies of that e-dollar as one might
want can be created. A whole field of cryptography undergirds the software used to decide whether or not
a book can be read on a specific Kindle, whether or not a song can be played on a specific iPod. Attempts
to circumvent that digital rights management (DRM) software are a felony, and the subject of contentious
debate on college campuses and in Congress. The technology to implement DRM, essentially a system
of cryptographic locks, on every e-dollar in the economy is just not there yet. And there is good reason
to suspect it never will be. DRM is highly contextual: it only works within a given ecosystem of software
used to read and play the files. It also depends on a central database of permissions that decides whether
or not to allow the file to be read. So aside from the bandwidth and hardware requirements that would
be necessary to create true digital money, the anonymity of cash would also have to be compromised. A
dollar bill has no idea who is holding it. But a system of digital payments, such as mobile money, cannot
operate independent of the notion of account holders, at least not today. Mobile money systems, for all the
metaphors, behave much more like bank accounts than they do like money itself. So with digital innova-
tion one must be on guard against misnomers and false analogies.
Seventh, major factors that get in the way of scaling up alternatives to cash, such as mobile payment
systems, are the regulatory constraints and the separate silos within which the relevant industry play-
ers — banking services, telecommunications, software, retail — operate. Mobile payments require a degree
of cooperation across these industries. Such coordination and agreement is difficult to orchestrate.
© 2013 THE FLETCHER SCHOOL OF LAW AND DIPLOMACY, TUFTS UNIVERSITY6 THE COST OF CASH IN THE UNITED STATES
In summary, cash has several benefits and there are switching costs that deter users from turning to al-
ternatives and displacing cash altogether. Currency retains several appeals as a means of payment, only
some of which will be replicated by innovators. It requires no intermediaries; any two counterparties can
come together face to face and transact with precision and speed. It is anonymous as it bears no record of
the user’s identity. All other payment systems are based on account balances tied to identities. There is
no mobile money or other digital solution on the market today that provides the same type of anonym-
ity cash provides. Cash is tangible, and bearers get constant feedback about current balances (provided
balances are small). Transactions are usually instantaneous, and once money is handed over the remain-
ing balance is visibly lessened. This constant feedback about remaining balances can be leveraged for
any variety of purposes, such as sticking to a budget or reinforcing the pain of spending. Because digital
signals can be replicated, there is no such thing as a unique copy of a file that can replicate this tangible,
anonymous, and disintermediated store of value in the same way that a coin and a currency note can.
On the other hand, the central inconvenience of money is its very physical manifestation. Because money
is somewhere, it must be brought somewhere else in order for a payment to be completed. No fax ma-
chine or website shopping cart can move the money from your wallet to the merchant. Bills distributed
by mail take pains to warn the payer not to remit cash by mail, since the cash might be lost in transit. In
order to transact in cash, two counterparties must arrange to meet face to face, or entrust a courier with
the cash for delivery. These costs of travel, and the risks of loss, make cash seem hardly an ideal medium
of payment. And yet cash comprises a large proportion of transactions in the economy, and not only in the
peer-to-peer space where electronic payments were (until recently) expensive to accept.
So, then, what benefits can be gained from continued use of cash, and what costs might push users to
more widely adopt alternative payment methods? This report is part of a larger study, performed by The
Fletcher School at Tufts University’s Institute for Business in the Global Context (IBGC) that seeks to as-
certain the private costs and risks of cash management facing each of a set of stakeholders in the American
economy: consumers, firms, the government, and also financial institutions. It does not intend to evaluate
the likelihood of cash use falling to a given level. Unlike much of the academic work previously done
in this area, which focuses explicitly on the analysis of social costs with a view to inform public policy,
IBGC’s approach uses opinion surveys to collect data from stratified samples of American consumers and
merchants to understand the real costs and risks they face as private actors in their usage of cash. The
findings are then integrated with estimates based on secondary research and analyses.
© 2013 THE FLETCHER SCHOOL OF LAW AND DIPLOMACY, TUFTS UNIVERSITYIntroduction 7
Figure 1 provides a summary of the cost of cash to various stakeholders. The estimates below are based on
highly conservative assumptions. On aggregate, the cost of cash in the United States is $200 billion annually.
FIGURE 1. COST OF CASH SUMMARY
Annual Cost of Cash in the United States Stakeholder, Breakdown
250
101
200
USD, billions
150
55
100
50 43
0
ATM Fees
Account Fees
Time Spent
Household Theft
HOUSEHOLDS
Armored Cars
Retail Theft
Bank Robberies
New Branch Costs
ATM Operations
BUSINESS
New Currency
Cash Operations
Tax Gap (25%)
GOVERNMENT
© 2013 THE FLETCHER SCHOOL OF LAW AND DIPLOMACY, TUFTS UNIVERSITYPAYING FOR CASH Consumers spend approximately 28 minutes per month traveling to the point where they access cash.
Consumer Study: Overview and Findings        9

CONSUMER STUDY:
OVERVIEW AND FINDINGS

                          Introduction
                          Consumers invest considerable time and money in managing their personal
                          finances. Increasingly, as electronic payments — phone, card, and comput-
                          er — continue to gain market share of payment transactions in the United
                          States, the cost of cash transactions is increasingly unclear and the costs of
                          managing cash are rarely measured. As part of a larger initiative which seeks
                          to understand the changing landscape of global payment systems, this study
                          attempts to document the “Cost of Cash,” hoping to understand the finan-
                          cial, time and productivity outlays associated with cash use in the United
                          States for consumers, businesses, and governments.

                    In order to understand the actual and perceived impact of cash on con-
                    sumers, The Institute for Business in a Global Context (IBGC) conducted a
                    survey of 1,000 Americans. The questionnaire assessed how respondents ob-
                                         tained cash, how often they exchanged cash for checks
 THE COST OF CASH IS HIGHER FOR          or bank deposits, the aggregate cost of cash manage-
POOR AND UNBANKED AMERICANS              ment, and the determinants of those costs. This chapter
                                         will describe the research design, and will then evalu-
       THAN FOR OTHER GROUPS.
                                         ate reported cash usage and aggregate private costs of
                                         cash management, disaggregating the analysis of the
                    survey’s findings by demographic and financial features. Finally, a simple
                    model is proposed that could, based on the stylized facts of the survey’s find-
                    ings, explain why the cost of cash management might vary with financial
                    features of the respondents.

                          Study Design
                          IBGC’s study used random telephone digit dialing within contiguous blocks
                          of 100 phone numbers and computer-assisted telephone interviews, with the
                          assistance of an external vendor. The interview covered consumer behavior
                          and attitudes regarding the use of cash. The sample was stratified by income,
                          racial self-identification, educational attainment, and urban centrality. The
                          twelve-minute survey consisted of questions that covered the respondent’s
                          demographic and employment profile, portfolio of payment accounts, and
                          specific habits and perceptions related to cash use. Most answers were
                          closed-form, requiring a multiple choice selection or a single number as a
                          response. Key demographic questions are described in detail below.

                                                     © 2013 THE FLETCHER SCHOOL OF LAW AND DIPLOMACY, TUFTS UNIVERSITY
10 THE COST OF CASH IN THE UNITED STATES
DEMOGRAPHICS AND EMPLOYMENT PROFILE
The survey collected demographic data including racial self-identification, educational attainment, and
urban centrality. In addition, employment information such as employment status, and the payment
method for receiving income was collected. Respondents were asked if they had a bank account and if
they used check cashing services. In this report, income source refers to how the respondent earns a living:
through a job, help from friends and family, investment income, or various types of government support.
Separately from the discussion of income source, respondents were asked to identify their occupation.
This section of the interview also asked about financial access: meaning which commonly held assets the
respondent had, such as a checking account and savings account.
INCOME AND CASH SOURCES
Respondents were asked about how they typically receive income and, separately, how they typically
obtain cash. Distinct from the income source, these answers are referred to as the income instrument and
the cash source. Income instruments are paychecks, Direct Deposit, cash, and a few other choices. Cash
sources are bank branches, check cashing stores, ATMs, employers, friends and family, or a few other
places where cash might typically be accessed.
Additionally, respondents recalled recent cash access events in the past 30 days. For each event, the
respondent was asked when the cash was received or obtained (in number of days past), the amount
obtained (in dollars), the type of cash source (ATM, bank teller, employer, friend/family, etc.), the time
required to get the cash (in minutes), the mode of transit used to get the cash, and the fees paid for the
transaction (in dollars), if any. For those that received income in cash, respondents specified how that cash
was typically stored: as hard currency on hand, in a bank account, on a prepaid or stored value card, with
a trusted acquaintance, or in some other way.
RISK PERCEPTIONS
IS CASH SAFE?
To estimate consumers’ risk preferences with regard to holding cash, consumers were asked whether they
find some cash balances “too large.” Without suggesting any specific cause of risk (e.g., theft), a binary
yes/no answer was solicited regarding whether a sum could be too large to hold in cash. If yes, the con-
sumer was asked how much and how best to handle the cash: deposit, entrust, spend, or give it (away).
IS CASH NECESSARY?
In order to estimate consumer’s perception of cash’s necessity, respondents were asked if there was “A
there a minimum amount of cash that you always try to keep on hand?” No specific scenario (such as an
emergency fund, enough for a tank of gas, enough to settle an informal debt, etc) was given. This question
was designed to estimate an observable consequence of obligatory (i.e., necessary) cash balances.
© 2013 THE FLETCHER SCHOOL OF LAW AND DIPLOMACY, TUFTS UNIVERSITYConsumer Study: Overview and Findings 11
Total individual and household cash balances, (i.e., the amount of cash in the wallet and in the house),
were also assessed. Finally, respondents were asked about decision rules related to the cash balance:
whether they had maximum or minimum preferred cash balances, and how consumers with preferred
cash maxima avoid holding too much cash on hand.
ANALYSIS
The following sections describe the results of the logistic regressions that explain the likelihood of paying
for access to cash, the likelihood of traveling farther than average to obtain cash, and whether the costs of
cash are systematically higher among certain groups.
Key Findings
The consumer survey yielded three key insights:
• The cost of cash is higher for poor and unbanked Americans than for other
groups. Poor Americans who lack access to formal financial institutions carry
larger amounts in cash and pay the most fees in aggregate terms for cash
access transactions. Well-banked wealthier Americans, on the other hand,
report carrying far lesser amounts in cash, traveling less to access cash, and
pay few, if any, fees.
• The costs of using cash do not accrue at points of sale. Since merchants
rarely provide discounts or surcharges for using cash at the point of sale, the
costs of cash manifest elsewhere in the lifecycle of cash. This could mean,
among other things, costs that accrue as a result of the time or money spent in
making trips to a bank, ATM, or fees to cash checks.
• Personal cash theft is a relatively minor problem for American consum-
ers, who lose less than $500 million through such crimes, but pay close to $8
billion dollars in fees for ATM transactions outside of their account-holding
bank’s network. This is an interesting contrast to the high costs that businesses
bear from cash theft.
Detailed Findings
WHO HOLDS CASH?
Households generally carry small cash balances. The middle three quintiles of US households (those earn-
ing approximately $20,000 to $100,000 in annual income) report that they usually carry cash balances of
under $100.
The survey explored cash usage in detail, and found that the prevalence of cash in a household is cor-
related with key financial and demographic traits. Preferences for cash and for higher cash balances
demonstrated a significant relationship with the traits explored in detail below.
© 2013 THE FLETCHER SCHOOL OF LAW AND DIPLOMACY, TUFTS UNIVERSITY12 THE COST OF CASH IN THE UNITED STATES
DEMOGRAPHIC TRAITS:
The demographic traits of age, income, race, and gender had durable influence on cash holdings, percep-
tions, and costs.
AGE
Americans under 35 have median cash balances roughly half those aged over 55, but pay more in fees
than older Americans. Several factors may be at work here. As individuals age, they are likely to earn
more and accumulate assets, and therefore they may simply have more money that could be held in cash.
Additionally, older Americans prefer using bank tellers for transactions, a practice which typically carries
no fee. Consumers using check cashing, ATM cards, and types of cash advances may face higher charges
in some locations. Older Americans also access cash far less frequently, perhaps because of the temporal
distribution of income, reduced mobility, or long established habits.
INCOME
Richer Americans carry more cash in their wallets. Median cash balances for those earning over $60,000
are about the same as those of people earning less than $40,000. Income correlates not only with age, but
also with higher levels of education. Furthermore, the rich tend to hold more different types of payment
instruments, and to be more aware of the risks of accidental or malicious cash loss. Perceptions of the risks
associated with cash are explored in detail below.
RACE
Among racial groups, Latinos, Pacific Islanders, and American Indians report much higher average max-
ima of cash holdings, as compared to white, African American, and especially Asian Americans. African
Americans and Pacific Islanders are likely to hold minimum balances nearly double those of other groups.
GENDER
Men carry nearly double the amount of cash that women do. Men are slightly more likely to keep some
cash always on hand than are women, and they use roughly 50% more cash per month than do women.
FINANCIAL TRAITS:
The financial traits investigated included: whether the household has access to formal financial institu-
tions through a bank account, the types and sources of income the household receives, and the way in
which the receive income, or payment instrument. They were found to be correlated with who holds
higher cash balances and who pays more for cash.
BANKED STATUS
The unbanked access greater amounts of cash in a typical month than those with bank accounts. Those
with bank accounts are roughly twice as likely to report that it is possible to hold too much cash. The
unbanked, meanwhile, report substantially higher ceilings on cash balances if they have them at all, in
absolute terms and not adjusted for income.
© 2013 THE FLETCHER SCHOOL OF LAW AND DIPLOMACY, TUFTS UNIVERSITYConsumer Study: Overview and Findings 13
EMPLOYMENT STATUS
Self-employed and multiple job holders had the greatest cash balances (not adjusted for income), and the
unemployed and those on disability held the least. Employees and the unemployed were the most likely
to report that it was possible to hold too much cash. Those receiving federal benefits, including Social
Security, were about half as likely as others to think it was possible to hold too much cash.
INCOME INSTRUMENT
The payment instrument by which the consumer typically receives income can greatly affect the number
of cash access events required in a given month and the source of funds. Direct deposit transactions from
an employer lend themselves very well to access via ATM, cash back transactions at the point of sale,
and other comparatively cheap and ready sources of cash. Paper checks received by the unbanked may
require high fees and long wait times to be converted into cash, but the number of cash access transactions
may be quite small. Of course, informal transfers received as cash needed no separate transaction to be
held in cash.
WHAT COSTS DO CONSUMERS PAY FOR CASH?
After understanding who holds cash, the study investigated what costs people pay for their cash. There
are four main costs that consumers must pay for cash: fees, time, theft risk, and theft risk mitigation. Many
consumers pay fees in order to access cash, such as ATM withdrawal fees and check cashing fees. The
time and money spent getting to the bank or check cashing store are also important costs. Additionally,
consumers bear costs for the risk of cash theft, and the costs to mitigate that risk, such as periodic fees
on deposit accounts and prepaid cards used to avoid holding large cash balances. Each of these costs is
explored below.
ATM AND CHECK CASHING FEES
Many customers that use ATMs away from their account holding or “home” bank pay fees to access cash.
About 80% of ATM transactions are cash withdrawals,3 and the vast majority of home bank ATM transac-
tions are free. Therefore, the survey focused on the fees due for non-home bank ATM transactions. Nearly
$8 billion in fees is collected from these transactions annually. Some 2.1 billion fee-carrying ATM transac-
tions occur annually in the United States.4 On average, these transactions each incur about $3.85 in fees,
counting both home and host institutions.5
In addition, check cashing services generate approximately $200 million in additional revenue.6 The ma-
jority of other cash access transactions are either free or nearly free.
3 Chris Costanzo, “ATMs Unplugged,” Community Banker 11, no. 10 (2002): 24.
4 Federal Reserve System and McKinsey, The 2010 Federal Reserve Payments Study, 2010.
5 ATM Fee Survey of Westchester County Banks, 2010.
6 Christine Bradley et al., “Alternative Financial Services : A Primer,” FDIC Quarterly 3, no. 1 (2009): 39–47.
© 2013 THE FLETCHER SCHOOL OF LAW AND DIPLOMACY, TUFTS UNIVERSITY14 THE COST OF CASH IN THE UNITED STATES
THOSE PAID IN CASH REPORTED THEY WERE
COMFORTABLE HOLDING $12,000 MORE THE AVERAGE.
TIME
Consumers spend on average approximately 28 minutes per month traveling to the point where they
access cash. (Queue time was not included in the study’s time cost calculations.) However, there is a
high degree of variation in time costs faced by consumers, and the median trip to fetch cash was just five
minutes. If the average time cost of 28 minutes monthly were distributed across the American working
population, it would equal nearly 5.6 hours per year per individual spent fetching cash, worth a collec-
tive $31 billion at the mean wage. Few would suggest this is time Americans would otherwise have spent
working, so the tradeoff is most likely in leisure time and not directly in earnings. Nevertheless, it is in-
dicative of just how much time in the aggregate is spent managing currency.
Part-time workers, retirees, the unbanked, and those in the second income quintile (making between
$61,000 and $100,000 annually) show an elevated likelihood of longer time spent to access cash, not con-
trolling for demographic characteristics. The unbanked face a rise of more than 50% in the odds ratio for
high time costs. Retirees face a very similar margin, a bit over 50% higher. And part-time employment
indicates a rise of about 75% in the odds ratio.
Presenting these differences in minutes, it is evident that banking status and mode of income payment
have important time cost effects. Those receiving income in cash spent about 12 minutes longer per
month getting to the point where cash was accessed than did others. The unbanked faced additional time
costs of about five minutes per month, and the unemployed nearly nine minutes per month. Interper-
sonal cash transfers required even greater travel times, an average of 15 minutes per month greater than
for ATM users.
CASH THEFT
Consumers face a very small risk of cash theft, particularly theft as a personal crime rather than a property
crime or housebreak. Households that lose cash due to theft primarily do so as a function of house-
breaks and other property crimes, rather than personal crimes. Some 1.8% of households annually report
a property crime resulting specifically in cash loss, such as forced entry into a house or motor vehicle.
Only about 6 crimes per 10,000 people nationwide result specifically in the loss of cash. All these crimes
together, including both property crimes and personal crimes, will total about $500 million in cash losses.7
By almost any measure, cash stocks kept in the house represent a major source of risks to households.
Nationwide, nearly fifteen times as many housebreaks result in cash loss as personal theft. The aggregate
value of those losses is similarly larger: eight times as much cash will be lost from housebreaks as from
personal thefts. If the whole value of the housebreak is considered, counting only those crimes where cash
is lost, the value distribution of crimes involving cash is much higher. The median loss for housebreaks
involving cash theft is about $500, versus $100 for personal thefts.
Relatively few cash theft crimes involve the loss of less than the total amount of cash available to take.
Cash is light, fungible, anonymous, and valuable. This makes it an excellent prospect for theft. Thieves do
not need to find someone to sell the cash for them. With anything less than tens of thousands of dollars, it
7 Bureau of Justice Statistics, National Crime Victimization Survey, 2011.
© 2013 THE FLETCHER SCHOOL OF LAW AND DIPLOMACY, TUFTS UNIVERSITYConsumer Study: Overview and Findings 15
is easy to conceal and to transport. If discovered with the loot, thieves do not have to account for posses-
sion of a specific bill, the cash itself presents a limited evidentiary risk to the thief. Cash cannot be tracked
in the way that stolen vehicles and stereos can. And finally, cash can hold a lot of value. Even using twenty
dollar bills, the weight of $1 million is 55 kg.8 Any able-bodied adult should be able to comfortably carry
$1 million in US $100, at less than 25 lbs. Even before the circulation of euro notes began, pundits debated
whether the European central bank was deliberately courting money laundering and related seigniorage
profits through €500 note issuance.9 To thwart money launderers, the UK in 2011 banned that note from
its exchange houses.
THEFT RISK MITIGATION
Cash theft can be mitigated through a variety of strategies. When cash is likely to be taken from the home
or the wallet, those with a better option do not leave it there. They store it using bank accounts, mobile
money, prepaid balances with frequent counterparties, paying down debt, entrusting assets to a friend,
etc. A host of coping strategies might also accompany the rise in theft avoidance.
Individuals might employ safes, firearms, constant supervision of the home, home and vehicle alarms,
and other strategies to limit the risk of successful theft. Holding less cash is the best strategy. On the
other hand, most ways of mitigating cash theft risk are not focused on cash. Leaving the lights on auto-
matic timers may help reduce theft. Installing safes and burglar alarms may help reduce theft. Asking the
postman to hold the mail during vacations, getting to know your neighbors, and illuminating the areas
outside the home can all nudge thieves to target another house. Virtually none of the things that people do
to manage theft specifically address cash losses in the way that reducing household balances do.
Keeping money in the bank, no matter how poor the interest rate earned, is a time-honored strategy for
ensuring it cannot be stolen. All of the security costs are outsourced to the bank. In the United States, the
Federal Deposit Insurance Corporation (FDIC) insures against bank runs, while the Consumer Financial
Protection Bureau does its best to ensure consumers earn a return on their investments, or at least do not
pay too heavy fees on their accounts.
Exactly how much wealth households keep in cash is something of a mystery. Edgar Feige notes that if all
currency were held by households, the average household would have upwards of $10,000 in cash on the
premises.10 Federal Reserve household surveys gave vastly lower answers. The average consumer held
$291, and the median consumer held just $78 in total, between cash in the wallet and cash in the home.11
The average withdrawal size was roughly $120, and the total cash used in a month was $434 per capita.
8 Friedrich Schneider and Ursula Windischbauer, “Money Laundering: Some Facts,” European Journal of Law and Economics 26, no. 3 (October 21,
2008): 387–404.
9 Kenneth Rogoff, Francesco Giavazzi, and Friedrich Schneider, “Blessing or Curse? Foreign and Underground Demand for Euro Notes,” Economic
Policy 13, no. 26 (1998): 261–303.
10 E.L. Feige and I. Urban, “Measuring Underground (unobserved, Non-observed, Unrecorded) Economies in Transition Countries: Can We Trust
GDP?,” Journal of Comparative Economics 36, no. 2 (2008): 287–306.
11 Kevin Foster et al., “The 2009 Survey of Consumer Payment Choice” (Boston, MA, 2011).
© 2013 THE FLETCHER SCHOOL OF LAW AND DIPLOMACY, TUFTS UNIVERSITY16 THE COST OF CASH IN THE UNITED STATES
Since using a checking account is the only reasonable way to minimize the cash risk of theft separately
from all the other risk mitigation strategies, this study estimates the cost of consumers’ checking accounts
from survey data. A careful study in 2009 estimated that, ignoring transaction fees (such as overdrafts and
ATM withdrawals), about half of checking account holders managed to escape periodic charges.12 Banks
earned roughly $460 million in periodic fees each year from the other half of account holders. These fees
are not solely due to the desire to mitigate risk of theft loss. Depositors at retail banks get a variety of
other services with these periodic fees, such as cheap payments (both inbound and outbound), financial
advice and perhaps documentation of assets that would lower the cost of credit. But as a first cut, they
seem vastly more specific to the cost of keeping cash in the bank, which is the primary means of avoiding
the risk of theft or loss.
HOW MUCH DO CONSUMERS PAY FOR CASH?
After examining the types of costs borne by consumers to access cash, and the distribution of those costs
across different groups, the study examined how much consumers pay for cash.
BY FINANCIAL TRAITS
Financial traits, such as employment, financial access, and the instrument used to receive income can all
affect the risk that consumers pay for cash access. Figures in this section are described in terms of odds
ratios, rather than probabilities. Predictor variables are largely qualitative, meaning that they measure
effects based on group membership (such as those with a bank account vs. those without), rather than
cardinal (such as numerical age or household income). Those who pay nothing for cash were excluded
from calculations about the levels, as opposed to the incidence, of bank fees and wait times.
BANKED STATUS
The unbanked pay on average about $3.66 per month more than banked consumers. From a statistical
perspective, the effect is very strong. Those without a bank account face elevated odds of paying cash fees
at more than 3.7 times higher than the background. (To put this in perspective, if there were a 10% back-
ground rate and an odds ratio of this magnitude, the prevalence in the unbanked group would be more
than 40%. The regression model used estimates log odds ratios, not linear multiples of probability. This is
a good thing, because it avoids nonsensical predictions of probabilities greater than 100% or less than 0%.
No matter how large the increase in the odds ratio, one should always end up with sensible predictions
of probability.)
Controlling for demographic and income characteristics, these results become even more pronounced.
A second regression model was used to estimate whether the effect of financial inclusion on cash ac-
cess fees is sensitive to demographic variables such as race and urbanicity. Financial inclusion, meaning
whether or not the individual has a bank account, is a reliable predictor of whether that individual pays
for access to cash. The odds ratio of paying something for cash access rises by 340% (more than four times
the background odds ratio), even when controlling for race, income, age, sex, and urbanicity. This rela-
12 Victor Stango and Jonathan Zinman, “What Do Consumers Really Pay on Their Checking and Credit Card Accounts? Explicit, Implicit, and Avoid-
able Costs,” American Economic Review Papers and Proceedings 99, no. 2 (2009): 424–429.
© 2013 THE FLETCHER SCHOOL OF LAW AND DIPLOMACY, TUFTS UNIVERSITYConsumer Study: Overview and Findings 17
tionship is also statistically significant in the classic sense, meaning the data clearly indicate that an effect
of financial inclusion that is different from zero.
In the demographically controlled model, no observable differences exist between urban and rural, be-
tween male and female, or between rich and poor, that are not better explained by the ownership of a
bank account. The most statistically important demographic factor is race. African Americans are more
than twice as likely, as measured by the logit coefficient (2.2) to pay for access to cash. All other racial
groups in the sample were at lower risk than African Americans. Latino identity did raise the risk some-
what, but not in a statistically significant manner.
TYPES AND SOURCES OF INCOME
Employment status had a large effect on wallet cash balances and cash perceptions. Self-employed
and multiple job holders had the greatest cash balances (not adjusted for income), and the unemployed
and those on disability held the least. Employees and the unemployed were the most likely to report that
it was possible to hold too much cash. Those receiving federal benefits, including Social Security, were
about half as likely as others to think it was possible to hold too much cash.
From employment status alone changes to risk are observed. Retirees, who favor in-person bank teller
transactions, are 2.5 times less likely to pay for access to cash. However, while many retirees pay no fees,
those retirees that do pay fees pay $3 more per month. By contrast, the unemployed face increased risk of
fees at double the background rate. Unemployed people pay a hefty $11 more per month, and those on
disability pay $6 more per month than the rest.
However, employment status shows no similar robustness to demographic controls. When accounting
for age, sex, race, and income, the apparent effects of retirement, self-employment, and multiple jobs dis-
sipate. This tends to support the idea of inertia in payment habits: meaning that habits formed in cash
management are slow to change. So there is no reason to suspect that the individual’s income source (a
paycheck, self-employment, government benefits, social transfers) is more important than personal habits
in determining whether they face costs for access to cash.
Income sources matter even more than employment status. Among those that pay for cash, the amount
paid by someone on Social Security is about $8 per month above what a typical employee pays. The self-
employed have the lowest costs of all, saving about $1.40 per month over what a typical employee pays.
Possible explanations are at this point purely speculative. Perhaps these individuals (retirees, leave takers,
and the disabled) value convenience more and are willing to pay for it. They might prefer cash for careful
budgeting, suggesting further that they are keen to avoid risks of credit card bills or bank charges, or that
the cards they carry do not provide free access to cash back at the point of sale.
PAYMENT INSTRUMENT
Income instruments also have important effects on the prices facing Americans for access to their cash.
Those receiving income by prepaid or payroll card faced average costs more than four times as high
as the rest of the sample. The lowest fees were paid by those who received income by electronic funds
transfer or directly in cash. Ironically those paid in cash faced the longest travel times to reach the point
of access to their cash.
© 2013 THE FLETCHER SCHOOL OF LAW AND DIPLOMACY, TUFTS UNIVERSITY18 THE COST OF CASH IN THE UNITED STATES
• From the payment instrument alone, groups that are more likely to pay for
access are identifiable. Receiving income as a prepaid card, such as an elec-
tronic benefits card or a payroll card, increases the odds of paying cash access
fees by approximately five times.
• Prepaid cards, on the other hand, clearly increase the risk that some fees
will be paid to access cash. Controlling for age, sex, urbanicity, and income,
the prepaid card increases the odds of paying for cash by nearly seven times.
This risk does not attenuate the effects of age or race, which are relatively
stable with respect to other specifications.
• Finally, IBGC checked whether income source and wealth trump financial
access. They do not. In this model, which ignores race, urbanicity, and age, the
survey found familiar results. The risk increase due to financial exclusion is
four and a half times. Due to the fee-avoidance of older Americans, retirees
see an apparent risk reduction three times. Receiving income as a prepaid
card, rather than bank transfer, check or cash, drives risk up by perhaps 500%.
Since there are fewer individuals using prepaid cards to receive income, this
last estimate is less certain than the rest.
Payment instruments have a surprisingly strong effect on fees paid. Electronic income payment instru-
ments are significantly cheaper for the recipient than paper checks. Controlling for income, income source
and employment intensifies this effect. EFT transfers lower the cost of access to cash by some $5 per
month. EBT and payroll cards are ambiguous, but a plausible effect seems to be about $2 lower in costs for
cash access (among those paying for cash) when controlling for income sources and the level of income.
With only demographic controls and financial access (i.e., ignoring what type of income or employment
an individual has) payroll and EBT cards appear to lower monthly fees by about $3, vs. $5 for EFT and $4
for cash, relative to costs incurred by those receiving paper checks.
Households with good financial services do not require much cash, and typically receive income at no
cost. When they want access to cash they can choose between zero-cost methods and paying a fee for
convenience. Apart from occasional transactions, they overwhelmingly choose free access to cash. On
the other hand, barriers between paper checks and the cash economy exist. The risk of paying for cash is
higher among the unbanked. And the level of payments for cash has everything to do with financial traits
— such as bank account ownership, the type of payments received, whether the individual has a job, what
types of benefits are received — all of which reveals something about the role that cash plays in the house-
hold books. Is cash a primary means of receiving income, making purchases, buying financial services,
and saving for the future? Or is cash simply a convenience account held off to the side from disposable
income? The answers to these questions go a long way toward determining the risk of paying for cash.
© 2013 THE FLETCHER SCHOOL OF LAW AND DIPLOMACY, TUFTS UNIVERSITYConsumer Study: Overview and Findings 19
NEITHER INCOME NOR FINANCIAL INCLUSION HAS A
TERRIBLY STRONG EFFECT ON WHETHER PEOPLE HOLD
THE VIEW THAT CASH IS NECESSARY.
BY DEMOGRAPHIC TRAITS:
AGE
As discussed above, older retirees are 2.5 times less likely to pay for access to cash, given their preference
for banking with a teller. However, while many retirees pay no fees, those retirees that do pay fees, pay $3
more per month than the average consumer.
INCOME
The lowest income Americans paid the most in fees for cash access. They paid the most for cash in
absolute terms, not as a percentage of income or as a percentage of cash balances. This is an unsurprising
finding, but it refutes the idea that cash is somehow better suited to low-income households. Meanwhile,
higher income Americans generally held higher cash balances, and were more likely to appreciate the
risks inherent in carrying larger amounts of cash. Frequency of cash access correlated positively with
income, with the lowest quintile’s median reporting a single cash access event per month. It would not
be surprising if many low-income individuals relied on a monthly fixed income or informal transfer that
was immediately cashed.
Income has a weak effect on the likelihood that consumers pay for access to cash in a typical month.
The top income quintile faces an increased odds ratio of about two times relative to the bottom quintile,
but the effect is not linear through the middle class. The prevalence of fees for cash access among the
top 60% of the income distribution is clearly higher than for the lowest 40%, but this effect dissipates
when controlling for financial access and employment. There are likely two opposing effects at work: the
wealthy are more likely to have cash access offered to them for free, since they are among the better clients
of financial institutions. On the other hand, since their time is more valuable, the wealthy may be willing
to pay more for the convenience of cash access, even if cheaper alternatives abound.
Income also decreases the amount that individuals pay for cash access. Every quintile that an individual
climbs from the bottom 20% to the top 20% reduces monthly expenses for cash by about $0.65. And al-
though the industry in which the individual works has no effect, employment status itself does matter.
Those on leave and on disability each pay large increases above what employed individuals pay: nearly
$12 on average for those on leave and more than $5 for those with disabilities.
Controlling for all of these variables at the same time, the picture comes into sharper focus. The durable
statistical effects come from income, financial access, and employment status — particularly the disabled
and leave-takers. Controlling for race, sex, urbanicity, and census region the story is again the same.
If anything, these demographic controls highlight the importance of financial access, the lack of which
drives up the average paid by over $4 a month.
© 2013 THE FLETCHER SCHOOL OF LAW AND DIPLOMACY, TUFTS UNIVERSITY20 THE COST OF CASH IN THE UNITED STATES
CASH HABITS AND PERCEPTIONS OF RISK
FINANCIAL ACCESS: BANKED VERSUS UNBANKED
Financial access is clearly correlated with the perception of cash risks. Financial access is more impor-
tant to consumer perceptions about risk and necessity than is income or demographics. Only 23% of the
unbanked agreed that it was possible to hold too much cash, versus 43% for the rest of the population. The
maximum amount considered safe among unbanked consumers ($16,000) was more than twice as high as
that for banked consumers ($7,000). Since the unbanked are overwhelmingly concentrated in the bottom
40% of the income distribution, this is a very strong statement of risk perception.
Even controlling for income and education, the unbanked are only half as likely to see cash as risky.
Those with bank accounts are roughly twice as likely to report that it is possible to hold too much cash; the
unbanked access greater amounts of cash in a typical month than those with bank accounts.
Given that this pool of individuals does not hold deposit accounts, it is entirely possible that they use a
variety of other informal or tangible assets to manage cash balances. It is also possible that they hold large
debt to income ratios, and spend a good deal of available cash managing those debt balances with what-
ever cash happens to be on hand. But the views of the unbanked with regard to the risks of cash does not
seem to fit the story of a large minority of Americans holding hundreds of thousands of dollars in savings,
merely because they find the risk-return profile of cash preferable to deposit and investment accounts.
INCOME TRUMPS AGE
Perceptions about cash vary more with income than they do with age. While those over 65 are par-
ticularly unlikely to think that carrying large amounts of cash is unsafe, no obvious trend appears in the
middle years between 25 and 65 years of age. The richest quintile, on the other hand, are more than twice
as likely as the poorest to believe it is possible to hold too much wealth in cash.
Among income groups, certain groups are disinclined to see cash as risky. The self-employed are 2.5 times
less likely to see cash as risky; those on disability 3.2 times less likely; retirees 1.7 times less likely, and
homemakers 2.1 times less likely. Income and education both linearly increase the likelihood of holding
the risky view of cash. The story that more educated individuals would have considered the risks and
alternatives of holding cash makes a lot of intuitive sense. Also intuitive is that the wealthy would have
had experience with larger assets stocks, and more experience considering the risks and returns of differ-
ent asset classes.
VIEWS ON THE NECESSITY OF CASH
The results from the view that cash is necessary are ambiguous. Neither income nor financial inclusion
has a terribly strong effect on whether people hold the view that cash is necessary. The top quintile was
some 60% more likely than the bottom quintile to see cash as necessary. The bottom income quintile was
more different from the median than the top. This means that the wealthy are either better able, or more
inclined to keep some cash on hand.
© 2013 THE FLETCHER SCHOOL OF LAW AND DIPLOMACY, TUFTS UNIVERSITYConsumer Study: Overview and Findings 21
THOSE PAID IN CASH WERE SOME 2.2 TIMES
MORE LIKELY TO SEE CASH AS NECESSARY.
However, those paid in cash were some 2.2 times more likely to hold the necessity view. This, if any-
thing suggests that perceptions about the role of cash are driven in part by habits. Those paid in cash may
simply be used to using cash for more of their purchases, for prudential self-insurance, for interpersonal
transfers. They may shop at places where cash is most likely to be accepted. They may even feel that it is
polite or normal to pay with cash when possible.
CASH THRESHOLDS
The levels of cash thresholds tell a very similar story. The survey asked consumers to tell us about their
personal level of cash ceiling (the maximum amount of cash they are comfortable keeping on their per-
son or at home), and cash floor (the minimum amount of cash they always try to keep on hand). Cash
thresholds matter because a great deal of people’s behavior with regard to cash is driven by heuristics and
habits. Most people don’t make precise forecasts of how much cash they plan to use, or careful estimates
of the risks that cash could suddenly become necessary. Rather, some people eventually develop the view
that it’s just not a good idea to carry more than a certain amount of cash. And other people develop the
habit of always keeping a certain amount of cash on hand, if indeed it’s feasible to keep that buffer.
What sets the levels of those thresholds? The answers are particularly interesting because these practices
are so concrete and so much a part of daily life. Virtually everyone has an opinion on the subject, even if
the answer is, “I would be comfortable keeping any amount of money at all in the house. No upper limit!”
And the development of those heuristics are plausibly linked to an array of behavioral influences on how
people prefer to use cash. Heavy cash users must become accustomed to holding higher balances. Cash
hoarders and bank skeptics that derive special pleasure from the tangible presence of wealth might be less
nervous to hold onto a lot of money. People who are surrounded by cash-only vendors and farther from
cash access points should be more sensitive to the risks of finding one’s wallet empty.
At first glance, demographics appear to play a strong role in determining attitudes toward cash; but fi-
nancial traits explain the story best. Looking only at the relationship between age and the cash ceiling,
for instance, there is a secular decline in the cash ceiling that amounts to about $4,000 over fifty years.
Women hold ceilings about the same amount lower ($4,000) and little variation appears across racial
groups.13 Taking account of financial traits changes the picture considerably. After controlling for financial
access, employment, and income, the secular decline in cash ceilings due to age fall to about $350 over
fifty years, enough to notice but perhaps not to write home about. Those paid in cash specifically reported
up to $12,000 higher ceilings than the rest. Controlling for income, the self-employed were comfortable
holding some $14,000 more in cash; and those with multiple jobs nearly $15,000 more. Meanwhile the
unbanked, who are heavily concentrated in the bottom two quintiles of income, were content to hold
$9,000 more as well.
Cash floors show much stronger demographic patterns. Women hold about $30 less in cash than men.
African Americans hold about $40 more than other groups. Income accounts for about $40 of difference
between the top and bottom quintiles, with fairly linear effects across the middle quintiles. Pacific Is-
landers hold $120 more than other groups; while this average is exceptionally high (greater than 82% of
responses in the survey), it may also be influenced by the relatively small sample size for this group.
13 American Indians, who formed a very small part of IBGC’s sample, had overwhelmingly lower rates of bank usage, and consequently higher ceil-
ings for cash, to the tune of about $32,000.
© 2013 THE FLETCHER SCHOOL OF LAW AND DIPLOMACY, TUFTS UNIVERSITYYou can also read