Filling the gap A universal dental scheme for Australia - Stephen Duckett, Matt Cowgill and Hal Swerissen - Grattan Institute
←
→
Page content transcription
If your browser does not render page correctly, please read the page content below
March 2019

   Filling the gap
   A universal dental scheme for Australia
   Stephen Duckett, Matt Cowgill and Hal Swerissen
Filling the gap: A universal dental scheme for Australia

Grattan Institute Support                                             Grattan Institute Report No. 2019-02, March 2019

Founding members                          Endowment Supporters        This report was written by Stephen Duckett, Matt Cowgill, and Hal
                                          The Myer Foundation         Swerissen.
                                          National Australia Bank     We would like to thank Deb Cole, Martin Dooland, Mark Gussy, Matt
                                          Susan McKinnon Foundation   Hopcraft, Graeme Liston, Tony McBride, Tan Nguyen, James
                                                                      Robertson, John Rogers, Lesley Russell Wolpe, Heiko Spallek, John
                                          Affiliate Partners          Spencer, and other public service staff for their helpful comments, as
                                          Medibank Private            well as participants at a round table discussion in Melbourne in
                                          Susan McKinnon Foundation
                                                                      November 2018.
                                          Veitch Lister Consulting    The opinions in this report are those of the authors and do not
                                                                      necessarily represent the views of Grattan Institute’s founding
                                          Senior Affiliates           members, affiliates, individual board members, reference group
                                          Google
                                                                      members or reviewers. Any remaining errors or omissions are the
                                                                      responsibility of the authors.
                                          Maddocks
                                          PwC                         Grattan Institute is an independent think-tank focused on Australian
                                          McKinsey & Company          public policy. Our work is independent, practical and rigorous. We aim
                                          The Scanlon Foundation
                                                                      to improve policy outcomes by engaging with both decision-makers and
                                                                      the community.
                                          Wesfarmers
                                          Westpac                     For further information on the Institute’s programs, or to join our mailing
                                                                      list, please go to: http://www.grattan.edu.au/.
                                          Affiliates                  This report may be cited as: Duckett, S., Cowgill, M., and Swerissen, H. (2019). Filling
                                                                      the gap: A universal dental scheme for Australia. Grattan Institute.
                                          Ashurst
                                                                      ISBN: 978-0-6483311-9-3
                                          Corrs
                                          GE ANZ                      All material published or otherwise created by Grattan Institute is licensed under a
                                                                      Creative Commons Attribution-NonCommercial-ShareAlike 3.0 Unported License
                                          Jemena
                                          Urbis
                                          Woodside

Grattan Institute 2019                                                                                                                                       2
Filling the gap: A universal dental scheme for Australia

Overview
When Australians need to see a GP, Medicare picks up all or most            Existing public dental schemes are inadequate, uncoordinated, and
of the bill. When they need to see a dentist, Australians are on their      inequitable across states. Most states have waiting lists of well over a
own. There’s no compelling medical, economic, or legal reason to treat      year for public dental care – and if people need to wait a year for care,
the mouth so differently from the rest of the body. Australia should        their conditions are only going to get worse.
move towards a universal primary dental care scheme, funded by the
                                                                            The Commonwealth should take responsibility for funding primary
Commonwealth Government.
                                                                            dental care – just as it takes responsibility for primary medical care.
                                                                            Under a universal dental scheme, Australians could get the care they
Most spending on dental care comes straight out of patients’ pockets.
                                                                            need, when they need it, without financial barriers.
As a result, people who can’t afford to pay don’t get dental care, unless
they go on long (often multi-year) waiting lists for public care. About 2   It would be impractical to move to a universal scheme overnight. The
million people who needed dental care in the past year either didn’t get    cost would be large – around $5.6 billion in extra spending per year
it, or delayed getting it, because of the cost. Low-income people are       – and the oral health workforce would need to be expanded. So, the
most likely to miss out on care.                                            Commonwealth should announce a roadmap to a universal scheme,
                                                                            including plans to expand the workforce, followed by incremental steps
The consequence of this is widespread poor oral health. About a             towards a universal scheme.
quarter of Australian adults say they avoid some foods because of
                                                                            The first step is for the Commonwealth to take over funding of existing
the condition of their teeth; for low-income people, it’s about a third.
                                                                            public dental schemes, fund them properly to the tune of an extra
Low-income people are more likely to have periodontal disease,
                                                                            $1.1 billion per year, and enable private-sector providers to deliver
untreated tooth decay, or missing teeth.
                                                                            publicly-funded care. Coverage should then be expanded – first
                                                                            to people on Centrelink payments, then all children. After that, the
Bad oral health has painful and costly consequences. Evidence
                                                                            Commonwealth should take the final step to a universal scheme, ideally
suggests oral health conditions can contribute to other health problems,
                                                                            within a decade.
including diabetes and heart disease. Most oral health conditions are
preventable and get worse if untreated – people often end up going to a     Removing financial barriers to dental care would improve Australians’
GP or hospital emergency department to be treated for conditions that       oral health. This report shows how to fill the dental gap in our health
could have been arrested with earlier care.                                 system.

Grattan Institute 2019                                                                                                                                  3
Filling the gap: A universal dental scheme for Australia

Recommendations
Commit to a universal dental care scheme                                      Dental hygienists and oral health therapists should have a greater role
The Commonwealth Government should declare its intention to                   A range of dental care services can be delivered by non-dentist dental
introduce a universal primary dental care scheme                              professionals. The payment structure to dental practices should
                                                                              encourage the most appropriate professional to deliver each service.
Every Australian should have access to publicly-funded, high-quality,
primary dental care when they need it. The Commonwealth
Government should set out this goal clearly and legislate a time frame
to achieve it.                                                                The Commonwealth and states should enhance prevention programs,
                                                                              including water fluoridation

The universal scheme should cover primary dental care and emphasise           The universal scheme should fund oral health promotion activities.
early intervention                                                            The emphasis should be on population-wide schemes to reduce the
                                                                              incidence of dental disease.
The scheme should cover primary dental care services, but not
encompass orthodontic and cosmetic procedures. Participating dental
practices should be encouraged to practice ‘minimum intervention
dentistry’.                                                                   Steps towards a universal scheme
                                                                              The Commonwealth should assume responsibility for funding public
Services delivered under the scheme should have no out-of-pocket              dental care
costs
                                                                              The current system is inequitable across states and territories. Only the
A principal goal of the scheme is to eliminate financial barriers to dental   Commonwealth can adequately fund dental services and ensure equal
care for all Australians. This is best achieved by requiring participating    access for citizens across Australia.
dental practices to charge fees according to an agreed schedule,
without additional payments by patients.
                                                                              The Commonwealth should increase total funding for dental care for
Publicly-funded dental care should be delivered by a mix of public and        people currently covered by state dental schemes
private providers
                                                                              Waiting lists for public dental services are far too long. Most states have
Patients should have choice of dental care providers under the scheme.        median waiting times well above one year. The Commonwealth should
Both public and private providers should be eligible to participate in the    increase funding, to better meet the needs of people who currently use
scheme.                                                                       public dental schemes.

Grattan Institute 2019                                                                                                                                  4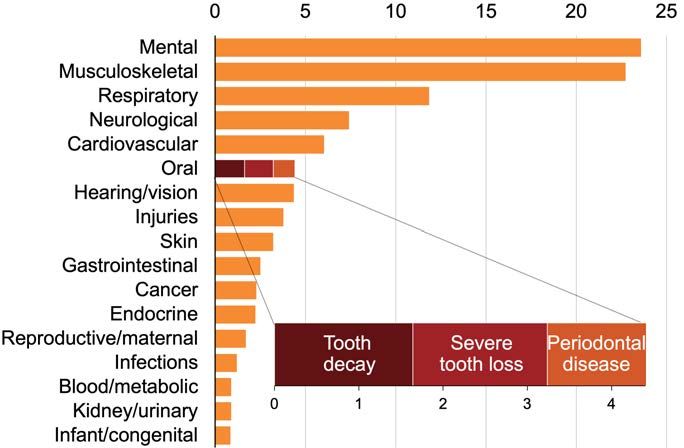
Filling the gap: A universal dental scheme for Australia

The Commonwealth should progressively expand the number of people
covered by the universal scheme
Publicly-subsidised dental care is currently available for some children,
and for adults with a Health Care Card or Pensioner Concession Card.
Access should be broadened in several incremental steps towards
universal coverage.

The Commonwealth should set out a clear roadmap to a universal
scheme
A universal scheme will require significant fiscal investment and
expansion of the oral health workforce. It will also have major
implications for private health insurers. The Commonwealth should
develop a clear roadmap to a universal scheme, including the cost,
timing, and workforce development.

Grattan Institute 2019                                                      5
Filling the gap: A universal dental scheme for Australia

                                                           Table of contents

                                                           Overview . . . . . . . . . . . . . . . . . . . . . . . . . . . . . . . . 3

                                                           1   The way we pay for dental care means some people miss out . . 10

                                                           2   Dental care costs have oral health consequences      . . . . . . . . 18

                                                           3   Oral health problems have broader consequences . . . . . . . . 24

                                                           4   The sorry saga of oral health policy . . . . . . . . . . . . . . . . 27

                                                           5   A universal primary dental scheme for Australia . . . . . . . . . . 39

                                                           6   Steps towards a universal dental scheme . . . . . . . . . . . . . 52

                                                           A Non-cost barriers to dental care . . . . . . . . . . . . . . . . . . 57

                                                           B Transitional workforce issues . . . . . . . . . . . . . . . . . . . . 59

                                                           C The reliability of survey measures . . . . . . . . . . . . . . . . . 64

                                                           D Estimating the cost of a dental scheme . . . . . . . . . . . . . . 66

Grattan Institute 2019                                                                                                              6
Filling the gap: A universal dental scheme for Australia List of Figures 1.1 Most spending on dental care comes out of patients’ pockets . . . . . . . . . . . . . . . . . . . . . . . . . . . . . . . . . . . . . . . . . . . . . . . 10 1.2 About 2 million Australians a year avoid or delay going to the dentist despite needing dental care . . . . . . . . . . . . . . . . . . . . . . . . . . . . 11 1.3 Australians are less likely to visit the dentist than people in many comparable countries . . . . . . . . . . . . . . . . . . . . . . . . . . . . . . . . . 12 1.4 Poorer people skip care due to the cost more often, but people at all income levels skip dental care more than other care . . . . . . . . . . . . . . 13 1.5 Low-income people are more likely to skip care due to the cost within every age group . . . . . . . . . . . . . . . . . . . . . . . . . . . . . . . . . 14 1.6 People with private health insurance are more likely to go to the dentist at every income level . . . . . . . . . . . . . . . . . . . . . . . . . . . . . . 15 1.7 People in their 20s, 30s and 40s are most likely to skip the dentist due to the cost . . . . . . . . . . . . . . . . . . . . . . . . . . . . . . . . . . . . 16 1.8 Cost affects care, even when people do see a dentist . . . . . . . . . . . . . . . . . . . . . . . . . . . . . . . . . . . . . . . . . . . . . . . . . . . 17 2.1 People who go to the dentist regularly have better oral health . . . . . . . . . . . . . . . . . . . . . . . . . . . . . . . . . . . . . . . . . . . . . . . 18 2.2 Oral disorders have a big impact on Australians’ quality of life . . . . . . . . . . . . . . . . . . . . . . . . . . . . . . . . . . . . . . . . . . . . . . . 19 2.3 Dental problems are becoming more common . . . . . . . . . . . . . . . . . . . . . . . . . . . . . . . . . . . . . . . . . . . . . . . . . . . . . . . 20 2.4 Low-income people suffer more oral health problems . . . . . . . . . . . . . . . . . . . . . . . . . . . . . . . . . . . . . . . . . . . . . . . . . . . . 21 2.5 Low-income people have more untreated tooth decay . . . . . . . . . . . . . . . . . . . . . . . . . . . . . . . . . . . . . . . . . . . . . . . . . . . 22 2.6 Poorer people have fewer teeth . . . . . . . . . . . . . . . . . . . . . . . . . . . . . . . . . . . . . . . . . . . . . . . . . . . . . . . . . . . . . . . 22 4.1 State governments’ share of dental spending has been flat since the start of the century . . . . . . . . . . . . . . . . . . . . . . . . . . . . . . . . 27 4.2 Most people are not eligible for publicly-funded dental care . . . . . . . . . . . . . . . . . . . . . . . . . . . . . . . . . . . . . . . . . . . . . . . . 32 4.3 States spend varying amounts on public dental care . . . . . . . . . . . . . . . . . . . . . . . . . . . . . . . . . . . . . . . . . . . . . . . . . . . . 33 4.4 Most people in most states wait more than a year for public dental care . . . . . . . . . . . . . . . . . . . . . . . . . . . . . . . . . . . . . . . . . . 36 5.1 Poorer people visit the dentist less often . . . . . . . . . . . . . . . . . . . . . . . . . . . . . . . . . . . . . . . . . . . . . . . . . . . . . . . . . . . 43 5.2 The number of new dental graduates surged over the past decade . . . . . . . . . . . . . . . . . . . . . . . . . . . . . . . . . . . . . . . . . . . . 49 5.3 More dentists are working part-time within almost every age group . . . . . . . . . . . . . . . . . . . . . . . . . . . . . . . . . . . . . . . . . . . . 50 Grattan Institute 2019 7
Filling the gap: A universal dental scheme for Australia

6.1   Properly funding dental care for currently-eligible people would cost an extra $1.05 billion per year . . . . . . . . . . . . . . . . . . . . . . . . . . . 54

A.1 Cost is the most common reason people skip or delay needed dental care . . . . . . . . . . . . . . . . . . . . . . . . . . . . . . . . . . . . . . . . 57
A.2 Low-income people are more likely to skip dental care because of the cost, but they’re not more likely to skip for other reasons . . . . . . . . . . . 58

B.1   Lots of younger dentists have entered the workforce . . . . . . . . . . . . . . . . . . . . . . . . . . . . . . . . . . . .    .   .   .   .   .   .   .   .   .   .   .   .   .   .   .   . 59
B.2   Dentist numbers are growing, but not fast enough to offset population growth and rising part-time work . . . . . . . .         .   .   .   .   .   .   .   .   .   .   .   .   .   .   .   . 60
B.3   Dentists are switching to part-time work at a greater rate than other medical professionals . . . . . . . . . . . . . . .      .   .   .   .   .   .   .   .   .   .   .   .   .   .   .   . 61
B.4   Australia doesn’t have many dentists . . . . . . . . . . . . . . . . . . . . . . . . . . . . . . . . . . . . . . . . . . . .   .   .   .   .   .   .   .   .   .   .   .   .   .   .   .   . 62
B.5   The number of dental hygienists, therapists, prosthetists and technicians is only just keeping up with population growth       .   .   .   .   .   .   .   .   .   .   .   .   .   .   .   . 63

C.1 The proportion of people avoiding or delaying going to the dentist differs depending on the survey . . . . . . . . . . . . . . . . . . . . . . . . . . . 65

Grattan Institute 2019                                                                                                                                                                             8
Filling the gap: A universal dental scheme for Australia

List of Tables

   4.1   Stop-start Commonwealth dental initiatives . . . . . . . . . . . . . . . . . . . . . .    .   .   .   .   .   .   .   .   .   .   .   .   .   .   .   .   .   .   .   .   .   .   .   .   .   .   .   .   .   .   .   .   . 29
   4.2   Options proposed in the final Report of National Advisory Council on Dental Health        .   .   .   .   .   .   .   .   .   .   .   .   .   .   .   .   .   .   .   .   .   .   .   .   .   .   .   .   .   .   .   .   . 30
   4.3   People eligible for the Commonwealth Child Dental Benefits Schedule . . . . . . .         .   .   .   .   .   .   .   .   .   .   .   .   .   .   .   .   .   .   .   .   .   .   .   .   .   .   .   .   .   .   .   .   . 31
   4.4   Eligibility and out-of-pocket costs vary among states and territories . . . . . . . . .   .   .   .   .   .   .   .   .   .   .   .   .   .   .   .   .   .   .   .   .   .   .   .   .   .   .   .   .   .   .   .   .   . 34

   6.1   Universal coverage should be introduced over ten years, in four phases . . . . . . . . . . . . . . . . . . . . . . . . . . . . . . . . . . . . . . . . 53

   D.1   Steps towards a universal scheme . . . . . . . . . . . . . . . . . . . . . . . . . . . . . . . . . .                  .   .   .   .   .   .   .   .   .   .   .   .   .   .   .   .   .   .   .   .   .   .   .   .   .   . 66
   D.2   How many people are in each population group? . . . . . . . . . . . . . . . . . . . . . . . . . .                     .   .   .   .   .   .   .   .   .   .   .   .   .   .   .   .   .   .   .   .   .   .   .   .   .   . 69
   D.3   What type of services will adults receive when they go to the dentist? . . . . . . . . . . . . . . .                  .   .   .   .   .   .   .   .   .   .   .   .   .   .   .   .   .   .   .   .   .   .   .   .   .   . 71
   D.4   Indicative representative prices for broad service types used to estimate the cost of the scheme                      .   .   .   .   .   .   .   .   .   .   .   .   .   .   .   .   .   .   .   .   .   .   .   .   .   . 72
   D.5   The gross cost of the scheme at different phases . . . . . . . . . . . . . . . . . . . . . . . . . .                  .   .   .   .   .   .   .   .   .   .   .   .   .   .   .   .   .   .   .   .   .   .   .   .   .   . 73
   D.6   The net cost of the scheme over time . . . . . . . . . . . . . . . . . . . . . . . . . . . . . . . .                  .   .   .   .   .   .   .   .   .   .   .   .   .   .   .   .   .   .   .   .   .   .   .   .   .   . 75

Grattan Institute 2019                                                                                                                                                                                                               9
Filling the gap: A universal dental scheme for Australia

1       The way we pay for dental care means some people miss out

Dental care in Australia is expensive. People who can’t afford to pay                    – of all spending on dental care in Australia in 2016-17, dwarfing the
often miss out on care.                                                                  contributions from government and private health insurance.

Australia funds dental care very differently to most other types of health               The heavy reliance on direct spending by patients sets dental care
care. Most dental care in Australia is funded out of patients’ pockets.                  apart from other types of health care. Governments are responsible
By contrast, patients play only a minor role in funding most major                       for most health care spending in Australia. The Commonwealth,
areas of health spending such as hospital care, general practice, and                    together with state and local governments, accounted for about
prescription drugs.                                                                      two-thirds of the $170 billion of health spending in Australia in 2016-17.

Relying so heavily on people funding their own dental care creates
financial barriers to care for a large number of Australians, particularly               Figure 1.1: Most spending on dental care comes out of patients’ pockets
those on low incomes. More than 2 million Australians report that they                   Share of health expenditure by source of funds, 2016-17 (per cent)
avoided or delayed going to the dentist, despite needing care, at least                                                Individuals’                   Private health
                                                                                                                   out-of-pocket costs               insurance funds
once in the past 12 months because of the cost.1 About a fifth of adults
who did go to the dentist report that the cost prevented them from                                        Dental                    58
obtaining the recommended treatment.2                                                                                           Commonwealth                 State &
                                                                                                                               (incl. PHI rebate)          local govts Other
Australians are significantly less likely to visit the dentist each year
                                                                                         Primary health care            11
than people in Canada, the UK, and a range of comparable countries.3                     (excl. dental & medications)
Low-income Australians are particularly unlikely to get dental care,
even when they need it, because of the cost.
                                                                                                 Prescriptions          12
1.1     The way we pay for dental care is different to other kinds of
        health care
Patients pick up the bill for most dental care in Australia.4 Individual                               Hospitals        5
Australians were directly responsible for well over half – 58 per cent
                                                                                                                    0.0      20.0        40.0       60.0       80.0       100.0
1.    ABS (2017a).
                                                                                         Notes: ‘Prescriptions’ refers to ‘benefit-paid pharmaceuticals’. Commonwealth
2.    Chrisopoulos et al. (2015).
                                                                                         spending includes the private health insurance (PHI) rebate, the value of which is not
3.    ABS (2017a), Devaux and Looper (2012) and Eurostat (2017). See Figure 1.4.
                                                                                         included in the PHI funds’ spending totals.
4.    In this report, references to ‘dental care’ encompass care provided by dentists,
      dental specialists, and non-dentist dental professionals.                          Source: AIHW (2018a).

Grattan Institute 2019                                                                                                                                                        10
Filling the gap: A universal dental scheme for Australia
Individuals’ out-of-pocket costs represent only 4.7 per cent of spending
on hospitals, 11.6 per cent of spending on prescription drugs, and 11.4
per cent of spending on primary care such as GP visits, as shown in
Figure 1.2: About 2 million Australians a year avoid or delay going to the
Figure 1.1.5
dentist despite needing dental care
Number of people who needed to see a dental professional at least once in
When people without private health insurance go to the dentist, they the previous 12 months, 2016-17 (millions)
bear the entire cost themselves, unless they are one of the small 12
number to receive services through the public system.6 A little over half
(54.3 per cent) of Australians have private health insurance for general 100% 69%
10
treatment such as dental services.7 People with private insurance still
face significant out-of-pocket costs in addition to their premiums; the 8
insurance fund covers a little over half (54 per cent) of their dental
expenses, on average.8 People with insurance still face significant 6
out-of-pocket costs in addition to their premiums.
4
If people cannot pay for their own dental care, they will either miss 12%
2
out on care, or rely on restricted public schemes that often have long 18%
waiting lists.9 Waiting a long time for dental care can exacerbate
0
existing problems, leading to more expensive, invasive and painful Needed to see a Saw dentist when Delayed or Delayed or
procedures in future. dentist needed skipped dentist skipped dentist
due to non-cost due to cost
reasons
Notes: Figures do not sum to 100 due to rounding. ‘Dentist’ includes oral health
professionals. ‘Due to cost’ category includes people for whom the primary reason for
5. AIHW (2018a). Note: figures relate to recurrent expenditure, not including capital delaying or avoiding care was not cost, but who reported that cost was also a reason in
expenses. their decision. See Appendix A for information about non-cost barriers to dental care.
6. Of 9.2 million people who saw a dental professional in 2016-17, 1.2 million
Source: ABS (2017a).
received public dental care; see ABS (2018a).
7. APRA (2018a).
8. Figure is total dental benefits as a percentage of total dental fees for people with
general insurance in 2017-18; calculation based on figures from APRA (2018b).
Not all individuals with hospital insurance have general insurance.
9. The median waiting time in most states is longer than a year (Productivity
Commission (2019)), although there are problems with the waiting list data that
make it difficult to compare across states (AIHW (2018b)). Public dental services
are discussed more in Chapter 4 of this report.
Grattan Institute 2019 11Filling the gap: A universal dental scheme for Australia
1.2 A lot of Australians are going without dental care because of consultation in 2016-17.14 A little over 7 per cent of people who need
the cost to see a specialist defer or skip care because of the cost, and a similar
proportion of people do not fill prescriptions because of the cost.15 The
The cost of dental care means that a lot of people skip or delay going
proportion of people who report that cost caused them to skip or delay
to the dentist, even when they need care. About 2.05 million Australian
dental care – 18.4 per cent – is far higher than for other types of care.
adults delayed seeing or did not see a dentist10 due to the cost at least
once in 2016-17,11 as shown in Figure 1.2. These people comprised Figure 1.3: Australians are less likely to visit the dentist than people in
18.4 per cent of all Australian adults who needed dental care in many comparable countries
2016-17 – that is, nearly a fifth of Australian adults who need dental Percentage of adults who visited a dentist in the past 12 months, by gross
care don’t get care when they need it. Of the 2.05 million people who national income per capita
delayed or avoided dental care because of the cost, most (1.26 million) 100
Ireland
didn’t see a dentist at all in the year. Cost is by far the most important ●
reason people don’t see a dental professional when they need care.12 Germany ● Denmark
United Kingdom ●
Czech Republic● ●●
Netherlands ●
75 ● Luxembourg Norway
Most consultations with a general practitioner are bulk-billed, meaning
●
Slovakia Iceland ●
●
●
Sweden
Austria
that patients pay no direct cost for the service.13 As a result, only ● Canada
Poland ● Slovenia Finland
662,500 people delayed or skipped going to the GP because of Belgium
●
Croatia ● Estonia Malta ●
●
● France
the cost, comprising just 4.1 per cent of people who needed a GP Latvia ●
●
50 ●● ●
●
Cyprus New Zealand ●
Bulgaria
●
● ● ● ● ●
Australia United States
Greece Portugal Italy ●
Hungary
Lithuania Spain
10. The ABS questionnaire asks about care delivered by ‘dental professionals, ●
Turkey
including dentists, dental hygienists and dental specialists’ (see ABS (2017a)). 25
Dental professionals are referred to as ‘dentists’ in our report, for brevity.
Romania
11. The ABS (2018b) has released summary tables from the 2017-18 Patient ●
Experiences survey that show that 2.1 million people who needed dental care
delayed or avoided care due to the cost, comprising 18.1 per cent of those who
0
needed care. These figures are similar to the 2016-17 survey results. This report 20,000 30,000 40,000 50,000 60,000
uses the 2016-17 figures throughout for consistency, because many of our charts GNI per capita ($US at purchasing power parity)
are based on the microdata from the 2016-17 survey; the ABS has indicated it Notes: ‘Adults’ are those aged 15 and over. European countries’ figures are from 2014;
does not intend to release microdata for the 2017-18 survey. Australia’s figure is 2016-17; New Zealand, Canada and the US are from 2009, the
12. 1.26 million people report that cost was the main reason they did not see a dental latest year for which internationally-comparable data are available from the OECD.
professional when they needed to; the next most common reason was that they
were too busy (598,000). A substantial number of people who give reasons other Sources: ABS (2018a), Devaux and Looper (2012), Eurostat (2017) and World Bank
than cost for delaying or avoiding the dentist also say that cost was a reason (2018).
for their decision, with 2.05 million saying cost was among the reasons. See
Appendix A and ABS (2018a).
13. 86.1 per cent of GP consultations were bulk-billed in 2017-18; see Department of 14. ABS (2017a).
Health (2018a). 15. Ibid.
Grattan Institute 2019 12Filling the gap: A universal dental scheme for Australia
Australians are less likely to go to the dentist in a given year than
people in a range of other rich countries. Fewer than half – 48 per cent
– of Australian adults went to the dentist in the past year. By contrast,
Figure 1.4: Poorer people skip care due to the cost more often, but
64.5 per cent of Canadians and 74 per cent of people in the UK went to
people at all income levels skip dental care more than other care
the dentist at least once in the past 12 months. People who missed or delayed care due to cost at least once in the past 12
months, as a percentage of people who needed care, by equivalised gross
People in richer countries – measured by the gross national income
household income decile
per capita – tend to go to the dentist more often than people in poorer
countries. But people in countries that are as rich as Australia are 30
typically much more likely to go to the dentist. Figure 1.3 shows there’s
only one country – the US – that is at or above Australia’s level of 25
economic development in which people are less likely to go to the Dentist
dentist in a given year. People in other countries with similar income 20
levels as Australia typically go to the dentist substantially more often
than Australians. 15
1.3 Costs are a bigger barrier for low-income people 10
Specialist
An alarming proportion of Australians skip or delay needed dental care
because of the cost. People at all income levels are more likely to skip 5
the dentist than other types of health care, but the cost of care affects GP
low-income people most of all. 0
Lowest Highest
About 8.5 per cent of high-income adults who needed to go to the Household income decile
dentist in the past 12 months report that they skipped or delayed dental Note: Figures are for people aged 15 and over.
care at least once due to cost. The figure for low-income adults is more Source: ABS (2018a).
than three times higher, at 27.9 per cent.16
This makes dental care different from medical care. As shown in
Figure 1.4, low-income people are only a little more likely than
high-income people to skip or postpone needed care from GPs or
specialists due to the cost. And Figure 1.5 shows the ‘social gradient’
for dental care is steep for all age groups.
16. ABS (2018a).
Grattan Institute 2019 13Filling the gap: A universal dental scheme for Australia
About 60 per cent of low-income people did not see a dentist at
all in the past year, with the figure nearly as high among people in
middle-income households. By contrast, most high-income people
Figure 1.5: Low-income people are more likely to skip care due to the
saw the dentist at least once in the past year, with only about 40 per
cost within every age group
cent not seeing a dentist at all over the year. While high-income people People who missed or delayed going to the dentist due to cost at least once
are more likely to have seen a dentist once or twice in the past year, in the past 12 months, as a percentage of people who needed care, by
low- and high-income people are about equally likely to have seen equivalised gross household income decile and age group
a dentist three times or more, a pattern of visitation likely to indicate 15−24 25−34 35−44 45−54 55−64 65+
dental problems. 50
Only 22 per cent of low-income Australian adults have a ‘favourable’
pattern of dental care, meaning that they usually visit a dental 40
professional at least once a year, they have a ‘usual’ dental care
provider, and they usually visit for a check-up rather than to treat a
30
problem.17 By contrast, 56 per cent of high-income Australian adults
have a ‘favourable’ pattern of dental care.18 Nearly half of low-income
adults report that they would have difficulty paying a $150 dental bill; for 20
high-income adults the figure is only 6 per cent.19
Australians with private health insurance (PHI) are much more likely to 10
go to the dentist, and high-income people are much more likely to have
PHI than low-income people. Each year, 57 per cent of people with PHI
see a dental professional; only 31 per cent of people without PHI do so. Low High Low High Low High Low High Low High Low High
The gap in dental attendance rates between people with and without Household income decile
Note: Figures are for people aged 15 and over.
PHI is remarkably consistent across the income spectrum, as shown in
Source: ABS (2018a).
Figure 1.6. The rise in dental attendance rates in higher-income groups
is mostly attributable to the fact that a larger proportion of those people
have PHI.
17. See Rechmann et al. (2018).
18. See Ellershaw and A. Spencer (2011). ‘Low-income’ here refers to adults with
household incomes of less than $20,000 per year, while high-income is $100,000
and over. The figures are adjusted for differences in age and sex between income
groups.
19. Islam and Harford (2010).
Grattan Institute 2019 14Filling the gap: A universal dental scheme for Australia
International research suggests countries that rely heavily on out-of-
pocket costs for dental care have large gaps in dental attendance. A
cross-country study for the OECD, for instance, found that the more
Figure 1.6: People with private health insurance are more likely to go to
a country relies on out-of-pocket spending by patients to fund dental
the dentist at every income level
care, the bigger the gap.20 Proportion of adults who attended the dentist at least once in the past 12
months, by equivalised gross household income decile and PHI membership,
1.4 Costs are more of a problem for women, the middle-aged, 2014-15 (per cent)
people outside cities, and Indigenous people
The cost of dental care has a bigger effect on low- than high-income 60 People
people. Cost also has a disproportionate impact on other groups: with PHI
women, the middle-aged, people living outside metropolitan areas, and
Indigenous people. All
people
40
Women are more likely to skip the dentist than men; 20 per cent of
women who needed to go to the dentist delayed or avoided doing so
due to the cost, compared to 16 per cent of men. Women are more People
likely than men at almost every age group to face financial barriers to without PHI
20
getting dental care when they need it.
Dental costs pose a bigger problem for people aged between 25 and 44
than for older or younger people. Dental care follows a similar pattern
over the life course as other types of care – people in their 20s, 30s 0
Low High
and 40s are the most likely to skip or defer care due to the cost. But Household income decile
in every age group, Australians are more likely to avoid or delay dental Source: ABS (2016a).
care than other types of care, as shown in Figure 1.7
Australians outside the major cities are more likely to report skipping or
delaying dental care due to the cost, although the difference between
geographical areas is surprisingly minor. In the major cities, 17 per cent
of people who needed to see a dentist didn’t do so, or delayed doing
so, due to cost; in regional areas the figure is about 21 per cent.
20. Devaux and Looper (2012).
Grattan Institute 2019 15Filling the gap: A universal dental scheme for Australia
Indigenous people are also more likely to face cost-related barriers to
dental care than other Australians. According to the Commonwealth
Fund’s International Health Policy Survey, 32 per cent of Indigenous
Figure 1.7: People in their 20s, 30s and 40s are most likely to skip the
Australians skipped dental care due to the cost, compared to 21 per
dentist due to the cost
cent of non-Indigenous people.21 Indigenous people may also face non- Proportion of people who needed care, but delayed or did not get care due to
cost barriers to dental care, including the absence in some areas of cost
culturally-sensitive dental practitioners. 30
Sicker people are also more likely to skip or delay going to the dentist
when they need to because of the cost. This trend holds across income 25
levels, but at every level of health status, high-income people are less Dentist
likely to skip care than low-income people.22 20
Anecdotal reports suggest that people with disabilities, people from
culturally and linguistically diverse backgrounds, and people with 15
mental health problems all face additional barriers to dental health care, Specialist
although available data do not allow us to quantify the size of these 10
barriers.
5
GP
1.5 Costs affect care even when people do visit a dentist
0
Even among those people who do see a dentist, the cost of dental
15-17 20-24 30-34 40-44 50-54 60-64 70-74 80+
care can still be a barrier to getting the kind of treatment they need. Age
About a fifth of people – and 28 per cent of low-income people – who
Source: ABS (2018a).
saw a dentist in the past year report that the cost prevented them from
getting the treatment recommended for their condition, as shown in
Figure 1.8.23 A significant proportion of Australians who do go to the
dentist also report that their visits were a large financial burden – and
this isn’t confined to low-income people.
21. Commonwealth Fund (2016).
22. ABS (2018a).
23. Chrisopoulos et al. (2015). The figures refer to adults who retain some teeth.
Grattan Institute 2019 16Filling the gap: A universal dental scheme for Australia
Box 1: What do people mean when they say they need to go Figure 1.8: Cost affects care, even when people do see a dentist
to the dentist? Percentage of people who went to the dentist at least once in the previous 12
months and report a financial barrier or burden
Low-income Australians are much less likely to report that they
30
need dental care. When surveyed, about half of low-income
people said they needed care in the past year, compared to 70
Cost prevented
per cent of high-income people.a recommended
treatment
This may reflect a difference in perceptions of what is meant 20
by ‘needing’ dental care. Focus groups in Canada with people
receiving social assistance have found that low-income people
typically believe that “absence of symptoms means absence
Dental visit(s) in
of illness”.b Unless they have a tooth ache or a visible cavity, 10
past 12 months were a
low-income people often perceive there is no need to go to the large financial burden
dentist. If high-income people are more likely to perceive a need
for a dental visit even in the absence of symptoms, this could
explain differences in the proportion of people who report needing 0
to go to the dentist.c Under $30,000 $60,000 $90,000 Over
$30,000 to $60,000 to $90,000 to $140,000 $140,000
Such a difference in attitudes to the need for dental care across Household income
income groups would mean that the differences in financial Note: The lowest-income group has a household income of less than $30,000 per year;
barriers to care reported in Figure 1.4 and Figure 1.5 understate the highest-income group has a household income of $140,000 or more.
the social gradient in dental care. Source: ARCPOH NDTIS 2013 results reported in Chrisopoulos et al. (2015).
a. ABS (2018a). The trend also holds within age groups.
b. See Bedos et al. (2005) and Bedos et al. (2009).
c. There is insufficient evidence on the extent to which attitudes to the need for
dental care vary across socio-economic groups. See Fox (2010).
Grattan Institute 2019 17Filling the gap: A universal dental scheme for Australia
2 Dental care costs have oral health consequences
The high cost of dental care stops a lot of people getting care when regularly experience less pain and untreated disease and are less likely
they need it. As a result, their oral health is worse than it would be if to suffer socially and psychologically because of poor oral health.25
they could afford regular care.
Figure 2.1: People who go to the dentist regularly have better oral health
Oral health problems are widespread among Australian adults and, at Prevalence of oral health conditions by dental visitation pattern (per cent)
least on some measures, are becoming more common. If there were Fewer than
Gingivitis
fewer financial barriers to dental care, more people would get care 21 teeth
when they need it. Unfavourable pattern
(visits infrequently, usually
for a problem)
People who go to the dentist regularly have better oral health. People Intermediate pattern
on lower incomes are more likely to face financial barriers to regular
Favourable pattern
dental care. They are also more likely to have untreated tooth decay (visits regularly, usually for
a check up)
and fewer teeth, and to have toothache, discomfort with their dental
appearance or difficulty eating certain foods. Moderate/severe Untreated
periodontitis decay
Unfavourable pattern
2.1 Regular dental care leads to better oral health
Intermediate pattern
People with a ‘favourable’ dental attendance pattern have better oral
health than people who visit the dentist less frequently.24 Figure 2.1 Favourable pattern
shows that people with a ‘favourable’ pattern of dental attendance
are likely to have more teeth, less likely to suffer from gingivitis or 0 10 20 30 40 0 10 20 30 40
periodontitis, and much less likely to have untreated tooth decay. Notes: Figures are age-and-sex standardised.
International studies have also found that people who go to the dentist Source: Ellershaw and A. Spencer (2011).
24. People who have a regular dental care provider they visit at least once a year
for a check-up have a ‘favourable’ pattern of dental attendance.Ellershaw
and A. Spencer (2011) There is debate about how often people should have
check-ups, and whether this should vary depending on the patient’s risk of
developing dental disease (see Clarkson et al. (2018); Davenport et al. (2003)).
This report does not advocate a specific time between check-ups, but rather the
alleviation of financial barriers so that Australians can have regular care according
to a clinically-appropriate schedule based on their risk. 25. Afonso-Souza et al. (2007); and W. Thomson et al. (2000).
Grattan Institute 2019 18Filling the gap: A universal dental scheme for Australia
Studies that follow people over time also show that regular dental Regular dental check-ups help prevent oral health problems. Therefore,
care improves oral health. A longitudinal study of babies born in people who can’t have regular check-ups because of the cost can be
Dunedin, New Zealand, in 1972-73 found a statistically significant expected to have more oral health problems.
relationship between dental visitation patterns and various measures
Of course, a broad range of social, economic and cultural factors –
of oral health.26 The Florida Dental Care Study, which observed 873
commonly referred to as the ‘social determinants of health’ – affect
older people over time, also found that regular dental service was
a person’s oral health.33 But the ability to get dental care when it’s
associated with improved dental health, even after taking account of
needed is an overwhelmingly important factor.
other factors.27 And a longitudinal study of 6,346 people in Sweden
similarly found that “long-term routine attendance has positive impact Figure 2.2: Oral disorders have a big impact on Australians’ quality of
on major tooth loss and [oral health-related quality of life]”.28 life
Years lived with disability by disease type, 2011 (per cent of total)
It makes sense that increased dental attendance causes improvements
in oral health. As the Productivity Commission has observed, “many
dental conditions are preventable”.29 If people visit a dentist at least
once a year, they are more likely to receive preventive or arrestive care
and less likely to require extractions.30 The spread of conditions such
as tooth decay can be arrested if treated early. If people don’t have
regular check-ups, their oral health is more likely to degrade to the point
where they require more extensive and expensive treatment. Regular
care can prevent, arrest or minimise oral health problems.31
Recognising this, dental researchers recommend a move away from
surgical interventions and towards ‘minimum intervention dentistry’,
which emphasises early detection and risk assessment of oral
health problems, as well as preventive dental care.32 More ‘minimum
intervention dentistry’ coupled with more frequent visits for people who
need them could improve oral health across the community.
26. Crocombe et al. (2012); and W. M. Thomson et al. (2010).
Source: AIHW (2016).
27. G. Gilbert et al. (2000).
28. Åstrøm et al. (2014).
29. Productivity Commission (2017a).
30. Ellershaw and A. Spencer (2011).
31. Productivity Commission (2017a).
32. See Dawson and Makinson (1992), Sheiham (1994) and Walsh and Brostek 33. See, for example, Guarnizo-Herreño et al. (2017) on the relationship between
(2013). different types of welfare states and oral health.
Grattan Institute 2019 19Filling the gap: A universal dental scheme for Australia
2.2 Oral health problems are widespread in Australia
Many Australians have oral health problems. A clinical survey34 found
more than a fifth of adults (23 per cent) have periodontal disease, about Figure 2.3: Dental problems are becoming more common
a quarter (26 per cent) have untreated tooth decay,35 and that these Proportion of adults who suffered oral health problems, 1994-2013 (per cent)
conditions are more common among low-income people. 30
Oral health conditions rarely kill people, but they reduce quality of life Concerned about
(the so-called ‘non-fatal burden’ of disease). dental appearance
Avoided some foods
Oral conditions were estimated to be responsible for 4.4 per cent of due to teeth
20
the non-fatal burden of disease in Australia in 2011.36 Oral disorders
– including tooth decay, periodontal disease, and severe tooth loss –
were the sixth biggest source of the non-fatal burden of disease, ranked Experienced
above cancer, gastrointestinal problems and injuries (see Figure 2.2). toothache
Oral cancers – not included in the oral disorders category here – are 10
also significant. Regular dental check-ups increase the prospect of oral
cancers being detected early and treated successfully.
In 2013, more than a third of Australian adults (39 per cent) reported
that they had either suffered toothache in the past year, or felt 0
1994 1999 2004 2009 2014
uncomfortable about their appearance because of their teeth, or
Source: ARCPOH NDTIS results reported in Chrisopoulos et al. (2015).
avoided some foods due to their dental health.37 In 2010, 19 per cent
reported that their oral health was either ‘fair’ or ‘poor’,38 whereas only
14 per cent reported that their general health was either ‘fair’ or ‘poor’.39
34. Self-reported measures have been found to be reasonably accurate for oral
health issues such as number of remaining teeth, number of fillings, and whether
a person has prostheses. Self-reports are less accurate for tooth decay and
periodontal disease (see Pitiphat et al. (2002)). For this reason, this report uses
only clinical studies of tooth decay and periodontitis prevalence.
35. Chrisopoulos et al. (2015). ‘Adults’ here means people aged 15 and above.
36. AIHW (2016).
37. Chrisopoulos et al. (2015).
38. Islam and Harford (2010).
39. ABS (2018a).
Grattan Institute 2019 20Filling the gap: A universal dental scheme for Australia
Oral health problems are not only prevalent, but on some measures high-income households, as shown in Figure 2.5. People who go to the
they are increasing. In 1994, 11 per cent of Australian adults said they’d dentist regularly are much less likely to have periodontitis or untreated
suffered toothache in the previous year; by 2013 this had risen to 16 tooth decay.
per cent. The proportion of adults avoiding foods due to their teeth
has also risen, as has the proportion concerned about their dental Figure 2.4: Low-income people suffer more oral health problems
Proportion of adults who experienced oral health problems at least once in the
appearance (see Figure 2.3).40 It’s not clear why dental problems are
past 12 months, 2013 (per cent)
becoming more prevalent.41
40
Concerned about Avoided some foods Experienced
2.3 Oral health problems are more common among low-income dental appearance due to teeth toothache
people
30
Australians are not equally likely to suffer from dental health problems.
Low-income people are nearly three times as likely as high-income
people to avoid some foods because of their teeth, and more than
20
twice as likely to suffer toothache or have concerns about their
dental appearance, as shown in Figure 2.4. Oral health problems are
widespread among Australian adults, but they afflict low-income people
disproportionately. 10
Oral health studies in which dental professionals, following a
standardised protocol, examine and collect linked social survey 0
information on a representative sample of Australians, also find a Low High Low High Low High
striking ‘social gradient’ in oral health. The most recent data show Household income
that 42.3 per cent of adults in low-income households have moderate Note: The lowest-income group has a household income of less than $30,000 per year;
or severe periodontal disease, compared to only 14 per cent in the highest-income group has a household income of $140,000 or more.
high-income households.42 Similarly, the prevalence of untreated tooth Source: ARCPOH NDTIS 2013 results reported in Chrisopoulos et al. (2015).
decay is 35 per cent in low-income households but just 17 per cent in
40. Chrisopoulos et al. (2015).
41. It’s possible that changing social norms have led to more widespread anxiety
about dental appearance. But it is unlikely that changing social norms could have
contributed to rising prevalence of toothache or the avoidance of certain foods.
Another possibility is that the increasing prevalence of some oral health conditions
could be driven by migration.
42. The 2004-06 National Survey of Adult Oral Health, cited in Chrisopoulos et al.
(2015).
Grattan Institute 2019 21Filling the gap: A universal dental scheme for Australia
Figure 2.5: Low-income people have more untreated tooth decay Figure 2.6: Poorer people have fewer teeth
Proportion of adults with untreated tooth decay, 2004-06 (per cent) Average number of missing teeth by age and income, 2013
Moderate or severe Untreated 15−24 25−44 45−64 65+
periodontal disease tooth decay 15
50
●
● ●
40
10 ●
● ●
● ● ●
30 ●
●
●
● ● ●
● ● ●
●
20 ● 5 ● ●
● ● ● ●
●
● ●
10 ● ●
● ● ● ● ●
0 0
Low High Low High Low High Low High Low High Low High
Household income Household income
Notes: The shaded bars are 95 per cent confidence intervals. People in the lowest Notes: The shaded bars are 95 per cent confidence intervals. People in the lowest
income group have a household income less than $12,000 per year; the highest income group have a household income less than $30,000 per year; the highest
income group is over $100,000. income group is over $140,000.
Source: National Survey of Adult Oral Health 2004-06 results reported in Chrisopoulos Source: ARCPOH NDTIS results reported in Chrisopoulos et al. (Ibid.).
et al. (2015).
Grattan Institute 2019 22Filling the gap: A universal dental scheme for Australia
Low-income adults also have fewer teeth, on average, than people with conditions. The presence of financial barriers to dental care has oral
higher incomes. On average, people with household incomes below health consequences.
$30,000 a year are missing 8.6 teeth, whereas people with household
incomes above $140,000 are missing just 3.2 teeth. Among younger
people (aged 15-24) there’s no difference in the average number of
missing teeth for low- and high-income people; but in older age groups
the difference is strikingly large, as shown in Figure 2.6.
Low-income people are more likely to face financial barriers to
obtaining dental care, as shown in Section 1.3. Low-income people
are also more likely to have poor oral health. It is highly likely that the
social gradient in oral health is, in large part, caused by the fact that
low-income people face higher financial barriers to dental care.
Differences in access to care aren’t the only reason low-income people
have worse oral health. On average, low-income people are also more
likely to smoke, and smoking is associated with poor oral health.43
But an Australian study found that “the commonly held view that the
poor oral health of poor people is explained by personal neglect was
not supported in this study”.44 And a related study showed that once
behavioural factors such as smoking and drinking were taken into
account, the social gradient in oral health flattened marginally but
largely remained.45
Reducing financial barriers to dental care, particularly among
low-income people, would enable a larger proportion of Australians to
obtain regular check-ups and early intervention, which would in turn
prevent the development of more serious, painful, and costly oral health
43. For an examination of the relationship between smoking and oral health, see
Csikar et al. (2016).
44. Sanders et al. (2006a).
45. Sanders et al. (2006b). See, also, Dye and Selwitz (2005), who find that the
relationship between periodontal status and socio-economic status (as proxied by
educational attainment) remains large and statistically significant when controlling
for smoking behaviour.
Grattan Institute 2019 23Filling the gap: A universal dental scheme for Australia
3 Oral health problems have broader consequences
Oral health problems are common among Australian adults. These to improve glycaemic control in diabetics, although the effects are
problems have consequences for the individuals affected, in the form short-lived.48
of pain, discomfort and sometimes social isolation.
A meta-analysis of 57 peer-reviewed studies concluded that type 2
Oral health problems also have broader health consequences. Dental diabetes is a risk factor for periodontitis.49 The expected increase in
conditions are a risk factor for other health conditions such as diabetes. diabetes in the coming decades is likely to increase the prevalence of
periodontitis, reversing gains made through a reduction in smoking and
Oral health problems have fiscal consequences – if problems develop better oral health.50
to the point where they require major treatment, that treatment is often
costly and sometimes borne by the taxpayer. A Finnish study, which followed 8,446 people over 13 years, found that
people with a large number of missing teeth had an increased risk of
And oral health problems have economic consequences – if people coronary heart disease, acute myocardial infarction, diabetes, and early
are dissuaded from seeking employment, or employment in particular death.51
fields, as a result of the discomfort or embarrassment associated with
their condition, economic output falls. A Swedish study of more than 7,000 people likewise found that people
with fewer teeth were more likely to die from cardiovascular disease,
Reducing financial barriers to dental care would reduce the prevalence and this remained the case after taking account of their age, gender,
of oral health problems, which would in turn have benefits to and whether they smoked.52 It should be noted, however, that there
Australians’ general health and social wellbeing, as well as economic is not strong evidence to suggest that treatment of periodontitis can
and fiscal benefits. prevent cardiovascular disease from recurring.53
Poor oral health can also affect people’s mental health. The National
3.1 Oral health problems have broader health consequences
Advisory Council on Dental Health noted that “a person whose
Oral health conditions are risk factors for a range of general health appearance and speech are impaired by dental disease can experience
conditions, such as diabetes and cardiovascular disease.46 anxiety, depression, poor self-esteem and social stigma”.54
Evidence shows that periodontitis has a ‘two-way’ relationship with 48. Simpson et al. (2015).
diabetes. Periodontitis can worsen diabetics’ glycaemic control and 49. Chávarry et al. (2009).
increase the incidence of conditions such as end-stage renal disease 50. Preshaw et al. (2012).
51. Liljestrand et al. (2015).
in diabetics.47 Treatment of periodontal disease has been found 52. Holmlund et al. (2010). Some studies have found the evidence of the relationship
between periodontal and cardiovascular disease is less convincing.
46. Jeffcoat et al. (2014). 53. Li et al. (2014).
47. Chee et al. (2013); and Preshaw et al. (2012). 54. National Advisory Council on Dental Health (2012).
Grattan Institute 2019 24Filling the gap: A universal dental scheme for Australia
Better integrating dental care with other forms of primary health People with dental problems sometimes go to hospital emergency
care could yield benefits to both oral and general health.55 For departments. The number of such emergency visits nationally is
example, an Australian study found high rates of undiagnosed diabetes unknown, but a study of the Royal Hobart Hospital found 0.91 per
and hypertension among people diagnosed with periodontitis; the cent of visits to its emergency department in 2012 were due to dental
researchers concluded that “dental practitioners are in a good position complaints, mostly dental abscesses, toothache, and tooth decay.62
to aid in early diagnosis” of these and other health conditions.56 And The number of visits to emergency departments for dental complaints
the AIHW notes that dental practitioners “play an important role” in the could be substantially reduced if financial (and other) barriers to regular
early detection of oral cancer.57 dental care were removed.
An estimated 67,000 potentially preventable hospital admissions are
3.2 Oral health problems have fiscal consequences
due to dental conditions, representing 21.5 per cent of all potentially
A significant number of Australians have dental conditions that could preventable admissions for acute conditions. Dental conditions are the
have been prevented, or reduced in severity, through regular care and second biggest cause of these potentially preventable admissions.63
early intervention. Some of these people ultimately seek pain relief A recent review concluded that preventable hospital admissions could
from their GP or are admitted to hospital for treatment of their oral be reduced through early intervention, improved access to dental care,
conditions. These forms of care are expensive. and improved oral health literacy.64
The National Advisory Council on Dental Health estimated that Of course some hospital admissions, such as for surgical removal of
there are more than 750,000 GP consultations each year for dental wisdom teeth or oral surgery on young children, would not be prevented
problems, with the most common treatment being prescriptions for through regular dental care.65
pain relief medication and antibiotics.58 The cost to taxpayers for
As the Victorian Auditor General has noted, “a preventive approach
these consultations could easily be $30 million per year, plus the cost
to oral health care is widely recognised as the most cost-effective
associated with subsidising any prescribed drugs.59 Other estimates of
approach to improving oral health outcomes”.66
the cost of GP consultations for dental conditions have been an order of
magnitude higher.60 At least some of this cost could be avoided if fewer not include these potential savings in our cost estimates. Future costings by the
Australians faced financial barriers to dental care.61 Commonwealth Government as part of a roadmap to a universal dental scheme
could seek to estimate the size of this cost offset.
55. Balasubramanian et al. (2018). 62. Verma and Chambers (2014).
56. Zhang et al. (2015). 63. AIHW (2017, p. 96).
57. AIHW (2018c). 64. Acharya et al. (2018).
58. National Advisory Council on Dental Health (2012). 65. Some recent research suggests that dental-related potentially preventable hospital
59. 750,000 consultations at the Level B GP Medicare benefit of $37.60 per admissions are disproportionately for people from socio-economically advantaged
consultation is a total of $28.2 million. areas, though the opposite is true for emergency department presentations; see
60. Leeder and L. Russell (2007). Yap et al. (2017).
61. In this report we do not estimate the total fiscal savings that could accrue as a 66. Victorian Auditor General (2016, p. vii). See also Productivity Commission
result of removing the financial barriers to primary dental care. We therefore do (2017b). Note that we do not estimate the share of the cost of dental-related
Grattan Institute 2019 25Filling the gap: A universal dental scheme for Australia
3.3 Oral health problems have economic consequences
Oral health conditions can sometimes cause people to withdraw from
society, either due to chronic pain or anxiety about their appearance.
This can further detract from individuals’ wellbeing – beyond the pain
and anxiety caused by the dental condition itself – and can also impose
a broader economic cost. If people do less paid work, or drop out of the
workforce entirely, economic output falls.
The Australian Research Centre for Population Oral Health earlier this
decade found there were 2.4 million instances of Australians taking half
a day or more off work or study due to dental problems. It estimates the
total economic cost of reduced workforce participation due to dental
conditions at $556 million per year, based on a 2010 survey.67 Other
estimates are of a similar magnitude.68
Reducing the barriers to regular dental care could increase workforce
participation and boost economic output.69
hospital admissions that could be saved through improved access to primary
dental services and do not include this as an offset in our calculation of the fiscal
cost of increased public dental funding.
67. ARCPOH (2012, p. 396).
68. For example, B. Richardson and J. Richardson (2011) use a similar methodology
with different data to arrive at a figure of $660 million per year.
69. Note that we do not include any increase in economic output flowing from
increased workforce participation as a cost offset in our calculation of the fiscal
cost of increased public dental funding.
Grattan Institute 2019 26You can also read