Market Studies Opportunities for the Dutch Life Sciences & Health sector in the United Kingdom - RVO
←
→
Page content transcription
If your browser does not render page correctly, please read the page content below

Market Studies
Opportunities for the Dutch Life Sciences & Health sector in the
United Kingdom

Commissioned by the Netherlands Enterprise Agency

UK
                               England
                               Scotland
                               Wales
                               Northern Ireland

Market Studies
Opportunities for the Dutch Life Sciences & Health sector in the United Kingdom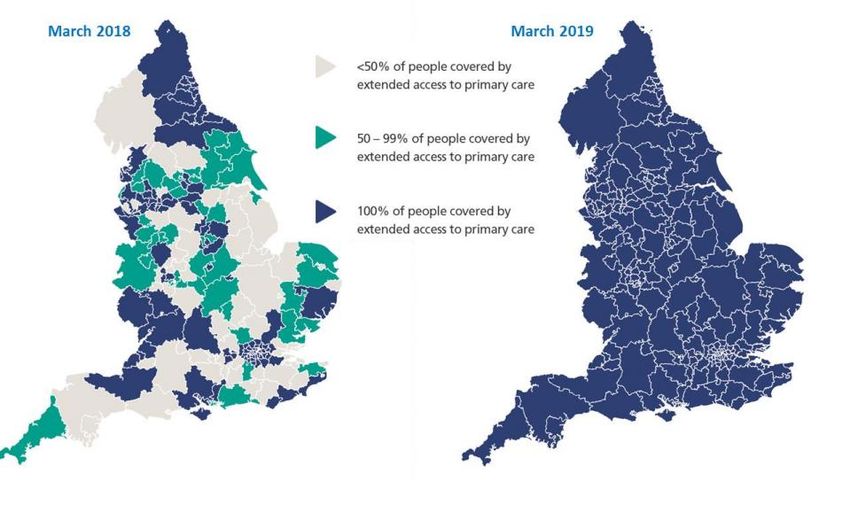
EXECUTIVE SUMMARY

October 2019

This report was commissioned by the Netherlands Business Support Office in
Manchester and the Netherlands Enterprise Agency (RVO.nl) and was produced by the
Task Force Health Care (TFHC) to identify opportunities for the Dutch Life Sciences &
Health sector in the United Kingdom (UK). To this end, TFHC matched the Dutch
supply of solutions for healthcare with current developments in the UK’s health
systems.

To identify the supply of Dutch solutions for healthcare, TFHC held an interest survey
in the Netherlands yielding 90 reactions from Dutch companies, knowledge institutes,
NGOs and governmental agencies.

Based on the views expressed by the respondents, TFHC studied the organisation of
the UK’s health systems, identified the health demand (health challenges) and supply
(services and infrastructure), reported the UK’s 10 year view on health system
development and finally looked at the market entry process in the UK.

As at the time of writing this report the ‘Brexit’ terms have yet to be decided, the
precise implications for international trade are still unknown and therefore are not
studied in depth in this study,

In the view of TFHC, the UK’s health systems and market show many exciting
developments such as an increased health demand due to an ageing population,
announced investments in health infrastructure and a comprehensive approach to the
implementation of digital health. Furthermore the UK’s health systems welcome
international cooperation on the development and implementation of innovative
technologies and services and are working to simplify procurement processes.

After matching Dutch supply with the UK’s demand for solutions, this report identified
opportunities in the Dutch strengths of Hospital Build, Medical Devices, Mobility &
Vitality and eHealth.

                                                                                         2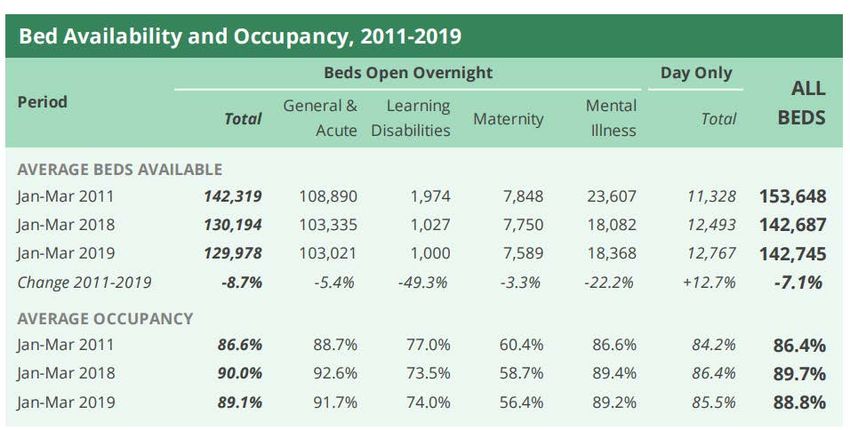
3
TOP REASONS – WHY THE UK IS INTERESTING
            FOR THE DUTCH HEALTH SECTOR

        Growing Market                                                Super Aged Society by 2027

The UK is experiencing a rapid increase in the demand,       By 2027 the number of seniors in the UK will exceed 20%
utilisation, and cost of health services. In order to curb   as a proportion of the total population.         Massive
these increasing health costs, the UK is investing in all    inequalities between the health status of different
facets of its health system, creating demand for smart       income groups persist. These inequalities become more
solutions. See Section 4.                                    pronounced as the population ages, and more people
                                                             seek health services. See Section 2.2

        Health Infrastructure
        Expansions                                                    Consumer Market

Companies that have built NHS hospitals under the            The UK’s consumer market is more interested in health
private finance initiative have made pre-tax profits of      and well-being than ever before. Digitally literate and
£831million over the past six years and are poised to        knowledgeable about health, consumers are already
make almost £1billion more over the next five years.         embracing technology to help maintain fitness and
See Section 5.1                                              prevent illness. See Section 5.2

         Public-Private Health Provision                              Towards Integrated Care

Besides NHS, the UK has an innovative and robust             NHS organisations and local councils in England are
private health sector. The UK is likely to see a             joining forces to coordinate services around the needs
continuation of public/private partnerships to help          of each person living in England. Their aim is to afford
ease the strain on the NHS, while the care home market       people the opportunity to live healthier lives and get
is dominated by private (independent) providers. See         the care and treatment they need in appropriate
Section 5                                                    locations, timeously. See Section 5

         Towards Value-Based Healthcare                                Vibrant Innovation Climate

In 2017, the NHS committed to implementing value-            The UK is a global leader in both R&D and
based healthcare in the UK, pledging resources to            manufacturing of biotech, pharmaceuticals, medical
strengthen the UK’s health information system. See           technology and procedures. Last year alone, the UK
Section 5.4                                                  invested 1.6 billion USD in the development of its Life
                                                             Sciences Sector. See Section 4.3
                                                                                                               4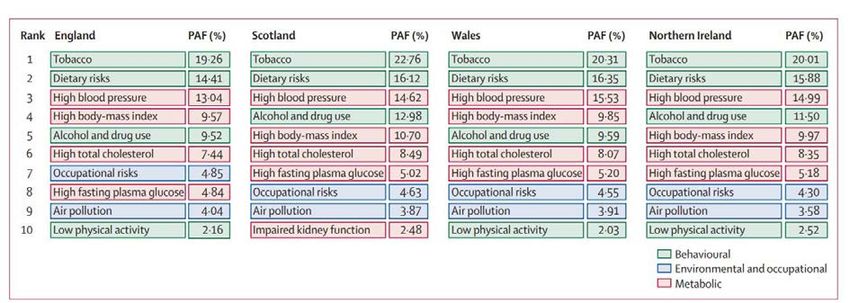
OUR APPROACH

       TASK FORCE HEALTH CARE
       IMPROVING HEALTHCARE TOGETHER
       Established in 1996, Task Force Health Care (TFHC)    Our core mission is to improve healthcare and well-
       is a public-private not-for-profit platform that      being internationally and in a sustainable and
       represents and supports the Dutch Life Sciences &     demand-driven manner, with the use of Dutch
       Health (LSH) sector. Our platform has a reach of      expertise. We are currently actively engaged with
       1,200 LSH organisations in the Netherlands, with      over 20 countries to stimulate and facilitate
       130 dedicated and diverse partners. Our partners      relationships on government-, knowledge- and
       include   government,      industry,   knowledge      business levels. Our partners are active around the
       institutes, NGOs, and healthcare providers.           world and provide innovative and sustainable
                                                             solutions relevant to both global and local
                                                             healthcare challenges.

A PROGRAMMATIC APPROACH                                OUR FOCUS

  Bridging Knowledge, Aligning Interests                    Mutual Interests and Benefits
  and Identifying Opportunities

  Fostering and Strengthening                               Developing Sustainable and Long-Term
  Networks                                                  Approaches

                                                            Demand-Driven and Context Specific
  Facilitating Dialogues on
  Health Themes and
  Opportunities to Collaborate

                                                                                                           5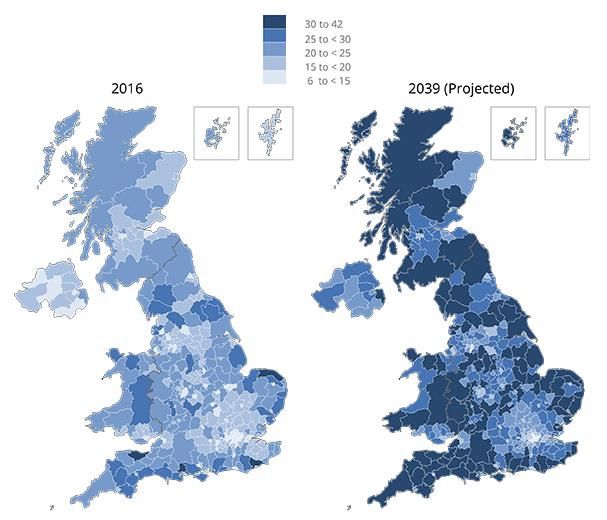
CONTENTS

TOP REASONS – WHY THE UK IS INTERESTING FOR THE DUTCH HEALTH SECTOR ....................... 4

OUR APPROACH .................................................................................................................................... 5

CONTENTS .............................................................................................................................................. 6

LIST OF FIGURES AND TABLES .............................................................................................................. 9

MAPPING DUTCH INTEREST AND ACTIVITY ..................................................................................... 10

SURVEYING THE DUTCH HEALTH SECTOR .............................................................................................. 10

COUNTRY COMPARISON .................................................................................................................... 12

1    THE UK’S HEALTH SYSTEMS ......................................................................................................... 13

1.1 PUBLIC HEALTH SYSTEM: NATIONAL HEALTH SERVICE ..................................................................... 13
NHS GOVERNANCE .................................................................................................................................... 13
1.2 PRIVATE HEALTHCARE IN THE UK ............................................................................................... 14
GOVERNANCE............................................................................................................................................ 14
PRIVATE HEALTH INSURANCE ....................................................................................................................... 15

2    THE UK’S HEALTH STATUS AND CHALLLENGES ......................................................................... 16

2.1 TRENDS IN DEMOGRAPHY ........................................................................................................ 16
2.2 TRENDS IN THE UK’S HEALTH STATUS ......................................................................................... 17
THE UK’S AGEING POPULATION ................................................................................................................... 17
A RISING NON-COMMUNICABLE DISEASE BURDEN .......................................................................................... 18
MENTAL HEALTH DISEASE BURDEN ............................................................................................................... 19

3    THE UK’S HEALTH SERVICES ......................................................................................................... 20

3.1 NATIONAL HEALTH SERVICE ...................................................................................................... 20
NHS INFRASTRUCTURE AND PERSONNEL........................................................................................................ 20
NHS OUTPUT............................................................................................................................................ 23
3.2 PRIVATE HEALTHCARE ............................................................................................................. 25
LONG TERM CARE: A CLOSER LOOK AT THE UK'S CARE HOME MARKET .............................................................. 25

                                                                                                                                                       6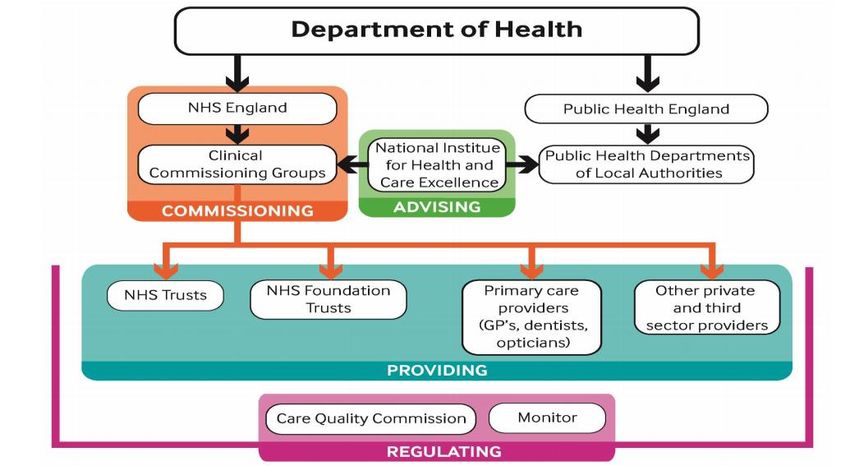
4 TRENDS WITHIN THE UK’S HEALTH SYSTEM ................................................................................ 26

4.1 NHS REFORM: INTEGRATING CARE LOCALLY................................................................................. 26
4.2 NHS FIVE YEAR FORWARD VIEW 2017/LONG TERM PLAN 2019 ...................................................... 27
URGENT AND EMERGENCY CARE .................................................................................................................. 27
PRIMARY CARE .......................................................................................................................................... 27
CANCER .................................................................................................................................................... 28
MENTAL HEALTH ....................................................................................................................................... 28
STRENGTHENING OUR WORKFORCE .............................................................................................................. 29
PATIENT SAFETY......................................................................................................................................... 29
HARNESSING TECHNOLOGY AND INNOVATION ................................................................................................ 29
4.3 STIMULATING INNOVATION IN THE LIFE SCIENCES SECTOR ................................................................ 29

5    OPPORTUNITIES PER DUTCH STRENGTH .................................................................................... 30

5.1 HOSPITAL BUILD.................................................................................................................... 30
MARKET SIZE AND TRENDS .......................................................................................................................... 30
OPPORTUNITIES ......................................................................................................................................... 31
5.1.3 MARKET ENTRY CONSIDERATIONS .................................................................................................... 31
5.2 MEDICAL DEVICES .................................................................................................................. 32
MARKET SIZE AND TRENDS .......................................................................................................................... 32
OPPORTUNITIES ......................................................................................................................................... 32
MARKET ENTRY CONSIDERATIONS ................................................................................................................ 34
5.3 MOBILITY & VITALITY ............................................................................................................. 35
MARKET SIZE AND TRENDS .......................................................................................................................... 35
OPPORTUNITIES PREVENTION: REDUCING RISK FACTORS THROUGH EVIDENCE-BASED PROGRAMMES...................... 35
MARKET ENTRY CONSIDERATIONS ................................................................................................................ 37
5.4 EHEALTH .............................................................................................................................. 37
MARKET SIZE AND TRENDS .......................................................................................................................... 37
OPPORTUNITIES ......................................................................................................................................... 37
MARKET ENTRY CONSIDERATIONS ................................................................................................................ 40

6    ENTERING THE UK’S HEALTHCARE MARKET .............................................................................. 41

6.1 MARKET ENTRY IN THE UK: REGULATORY AFFAIRS .......................................................................... 41
REGISTRATION ........................................................................................................................................... 41
REIMBURSEMENT ....................................................................................................................................... 42
6.2 HOW TO DO BUSINESS WITH NHS .............................................................................................. 42
NHS PROCUREMENT IN ENGLAND ................................................................................................................ 42
NHS PROCUREMENT IN SCOTLAND ............................................................................................................... 43
NHS PROCUREMENT IN WALES .................................................................................................................... 44
NHS PROCUREMENT IN NORTHERN IRELAND .................................................................................................. 44
KEY PURCHASING CONSIDERATIONS WITHIN NHS UK ....................................................................................... 44
6.3 HOW TO DO BUSINESS WITH THE UK’S PRIVATE HEALTHCARE SECTOR .................................................. 45

                                                                                                                                                            7
KEY PURCHASING CONSIDERATIONS ............................................................................................................... 45
USEFUL ORGANISATIONS FOR MARKET ENTRY AND FURTHER INFORMATION........................................................ 45

ANNEX .................................................................................................................................................. 46

ANNEX 1: ORGANISATION OF EACH UK COUNTRY’S HEALTH SYSTEM .......................................................... 46
ANNEX 2: POPULATION PROJECTIONS ................................................................................................. 48
ANNEX 3: BURDEN OF DISEASE ACROSS THE UK .................................................................................... 49
ANNEX 4: TOP 20 CARE HOMES ........................................................................................................ 50
ANNEX 5: HOSPITAL UPGRADES ......................................................................................................... 56
ANNEX 6: MEDICAL DEVICE MANUFACTURERS ...................................................................................... 58
ANNEX 7: ACUTE GLOBAL DIGITAL EXEMPLARS...................................................................................... 59
ANNEX 8: OVERVIEW OF THE HEALTH SYSTEM RESPONSIBILITIES IN THE UK.................................................. 61

SOURCES CITED .................................................................................................................................... 62

                                                                                                                                                         8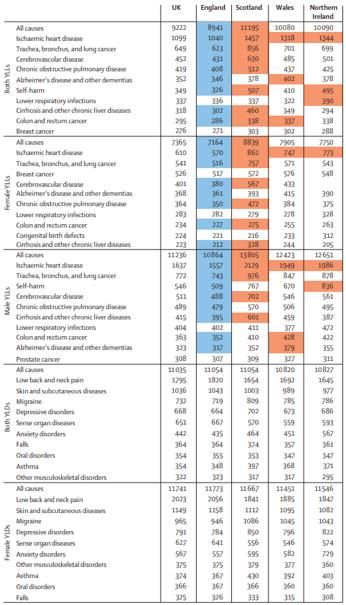
LIST OF FIGURES AND TABLES
Figure 1: Respondents per Strength............................................................................................................................................................. 10
Figure 2: Activity in the LSH sector in the UK ........................................................................................................................................... 10
Figure 3: Do you see growth potential in the UK? ................................................................................................................................. 11
Figure 4: Do you experience market barriers in the UK? ..................................................................................................................... 11
Figure 5: Projected Population Pyramids in the UK ............................................................................................................................ 16
Figure 6: PAF for Risk Factors for All-Cause YLLs rate per 100 000 Population for England, Scotland, Wales, and
Northern Ireland, Both Sexes .......................................................................................................................................................................... 18
Figure 7: UKs proportional mortality caused by NCDs ......................................................................................................................... 18
Figure 8: Number of Grouped Health Conditions by Age, 2016, England ................................................................................... 19
Figure 9: Prevalence of Common Mental Health Problems by Sex) ............................................................................................... 19
Figure 10: Proportion of the Population Aged 65 years and Over and Average Minimum Travel Time for Eight Key
Local Services ......................................................................................................................................................................................................... 20
Figure 11: Hospital activity trends since 2010 .......................................................................................................................................... 23
Figure 12: Roll Out of Extended Access to Primary Care ..................................................................................................................... 28
Figure 13: Gross Fixed Capital Formation in the Health Sector as a Share of GDP, 2016 (or nearest year)) ................. 30
Figure 14 Trends within the UK’s Medical Device Market 2011 – 2021 in USD ......................................................................... 32
Figure 15: Structure of the NHS in England .............................................................................................................................................. 46
Figure 16: Structure of the NHS in Northern Ireland ............................................................................................................................ 47
Figure 17: Structure of the NHS in Scotland ............................................................................................................................................. 47
Figure 18: Structure of the NHS in Wales .................................................................................................................................................. 48
Figure 19: Proportion of the population aged 65 years and over, 2016 and 2039 .................................................................. 48
Figure 20: Age-standardised YLL, YLD, and DALY rates per 100000 population for all causes combined. .................... 49

Table 1: Country Comparison Table ............................................................................................................................................................. 12
Table 2: Past and Projected Numbers (and Percentage Change) of People Aged 65………………………………………………17
Table 3: Bed Availability and Occupancy, 2011-2019 ........................................................................................................................... 21
Table 4: NHS Hospital & Community Health Service (HCHS) Monthly Workforce Statistics ............................................... 22
Table 5: Prominent Private Hospitals in the UK………………………………………………………………………………………………………..25
Table 6: Import Percentages per Medical Device Product Group.................................................................................................... 33
Table 7: Overview of Health System Responsibilities in the UK ....................................................................................................... 61

                                                                                                                                                                                                                        9
MAPPING DUTCH INTEREST AND ACTIVITY
Surveying the Dutch Health Sector
In order to gauge the degree to which the Dutch are interested in the UK’s market, an online survey was sent out to
1.200 unique Life Sciences & Health organisations and companies in the Netherlands. The survey was also shared
with multiple network and cluster organisations in order to extend its reach. Combined data from the survey, Task
Force Health Care, yielded 90 unique respondent organisations with activity and interest in the United Kingdom.
Figures 1- 4 below show the current data available by ‘Strength’, ‘Activity in the UK’, ‘Potential Growth Market’ and
‘Perceived Market Barriers’.
3 2
9
eHealth
30 Medical Devices & Supplies
11 Mobility & Vitality
Hospital Design & Build
Public Health
Biopharma
13
Product Development
22
Figure 1: Respondents per Strength
Which Dutch strengths are active in the UK or have been in the past? In terms of export, research, projects or
otherwise.
59 of the 90 respondents are active in the United Kingdom. The majority of them are medium-sized companies with
the largest group consisting of for-profit companies dealing in medical devices & supplies. This group represents a
diverse mix of solutions mainly consisting of diagnostic equipment, hospital furniture, disposables and a few
suppliers of implants. This group is followed by eHealth supplying a host of solutions aimed at diagnostics and
pathogen detection, health information infrastructure/ exchange, big data and telemedicine. The last bigger groups
mobility & vitality consists of mainly rehabilitation equipment while hospital build companies, are mainly active in
building specific parts (one architect) and public health which represent mainly universities/UMCs and Dutch
development authorities.
2 2
5
Medical Devices & Supplies
18
eHealth
7 Mobility & Vitality
Hospital Design & Build
Public Health
Biopharma
10
Product Development
15
Figure 2: Activity in the LSH sector in the UK
10Which strengths see the most potential in the UK?
61 of 90 respondents see opportunities to grow their activity in the UK. EHealth and medical device companies with
more novel technologies/propositions are most optimistic. Mobility & vitality Hospital Build and Public Health are
the following groups.
2 1
6
eHealth
20 Medical Devices & Supplies
8 Mobility & Vitality
Hospital Design & Build
Public Health
Product Development
11 Biopharma
13
Figure 3: Do you see growth potential in the UK?
Do you experience any market barriers in the UK? Experienced or predicted to encounter.
24
38 Yes
No answer
No
28
Figure 4: Do you experience market barriers in the UK?
38 of 90 respondents foresee or have experienced market barriers in the UK. The most noted barrier experienced
by respondents are the tightly controlled innovation channels by NHS. If a particular technology falls outside of the
current focus, it may be more difficult to achieve market acceptance and/or reimbursement for new technologies.
Many other respondents mention that it can be difficult to identify the right counterparts within NHS and gain
access to them. A less frequent but prevalent remark is difficulty finding business partners/key opinion leaders who
have the right network to influence key decisionmakers in the UK. Lastly the approaching Brexit leads to insecurity
for many respondents: ’’how will it affect my business?’’
11COUNTRY COMPARISON
Table 1: Accumulated data from: World Bank Data (2018), World Health Organisation (2018), Healthdata.org (2019),
BMI Medical Devices reports, IMS Market Prognosis (2016), International Trade Administration (2016).
UK Netherlands Germany France Sweden
Land Size (km²) 243 610 33 690 357 022 643 801 450 295
Population (2019) 66 405 246 17 109 189 80 457 737 67 364 357 10 040 995
expected growth (%) 0.5 0.6 -0.17 0.37 0.8
65 years and older (%) 18 19 22 20 20
expected in 2050 (%) 25.3 28 30 27.8 24.6
Maternal Mortality Rate (100 000
births) 9 7 6 8 4
Life Expectancy at Birth 80.9 81.5 80.0 82 82.2
Healthy Life Expectancy 71.9 72.1 71.6 73.4 72.4
Life Expectancy Global Rank 39 27 37 19 17
Non-communicable diseases 89 90 91 88 90
% chance premature death 11 11 12 11 9
Communicable diseases
Economic Context
GDP (in bln USD) (2017) 2925 826 4199 2856 518
expected growth (2020) 1.4 1.7 1.4 1.4 1.8
GDP per capita (2017) 44 300 48 223 50 500 44 100 51 200
annual growth rate (%) 1.5 2.1 1.1 1.5 1.1
(Health) Business Context
Ease of Doing Business Rank 9 36 24 32 12
Pharmaceutical Market (mln USD-
2016) 45.58 6.61 61.78 36.89 4.64
Expected growth 2016-2021 (%) 51.98 (12%) 6.66 (0.7%) 62.79 (1.6%) 36.68 (-0.5%) 4.95 (6%)
Medical Device Market (mln USD -
2016) 10 529 3486 25 098 13615 2243
Expected growth 2016-2021 (%) 12879 (18%) 3952 (12%) 30 456 (17.6%) 15 957 (14.6%) 2836 (20.9%)
Medical Device Import from
the Netherlands 000s USD (%) 1 473 982 (18%) - 829 178 (4.5%) 479 657 (4.4%) 287 672 (16.6%)
Ranking 1 - 5 5 2
Medical Device Export to
the Netherlands 000s USD (%) 445 287 (7.6%) - 1 659 740 (6%) 1 025 391 (13.3%) 151 825 (9.6)
Ranking 4 - 4 2 3
Health System
Type of Health System National Health Social Health Universal Multi-Payer
Insurance Insurance Health Care System Universal Health Care Universal healthcare
HAQ-score 90.5 96.1 92 91.7 95.5
Health Expenditure (bln USD) 252 97 437 330 67
% of GDP 9.9 10.7 11.2 11.1 11
per Capita (USD) 3958 4742 4714 4263 5710
Public Health Share of HE 83 87 77 78 84
Hospitals 1922 273 3138 3111 81
Hospital beds per 1 000 population 2.8 4.7 8.3 6.5 2.4
Doctors per 1 000 2.81 3.51 4.21 3.23 5.4
Nurses and Midwives per 1 000 8 11 13 9.6 11.5
121 THE UK’S HEALTH SYSTEMS
To understand the UK’s healthcare market, it is important to understand how health services are governed and
provided. The following sections explain the role of the dominant public health system which is provided through
the National Health Service (NHS) and the relatively smaller but growing private healthcare industry.
1.1 Public Health System: National Health Service
Publicly funded healthcare is the dominant healthcare provider in the UK, functioning as the sole provider to
approximately 90% of the UK’s population, and is effectively the main provider of care to almost 100% of the
population. Approximately 8% of the UK population make use of supplemental private healthcare (see Section 1.2).
The NHS is organised according to principles of the “Beveridge Model”, a nationalised healthcare system which is
funded by citizen tax money and delivers care that is free at the point of use (HealthMatters, 2010). The UK’s NHS
differs from traditional single-payer models in that it attributes a larger role to private health insurers and- providers.
More on this in Section 1.2.
NHS Governance
Public healthcare is governed through four different health systems which are overseen by the Department of Health
(England), the Scottish Government (Scotland), the Welsh Government (Wales) and the Northern Irish Government
(Northern Ireland). Each of the four UK administrations are responsible for the governance of their respective health
system, but is accountable to the Prime Minister of the United Kingdom through the Department of Health and
Social Care (DHSC), which takes political responsibility (Bevan, 2014) (Gov.uk, 2019).
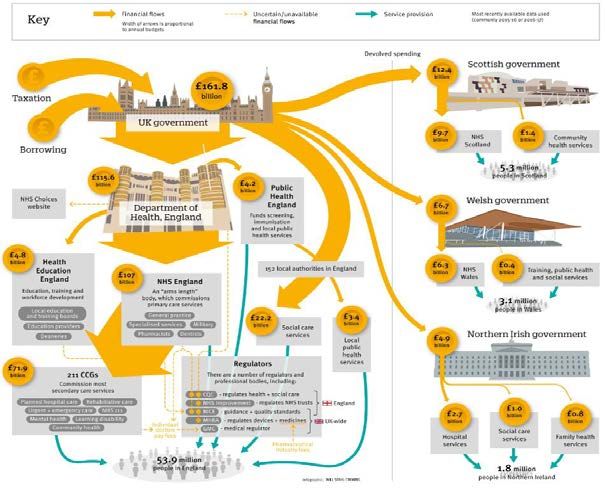
At the central level, Treasury in the United Kingdom allocates funds to the Department of Health (England) which
covers 53.9 million people, the Scottish Government (Scotland) which covers 5.3 million people, the Welsh
Government (Wales) which covers 3.1 million people, and the Northern Irish Government (Northern Ireland) which
covers 1.8 million people (Figure 5). Click on image to enlarge.
Figure 5: Overview of the UK Health and Social Care Funding (BMJ, 2017)
13NHS England is responsible for allocating funding to 211 Clinical Commissioning Groups (CCGs), which together
commission providers within England: NHS Trusts, NHS Foundation Trusts, Primary care providers and other private
and third sector providers (Research Service, 2015). Find a list of all CCG’s here and a list of all NHS trusts here.
Regulation is carried out by NHS Improvement (formerly known as Monitor) and the Care Quality Commission
(CQC), which inspect both public and private health providers. The National Institute for Health and Care Excellence
(NICE) guides and advises NHS England on the adoption of new technologies and drugs in the health system.
Text Box 1: NHS Foundation Trusts
The Health and Social Care (Community Health and Standards) Act 2003 forms the legal basis for the ambition
of the UK to form NHS Trusts in NHS Foundation Trusts. NHS Foundation Trusts were created to devolve
decision-making from central government to local organisations and communities, enabling them to be
responsive to the needs and wishes of local people. Compared to NHS Trusts, Foundation Trusts have more
managerial and financial freedom.
Within NHS Scotland, the Scottish Government’s Health and Social Care Directorate is tasked with helping people
sustain and improve their health. The Directorate delegates responsibility for healthcare to 14 NHS Boards
operating in geographically defined areas. In addition, the Directorate delegates certain responsibilities to seven
Special Health Boards and to NHS National Services Scotland, a body that provides advice and support services to
the NHS Scotland. The Scottish Medicines Consortium guides the prescribing of drugs in Scotland in cooperation
with NICE.
NHS Wales falls under the responsibility of the Minister for Health and Social services and is scrutinised by the
National Assembly for Wales’s Health and Social Care Committee. At the centre of the health system are seven Local
Health Boards (LHBs) and three NHS Trusts. These boards and trusts plan and provide health services to the Welsh
population. The All Wales Medicines Strategy Group guides the prescribing of drugs in Wales.
HSC (Health and Social Care Northern Ireland) falls under the responsibility of the Minister for Health, Social Services
and Public Safety who is a member of the Executive Committee of the Northern Ireland Assembly. The Department
of Health, Social Services and Public Safety has primary responsibility for operating the system in Northern Ireland.
It commissions the health providers, five Health and Social Care Trusts and one nationally operating Ambulance
Trust, through the Health and Social Care Board (HSCB) commissioning and delivering care. HSC follows the
recommendations of NICE.
Find organisational charts for each individual health system in Annex 1.
1.2 Private Healthcare in the UK
Private healthcare runs parallel to the NHS and is used by around 8-11% of the UK’s population, generally as an
add-on to NHS services (The King's Fund, 2014) (Equity Health, 2019) (ABI, 2019). Private health services are provided
through hospitals and are commonly referred to as independent hospitals. Many of these hospitals provide private
health services and are contracted by the NHS to support the public health system.
Governance
All independent hospitals in the UK are regulated by an independent regulator, the Care Quality Commission (CQC)
(Equity Health, 2019). The CQC registers independent hospitals, records their input and outcomes, and inspects and
monitors their services.
14Text Box 2: CQC Care Directory: List of All Health Providers in the UK
Under the Health and Social Care Act 2012, the CQC registers all active locations for providers. This has resulted
in a comprehensive database of 49 418 NHS (as of 1 September 2019) and independent acute hospitals,
ambulance service, GP practices, dentists, and residential social care (nursing homes). View the CQC Care
Directory .
Private Health Insurance
The UK insurance market is the fourth largest in the world (ABI, 2019). Around two-thirds of the total value of this
market stems from life insurance businesses. Different sources allocate different values to the size of the UK private
insurance market, with numbers ranging from USD 11.8 billion to USD 12.7 billion (Wise Guy Reports, 2017)
(Persistence Market Research, 2017). However, most sources agree that the private insurance market should see
growth, with a projected CAGR of 2.6% - 2.8% between the period 2016-2023.
Private health insurance is provided by a consolidated but competitive landscape of health insurers. Some of the
biggest health insurers include: Aspen Healthcare (a subsidiary of Tenet Healthcare), BMI Healthcare, Bupa Cromwell
Hospital, Care UK, Circle Holdings PLC, HCA Management Services, L.P., Nuffield Health, Ramsay Health Care, and
Spire Healthcare Group PLC.
The demand for private health insurance is currently dominated by company-paid subscribers. These account for
approximately 80% of the subscriptions (The King's Fund, 2014). However, this trend is gradually changing as fewer
companies offer medical benefits to employees and private providers begin offering more attractive services
compared to the increasingly pressured NHS (Wise Guy Reports, 2017) (Persistence Market Research, 2017).
To find out more about the workings of private health insurance in the UK read the publication: Health Insurance
Explained (Association of British Insurers).
Text Box 3: How Much Does Private Healthcare Treatments/Procedures Cost?
The prices of treatments and procedures in the private sector vary per provider. To gauge the cost of specific
treatments/procedures a number of providers have set up databases to compare prices:
- Green Private Patient Service at Dorset County Hospital
- Freedom Procedure Payment Guide
- New Victoria Self Pay Packages
- Nuffield Health treatment prices
- BMI Healthcare
152 THE UK’S HEALTH STATUS AND
CHALLLENGES
In order to understand the demands on the UK’s health system it is necessary to understand the health demands
on a population level and through the eyes of an individual patient. The following section highlights different key
data and indicators related to the UK’s health demands.
2.1 Trends in Demography
In the latest official population estimate (2018), the population of the UK reached 66.4 million people, up from 66
million in the previous year. Despite slowing growth rates, the UK population is still expected to grow reaching 72.9
million people by mid 2029 (Office for National Statistics, 2019).
Text Box 4: England Remains the Fastest Growing Population within the UK
The population trends in the four constituent countries of the UK as follows (Office for National Statistics, 2019):
- England's population grew by 358 000 to 56 million (up 0.6% from mid-2017)
- Northern Ireland's population grew by 11 000 to 1.9 million (up 0.6% from mid-2017)
- Scotland's population grew by 13 000 to 5.4 million (up 0.2% from mid-2017)
- Wales's population grew by 13 000 to 3.1 million (up 0.4% from mid-2017)
As is the case in many higher income countries, the UK’s Total Fertility Rate (TFR is the hypothetical average number
of children a woman would have in her childbearing years) has been on the decline. In 2017 the average number of
children per woman was 1.74.
Due to the decreasing TFR and increasing life expectancy, the overall UK population is ageing. In 1998, around one
in six people were 65 years and over (15.9%), this increased to one in every five people in 2018 (18.3%) and is
projected to reach around one in every four people (24.2%) by 2038. Learn more about the implications of the UK’s
ageing population through the Office for National Statistics (ONS): Living Longer: how our population is changing
and why it matters . Find the 65+ year old population projections by subnational area in Annex 2.
Figure 5: Projected Population Pyramids in the UK (Office for National Statistics, 2019)
162.2 Trends in the UK’s Health Status
The health status in the UK is comparable to that of other European and Western countries. The life expectancy (LE)
at birth is 79.2 years for males and 82.9 years for females (Office for National Statistics, 2018). Self-reported healthy
life expectancy (HLE), a subjective measure meaning the proportion of life spent in good health, grew from 62.7 to
63.6 (between 2015-2017) for males and reduced for females from 63.8 (between 2009-2011) to 63.6 (between
2015-2017). Receive the latest stats for the UK’s LE and HLE through the Office for National Statistics .
The UK’s Ageing Population
The most significant trend which impacts healthy life expectancy in the UK, and subsequently healthcare spending
in the UK, is its ageing population. In England alone the UK government projects vast increases in the use of social
care (Table 2) (Government Office for Science, 2016). Currently about a quarter of those aged 65 and over need help
with Activities of Daily Living (ADLs), such as eating, bathing, and dressing. This is projected to increase to 34% of
men and 42% of women at ages 85 years and over (Office for National Statistics, 2019).
Table 2: Past and Projected Numbers (and Percentage Change) of People Aged 65+ using Social Care, by Type of
Care and Funding Sources in England, 2015 and 2035 (Government Office for Science, 2016)
Inequality in access to healthcare persists, with a portion of the UK population not receiving an appropriate level of
care. A strong predictor for the presence of this ’social care gap’ is income; there is an 8% gap between the
percentage of people needing help and those receiving it in the highest income bracket, and a 23% gap in the
lowest income bracket (The Health Foundation, 2017).
Social isolation is also an increasingly prevalent issue in the UK. An estimated 7-17% of the elderly population
experiences loneliness. This is a health issue as individuals with strong social relationships see a reduction of -50%
in mortality compared to lonely elderly citizens.
As a result of ageing, disabilities and other age-related conditions are on the rise. It is estimated that 850 000 people
in the UK have dementia, but only around two-thirds of those have been diagnosed. By 2025, it is estimated that 1
million people in the UK could be living with dementia and by 2050 this could exceed 2 million.
Learn more about ageing in the UK in the following publications: The Government Office for Science: Future of an
Ageing Population and the Centre for Ageing Better: The State of Ageing in 2019 .
17A Rising Non-Communicable Disease burden
The WHO estimates that around 89% of deaths in the UK are caused by non-communicable/chronic diseases (NCD)
and that the risk of premature death by NCDs (for those between the ages of 30-70 years) is approximately 11%
(WHO, 2018). These percentages are expected to rise as the UK’s population ages and more people adopt unhealthy
lifestyles (increase of NCD risk factors). The largest growing risk factor is obesity, whilst smoking and incidence of
raised blood pressure are decreasing in the UK. Unfortunately, the UK scores higher than the global average across
all risk factors.
When zooming in on the prevalence of risk factors in the UK, the population attributable fraction (PAF) (the
proportion of incidents in the population that are attributable to the risk factor) varies slightly between the
constituent countries. Figure 7 shows the PAF per risk factor per country.
Figure 6: PAF for Risk Factors for All-Cause YLLs rate per 100 000 Population for England, Scotland, Wales, and
Northern Ireland, Both Sexes, 2016 (Steel Et. Al., 2018)
The UK’s proportional mortality as a result of NCDs is displayed in Figure 8. The bulk of mortality is caused by
cancers and cardiovascular diseases. Looking at individual diseases, the biggest causes for years of life lost (YLL)
were ischaemic heart disease, lung cancers, cerebrovascular disease, and chronic obstructive pulmonary disease
(Steel et al., 2018). For a full overview of the UK’s disease burden in YLL’s view Annex 3.
3% 1%
8% Cancers
28% Other NCDs
8%
Cardiovascular diseases
Chronic respiratory diseases
Communicable maternal,
perinatal and nutritional
25% conditions
Injuries
Diabetes
26%
Figure 7: UKs proportional mortality caused by NCDs (WHO, 2018)
18As a population ages, the probability of suffering from one or more NCD increases. Figure 9 below shows that a
large proportion of the English population have a chance of suffering from one or multiple conditions.
Figure 8: Number of Grouped Health Conditions by Age, 2016, England (Office for National Statistics, 2019)
Mental Health Disease Burden
Mental health problems are a growing public health concern in the UK. A comprehensive literature review by the
Mental Health Foundation states that nearly half (43.4%) of adults in the UK (roughly 28.8 million people) think that
they have had a diagnosable mental health condition at some point in their life (35.2% of men and 51.2% of women)
(Mental Health Foundation, 2016). The Mental Health Foundation report that 1 in 5 males (19.5%) and 1 in 3 females
(33.7%) have had these diagnoses confirmed by professionals.
Figure 10 displays the most common mental health problems in the UK. The 2013 Chief Medical Officer’s report
estimated that the wider costs of mental health problems to the UK economy are £70–100 billion per year.
Figure 9: Prevalence of Common Mental Health Problems by Sex (Mental Health Foundation, 2016)
Find stats on suicide in mental health (facilities) through the National Confidential Inquiry into Suicide and Safety
in Mental Health
193 THE UK’S HEALTH SERVICES
In order to estimate the effect of an innovative health technology on any particular health system, it is important to
be familiar with the principal health infrastructure as well as the input and output thereof. The following section
provides key numbers on the capacity and workings of the UK’s public and private health system.
3.1 National Health Service
The National Health Service in the UK provides a full-range of care services, ranging from GP’s, urgent and
emergency care and hospital care, to mental health services, opticians, dentist and sexual health services. The
website of NHS England provides an overview of services.
NHS Infrastructure and Personnel
The majority of NHS services are provided by NHS England who oversee 135 acute non-specialist trusts (including
84 foundation trusts), 17 acute specialist trusts (including 16 foundation trusts), 54 mental health trusts (including
42 foundation trusts), 35 community providers (including 11 NHS trusts, 6 foundation trusts, 17 social enterprises
and 1 limited company), 10 ambulance trusts (including 5 foundation trusts), 7 454 GP practices, 853 for-profit and
not-for-profit independent sector organisations (contracted by the NHS), and provide care to NHS patients at 7 331
locations (Textbox 2).
These locations are relatively evenly spread across the UK, mostly corresponding to the population densities of
specific areas. The average time for most persons to reach a GP is 10 minutes by public transport and 8 minutes by
car. To reach a hospital the average time by public transport was 40 minutes, by bicycle it was 35 minutes and by
car it was 20 minutes (Office for National Statistics, 2019).
Figure 10: Proportion of the Population Aged 65 years and Over and Average Minimum Travel Time for Eight Key
Local Services (minutes), 2014, England. (Office for National Statistics, 2019)
20Since 2011, the number of available hospital beds in England has fallen by 12.341, while 1.438 beds have been
converted to “day-only” beds (no overnight stays permitted) (Baker, 2019). There are currently around 142 745
hospital beds available in the UK with an occupancy rate of 89.1%. The occupancy rate is an average percentage
which varies greatly between individual trusts. According to NHS statistics, 56 trusts experienced 95% occupancy,
18 experience between 90% and 95% occupancy, 16 experience between 85%-90% occupancy, and 60 experience
a occupancy rate below 85%.
Table 3: Bed Availability and Occupancy, 2011-2019 (Baker, 2019)
With around 1.5 million employees in England alone, NHS is one of the largest employers in the world (Baker, 2019).
Compared to 2018, the workforce has increased by 2.6% (or 27 612 people). The fastest growing staff groups in the
last eight years are hospital doctors working in emergency medicine (40%), radiology (31%), clinical oncology (29%)
and anaesthetics (22%). The number of nurses has also increased albeit at a slower pace than hospital doctors.
Acute, elderly, and general nurses have seen a 10.1% increase in numbers, while paediatric nurse numbers have
grown by 13.9%. Mental health nurse and learning disability nurse numbers have declined by 9.2% and 34.4%
respectively.
21Table 4: NHS Hospital & Community Health Service (HCHS) Monthly Workforce Statistics: HCHS staff for England by
Main Staff Groups (Baker, 2019)
Positions FTE
Total 1.094.114
Professionally qualified clinical staff 579.448
HCHS doctors 111.950
Consultant 48.127
Associate Specialist 1.939
Specialty Doctor 7.152
Staff Grade 254
Specialty Registrar 29.469
Core Training 11.808
Foundation Doctor Year 2 5.561
Foundation Doctor Year 1 6.252
Hospital Practitioner / Clinical Assistant 520
Other and Local HCHS Doctor Grades 867
Nurses & health visitors 288.851
Midwives 21.670
Ambulance staff 15.776
Scientific, therapeutic & technical staff 141.201
Support to clinical staff 334.698
Support to doctors, nurses & midwives 253.096
Support to ambulance staff 22.309
Support to ST&T staff 59.294
NHS infrastructure support 176.592
Central functions 87.094
Hotel, property & estates 55.050
Senior managers 10.781
Managers 23.667
Find out the latest stats on NHS employees through NHS Workforce Statistics .
22NHS Output
As the main provider of health services to 66.4 million citizens, the NHS sees a lot of traffic each month. Current
figures suggest that every month, the NHS in England alone receives around 1.5-1.6 million first outpatient
attendances monthly (Baker, 2019). GPs make around 1.1 million referrals and there are around 700 000 elective
general and acute (G&A) admissions (80% are day-cases) and 500 000 non-elective G&A admissions. Find out the
latest stats on the NHS’s monthly activity on NHS Hospital Activity .
NHS England strives to achieve its targets for maximum waiting times per category for non-urgent consultant-led
Text Box 5: National Clinical Procedures Benchmarking Tool
The NHS operates a national benchmarking tool which enables CCGs to compare the rates of occurrence for 27
different clinical procedures for their local area. This database provides a valuable resource to learn more on the
frequency of treatments per CCG. Find out more .
Figure 11: Hospital activity trends since 2010 (Baker, 2019)
treatment, which in general is 18 weeks. Waiting time starts when patients are referred to a service or when patients
book a first appointment through the NHS e-Referral Service. Exceptions include a waiting time of 2 weeks for
urgent cancer referrals. Waiting Times for Mental Health Services also vary.
The NHS waiting time target of 18 weeks for 92% of patients has not been met in 2019 (Baker, 2019). Currently 92%
of the patient population wait an average of 22.3 weeks, 4 weeks longer than the target. Approximately 4.2 million
UK citizens are currently on a waiting list for treatment (September 2019), a 42% increase compared to 2014 waiting
list figures. Performance against the 18 week target varies per trust. In March 2019, 20 trusts scored best with a
waiting period of under 13 weeks. The majority of trusts (49 trusts) fall into the 20–24 week category, whilst 39 trusts
have waiting periods of more than 24-weeks.
23Looking at cancer waiting times, 93% of patients met the target of receiving their first consultant appointment within
two weeks of referral. To increase access to health services the UK has now made the requirements for ambulance
response time shorter. The average ambulance response time for life threatening calls (Category 1) is set at 7
minutes and less severe emergency calls are set at 18 minutes (Baker, 2019).
Text Box 6: Comparing Waiting Times of Procedures/Treatments for Individual Hospitals
The NHS e-Referral Service allows users to compare the waiting times for specific surgical procedures at different
hospitals.
Text Box 7: Cancer Waiting Times
For cancer diagnosis, the NHS has set separate requirements for waiting times:
- Urgent GP referrals for cancer (waiting time standard: 14 days from urgent GP referral to first consultant
appointment)
- First treatments for cancer (waiting time standard: 31 days between decision to treat and first treatment)
- First treatments for cancer after an urgent GP referral (waiting time standard: 62 days between GP
referral and first treatment)
243.2 Private Healthcare
The UK’s private health sector is primarily populated by independent GP’s and specialists. There are, however, a
significant number of private hospitals active, mainly in urban areas. These major private hospital groups provide
the full-range of care services. Examples include (Equity Health, 2019):
Table 5: Prominent Private Hospitals in the UK (Equity Health, 2019)
Private Hospital Description
(Group)
HCA Operating 6 hospitals across London and the Christie Private Care Hospital in
Manchester, offering level 2 and level 3 adult intensive care units. These hospitals
are very well equipped for a wide range of health issues and paediatric care.
Nuffield Health Renowned for their physiotherapists, fitness and well-being centres, Nuffield
Health are a not for profit company and operate across the UK.
Spire Healthcare Operating 39 hospitals throughout the UK, operating a wide range of treatments
such as Orthopaedic, Cardiac, Psychotherapist, Fertility, Cosmetic and specialist
Cancer care.
BMI Healthcare
Operating 58 private hospitals across the UK. They provide a comprehensive list of
treatments and handle over 250,000 inpatient and 1,750,000 outpatients each year.
Ramsay Health Operating 33 private hospitals, specialised in weight loss surgery, orthopaedics
and neurological services, which see 200 000 admissions annually.
Circle Health Circle Health provides treatments for a wide range of health issues from General
surgery, rehabilitation, general medicine and much more
CQC, in its latest rating of 206 private acute hospitals concluded that 128 (62%) were rated as “Good” and 16 (8%)
were rated as “Outstanding: (CQC, 2018). However, 62 (30%) were rated in the “Requires Improvement” category.
Strong points of many private hospitals include responsiveness to the needs of patients, and effective and efficient
treatment and leadership. CQC concluded that points of improvement for many independent acute hospitals include
governance, safety culture, and clinical auditing.
Long Term Care: A Closer Look at the UK's Care Home Market
The care home sector in the UK is worth an estimated £15.9 billion a year (CMA, 2017). Around 410.000 residents
reside in 113.000 care homes for the elderly, which are operated by 55.000 different providers. Of the providers,
around 95% are independent. View Annex 4 for an overview of the best rated care homes in the UK by
Carehome.co.uk.
Find out more in the CMA/Gov.UK report: Care Homes Market Study: Summary of Final Report .
254 TRENDS WITHIN THE UK’S HEALTH
SYSTEM
The UK health systems are constantly trying to improve health services for their populations. Priorities set by the
NHS provide opportunities for Dutch Smart Solutions in healthcare. This section provides an overview of the efforts
made by the NHS to improve the UK health system. Section 4 highlights the publications: Next Steps On The NHS
Five Year Forward View (NHS, 2017), in which NHS sets its short-term priorities and reports progress made since
2014, and The NHS Long Term Plan (NHS, 2019) which provides the NHS 10-year vision in terms of the development
of the UK health system. Finally, Section 4 highlights a major investment vehicle through which the UK stimulates
innovation in the domestic Life Sciences & Health Sector.
4.1 NHS Reform: Integrating Care Locally
The NHS recognises that there exists a divide between primary care, community services, and hospitals (NHS, 2017).
This divide is a barrier in terms of providing adequate health services that are both personalised and coordinated
around a patient’s long-term needs. In order to better cater to the emerging and established needs of patients, the
NHS seeks to reform health provision from single and unconnected ’episodes’ of care to networks of care which
integrate prevention, acute care and long term care services.
The Vanguard Programme is the first pilot to explore local care integration, and results seem promising. The
programme has run for two years in 50 CCGs in England, focusing on moving specialist care out of hospitals and
into the community (Multispecialty Community Providers or MCPs). It also works to join up GP, hospital, community
and mental health services (Primary and Acute Care systems or PACS) and create joint healthcare and rehabilitation
services (Enhanced Health in Care Homes). The Vanguard Programme has reduced the growth in number of
emergency hospital admissions and emergency inpatient days compared to non-vanguard CCGs.
The NHS next steps include creating Sustainability and Transformation Partnerships (STP) which function as
collaborative networks to enable integration of care services in specific areas. The goal is to grow STPs into
Accountable Care Systems. By using this bottom-up approach, the NHS hopes to stimulate community participation
and involvement, place the patient centrally, and fine-tune the health system locally.
264.2 NHS Five Year Forward View 2017/Long Term Plan 2019
Urgent and Emergency Care
One of the key challenges of the NHS is that around 1.5 - 3.0 million of the 110 million urgent same-day patient
contacts could have been helped in other parts of the health system. Another challenge is that waiting times in
emergency departments increasingly extend beyond the target of 4 hours due to increasing demands. The NHS is
looking to turn this trend around. A main cause for congestion in UK health infrastructure is the ’Bed Block Crisis’
(Text Box 8). To address congestion, from 2017 onwards hospitals need to implement front-door clinical streaming
to allow for a smoother patient flow and easier transfer between different medical professionals. Furthermore an
extra £1 billion has been invested to: reduce delayed transfers and free up 2000-3000 acute hospital beds, ensuring
that 85% of assessments for continuing healthcare take place outside of hospitals (2018), strengthen mental
healthcare provision at A&E and improve NHS 111 (emergency ambulance) to be a better source for patients who
genuinely need A&E.
Text Box 8: UK’s Bed Block Crisis
The rising demand for health services in the UK, due to an ageing and more vulnerable population, puts
increasing strain on the NHS health infrastructure, which is actually decreasing in size (Section 3.1). As a result
the phenomenon which UK stakeholders call the ‘Bed Block Crisis’ has occurred. The Bed Block Crisis in essence
consists of a undesirable number of patients which are awaiting treatment in both acute and long-term care
due to a high (unnecessary) occupancy of beds/places. Occupancy is deemed unnecessary as many patients
which occupy beds should be able to leave their beds sooner. NHS England stats show that specifically the
availability of places in residential homes, rehabilitation units and smaller community hospitals are lacking.
- Urgent GP referrals for cancer (waiting time standard: 14 days from urgent GP referral to first consultant
appointment)
- First treatments for cancer (waiting time standard: 31 days between decision to treat and first
treatment)
Primary Care
- First treatments for cancer after an urgent GP referral (waiting time standard: 62 days between GP
Improving referral
access toandprimary care services is a top priority of the NHS. To improve access NHS has set out an
first treatment)
investment and reform package between 2017-2020. The most important investments are made in boosting GP
numbers by aiming for 5000 extra GP practices by 2020. This is achieved through the GP Career Plus Scheme and
the Time to Care Programme, which invests 30 million pounds to help practices reduce their workload and the new
NHS GP Health Service which supports doctors suffering from mental ill-health and addiction. Furthermore, by
March 2019 50% of the public should be able to make GP appointments in evenings and during the weekend.
Another major development is that the NHS is encouraging GP practices, community nurses, and mental health and
clinical pharmacy teams to work in hubs or networks in order to facilitate better resource management. As a result,
practices will be able to pool and share staff, materials and equipment.
Lastly, the NHS has set out to modernise primary care premises by investing in upgrading primary care facilities,
having identified 800 infrastructure projects for investment by 2019 (See Section 5.1).
27You can also read