Meeting The Challenge Of Distressed Property Investors In America's Neighborhoods - Alan Mallach
←
→
Page content transcription
If your browser does not render page correctly, please read the page content below
Meeting The Challenge Of
Distressed Property Investors
In America’s Neighborhoods
Alan Mallach
MEETING THE CHALLENGE OF DISTRESSED PROPERTY INVESTORS IN AMERICA’S NEIGHBORHOODS
LISC wishes to thank the Prudential Foundation for sponsoring this paper and generously supporting our
foreclosure response efforts.
Acknowledgements
This report would not have been possible without the generous assistance of many individuals. Emily Bolton
and Andrea Vivero of LISC have been particularly helpful throughout, while Teresa Brice and Theresa Fillon
of LISC Phoenix, Andrea Pereira and Lesley Higgins-Biddle of LISC Connecticut Statewide, and Carla Weil
and Eva Heintzelman of the Greater New Haven Community Loan Fund were invaluable in offering their
insights and facilitating site visits to their communities. Many other individuals in both Phoenix and New
Haven were generous with their time and insights. Adam Gordon of the Fair Share Housing Center, Karen
Black of May 8 Consulting, and above all, Chris Walker, Director of Research and Assessment at LISC,
offered useful comments on the draft of this paper.
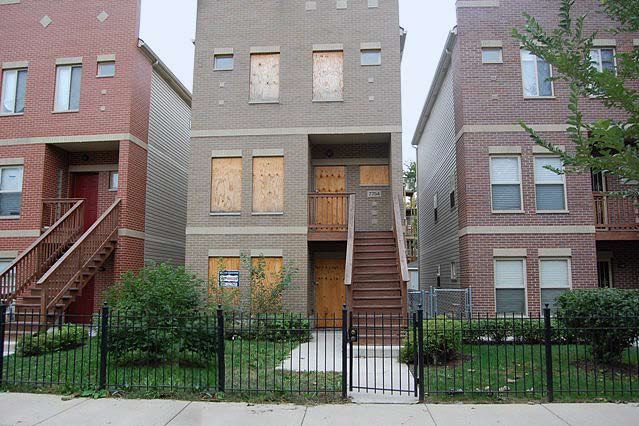
Cover photography by Hubert Newkirk
Report design by Jenny Lederer (www.jennylederer.com)
2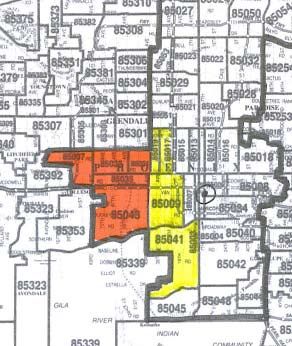
CONTENTS

Table of Contents
introduction					                                                                           5

chapter i     Distressed Property Investor Strategies				                                   9
				                        Investors and Markets							                                    9
				                        Investors and Neighborhoods						                              12

chapter ii    Investors and Markets: Phoenix and New Haven		                               17
 				                       Phoenix                                                        17
 					                              Background							                                      17
 					                              The Investor Market						                              24
 					                              The Bottom Line		                                      28
 				                       New Haven		                                                    31
 					                              Background		                                           32
 					                              The Investor Market		                                  36
 					                              The Bottom Line                                        38

chapter iii Working with Investors: Fostering Responsible Absentee Property Ownership      45
 				                       Introduction                                                   45
 				                       Regulating Investors and Landlords                             47
 				                       Keeping Track of Landlords and Properties                      50
 				                       Establishing Threshold Property Standards                      55
 				                       Maintaining Property Standards Over Time                       58
 				                       Covering Regulatory Costs                                      61
 				                       Imposing Penalties                                             63

chapter iv Building a Stronger Rental Housing Sector Through Affirmative Measures          67
 				                       Encouraging Better Investor and Landlord Behavior              68
 				                       Incentives for Property Acquisition and Improvement		          74

chapter v     Framing and Carrying Out Investor/Landlord Strategies                        79
 				                       Framing the Strategy                                           79
 				                       CDC Roles in Investor Strategies                               83

appendices I       Characteristics of High Foreclosure Zip Codes in Phoenix		              87
              II   Census Tract Characteristics in New Haven 		                            88
              III Good Practices Summary 						                                            90

                                                   3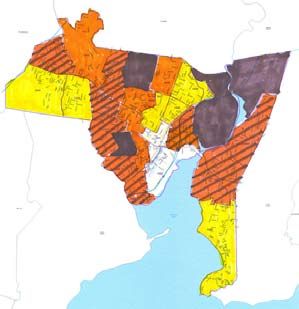
MEETING THE CHALLENGE OF DISTRESSED PROPERTY INVESTORS IN AMERICA’S NEIGHBORHOODS

                                        4
INTRODUCTION
Introduction
The mortgage crisis that has gripped the United States since 2007 has resulted in property owners losing
millions of properties through foreclosure, with a loss of hundreds of billions of dollars in individual and
community assets. Through the foreclosure process, the majority of these properties have been taken back
by the mortgage lender and become ‘real-estate-owned’ or REO properties. For the first year or so after
foreclosures took off in 2007, with lenders unprepared to deal with these properties and few buyers of any
sort in the marketplace, REO properties often went begging. By the end of 2008, however, that was no longer
the case. Private property investors – from “mom & pop” investors buying one or two properties to Wall Street
firms and consortia of foreign investors buying entire portfolios – had moved back into the market in large
numbers.
Since early 2009, the ranks of investors have steadily grown, while it has become less accurate to refer to
them as ‘REO investors’. Rather than waiting for properties to come into lenders’ REO inventories, distressed
property investors – as they are more appropriately known – have been increasingly buying houses through
short sales, buying non-performing mortgages, or bidding against foreclosing lenders at foreclosure sales.
Today, their presence is a major factor in the marketplace of nearly every metropolitan area experiencing large
numbers of foreclosures. Their activities are having a powerful effect on neighborhoods generally and on the
neighborhood stabilization efforts of cities and non-profit community development corporations (CDCs) in
particular. Their effect, however, is a matter of considerable disagreement and even controversy.
The purpose of this report is twofold: first, to offer insight into how distressed property investors operate,
and how their activities affect the neighborhoods in which they are active; and second, to lay out potential
actions by local governments and CDCs seeking to find ways to work more constructively and effectively with
investors in their communities.
5MEETING THE CHALLENGE OF DISTRESSED PROPERTY INVESTORS IN AMERICA’S NEIGHBORHOODS
This report is based on the proposition that cities and CDCs have powerful tools with which to influence the
behavior of distressed property investors, to motivate responsible behavior and discourage activities that do
harm to residents and neighborhoods. Although these tools may be difficult to put into effect, they exist, and
where used effectively, can contribute significantly to the health and vitality of the city’s neighborhoods. To
be most effective, those strategies must combine carrots and sticks – regulations that set minimum standards
and effectively penalize bad behavior, and incentives that reward responsible, conscientious investors and
landlords. As important, the most effective strategies will engage not only local government, but will grow
from partnerships between local government, non-profit organizations, and the residents of the community.
Especially in these days of municipal financial crisis, cities need to enlist their residents and their non-profit
sector as partners if their efforts to address this issue are to succeed.
The report begins with an introduction to the different types of investors and their real estate strategies,
followed by a more in-depth discussion of market conditions and investor activity in two contrasting locations,
Phoenix, Arizona and New Haven, Connecticut. The third and fourth parts of the report explore regulatory
strategies and incentives, or “carrots and sticks,” respectively, which are available to local government and
CDCs, identifying potentially useful ideas and good practices that have emerged in the United States and
elsewhere, and offering specific recommendations for local action. The final section addresses the process
of framing a strategy to deal with investors, and the important role that CDCs can play in a community’s
strategy.
6INTRODUCTION 7
MEETING THE CHALLENGE OF DISTRESSED PROPERTY INVESTORS IN AMERICA’S NEIGHBORHOODS

                                        8
CHAPTER I: DISTRESSED PROPERTY INVESTOR STRATEGIES
Chapter I
Distressed Property Investor Strategies
Distressed property investors vary greatly in size and sophistication, and their goals, strategies and time
horizons as investors vary as widely. Nevertheless, their activities and investment strategies, if far from uniform,
do tend to fall into a small number of distinct categories. The category in which investors in any community
are likely to fit into has much less to do with the predilections or values of individual investors than with the
characteristics of the housing market in which they are operating. While their behavior can be influenced by
local government regulations and by public sector incentives, the effect of those regulations and incentives is
also powerfully influenced by the opportunities created and constraints imposed by the market. To understand
investor behavior, therefore, it is necessary first to understand housing market dynamics.
Investors and Markets
Although it is an oversimplification, distressed property investors can be divided into four broad categories,
shown in Table 1-1.11Rehabbers and holders gravitate toward areas where market prices for distressed properties,
while low enough to enable the investment to be profitable, are still high enough to discourage scavengers. In
order for a rehabber to make a profit, the market price of a well fixed-up house in the area must be greater than
1 These are the categories that are most relevant to the range of market conditions that exist at present. During the height of the housing
bubble, however, a fifth category, the short-term speculator, was common; i.e., individuals gambling on the continued high rate of
appreciation that characterized the bubble years, and buying largely good quality and often newly-built houses with the intention of
holding them one or two years, and selling at a considerable profit. There are few, if any, markets in the United States today in which
short-term appreciation is strong enough to draw this type of speculator; as a result, they have largely disappeared.
9MEETING THE CHALLENGE OF DISTRESSED PROPERTY INVESTORS IN AMERICA’S NEIGHBORHOODS
the sum of his acquisition and rehab costs. This condition exists in some areas but not in others. In many parts
of Detroit, for example, a house that costs $10,000 to acquire and needs another $40,000 to $50,000 in rehab
will not appraise after rehab higher than $30,000 to $35,000. In such a market, a responsible rehabber would
soon go broke, unless he has access to public subsidy funds.
Table 1-1: A distressed property investor typology
category strategy investment goal time horizon
Rehabber Buy properties in poor condition, Appreciation generated Short (usually 1
rehabilitate them and sell them in through ability to realize year or less)
good condition to home buyers or greater increase in value than
other investors. the cost of rehab.
Flipper Buy properties in poor condition and Appreciation generated Short (usually 1
sell quickly (flip) to buyers in as-is or by taking advantage of year or less)
similar condition often using unethical buyer ignorance, providing
or illegal practices. misleading information or
misrepresentation, or
collusion with others.
Milker Buy properties in poor condition for Cash flow generated Short to medium
ver y low prices and rent them out in through disparity between (usually 1 to 3
as-is or similar condition with minimal low acquisition and years)
maintenance, often to problem maintenance costs and
tenants. relatively high market rents.
No expectation of property
appreciation.
Holder Buy properties and rent them out Sum of cash flow during Medium to long
in fair to good condition, usually holding period from rental (usually 5 to 8
following responsible maintenance and income combined with long - years)
tenant selection practices. term property appreciation.
The same is true of holders. For an investor to justify holding a property on a long-term basis and maintaining
the property while realizing a good but unspectacular cash flow, he must realistically expect that the property
will at a minimum maintain its value over time, and have a reasonable probability of appreciating within a
manageable time frame. While some investors are buying to hold indefinitely in order to build a long-term
portfolio, most holders are likely to be operating on the basis of an exit strategy that assumes the property will
be sold, typically within five to eight years.
For a property to work best as an object for medium- or long-term holding, the cost of the property most also
10CHAPTER I: DISTRESSED PROPERTY INVESTOR STRATEGIES
fall within a narrow price range. It must be inexpensive enough so that the investor can realize a positive cash
flow at market rent, but expensive enough so that the full price cannot be quickly amortized through cash flow
alone. This pricing ‘sweet spot’ is not uncommon in the Phoenix market, where investors may be able to buy
single family houses for $60,000 to $90,000, and rent them for $750 to $1,000 per month. Even assuming
relatively high maintenance and operating costs, this is likely to yield the investor an annual return of around
10 percent on her investment. Since there are indications that the Phoenix market may have bottomed out,
the potential for appreciation over the next five years is fairly strong. The New Haven market area offers
similar but higher-risk opportunities, as the best price/rent ratios are found in the city’s two- and three-family
housing stock rather than among its single family properties, which are often overpriced from an investor
perspective. While it is not clear that the New Haven market has yet reached bottom, strong rental demand
along with a local economy and housing market based largely on Yale University’s sustained economic role
mitigate much of the risk to an investor.
On the other hand, conditions in Detroit and similar Rustbelt market areas, are very different. Long-term
appreciation in these markets is seen as unlikely because the prices of distressed properties are too low. From
a pure investment standpoint, as a result, there is less economic justification for pursuing a long-term holding
strategy in the Detroit market, where a property can be bought for less than $10,000, has little realistic
potential for appreciation, and can be rented – even in poor condition – for $600 to $700 per month. Such
properties are more likely to attract milkers, who spend little on maintenance, ignore property tax bills, and
are able to recoup their investment in short order. With few if any expenses to offset rents, their net annual
cash flow could be as high as 70 to 80 percent of their investment.2 After making a quick profit, they are
likely to walk away from the property (which is by this point most probably a total loss) after little more than
two years. Since they are offering a low-quality product and their strategy is not dependent on long-term
preservation of value, milkers have no motivation to be selective with respect to their tenants; unlike holders,
for whom preservation of value is as important as cash flow.
This does not mean there is no opportunity for a responsible investor in these cities. An investor in Detroit
or Cleveland, who brought his properties up to a reasonable standard, maintained them adequately and
paid property taxes on time might be able to realize a positive cash flow. Rents in that city continue to be
high relative to the cost of buying distressed properties. The fact is that investors who do not upgrade their
properties or pay property taxes can make much more money, with substantially less expenditure of their
personal time and energy; in the absence of strong regulation, they are motivated by the economics of the
situation to behave irresponsibly. While there are investors pursuing responsible long-term holding strategies
2 For an investor to adopt milking as his initial strateg y, the anticipated cash flow return needs to be very high. This is
in contrast to the situation some inner-city landlords find themselves in, when they discover that they cannot generate
enough cash flow while maintaining their property and paying their taxes to cover their costs, and decide to milk the
property prior to abandoning it, in order to generate some income during the property’s last years.
11MEETING THE CHALLENGE OF DISTRESSED PROPERTY INVESTORS IN AMERICA’S NEIGHBORHOODS
in these cities, they tend to be the exception rather than the rule.3
Overpaying for a property can also lead to property management practices that, while perhaps economically
rational for the investor in the short run, are irresponsible from other standpoints. If a property is too
expensive, in the sense that the investor cannot realize a positive cash flow while charging responsible tenants
a reasonable market rent and maintaining a decent level of maintenance, the investor will be under pressure
to cut corners in order to create a positive cash flow. Corner-cutting can take place in many ways, including
reducing maintenance, becoming less selective in the choice of tenants, or renting to larger families or non-
family groups than the property can reasonably accommodate without overcrowding; thus being able to
charge higher rent, but at the cost of a potentially highly transient tenantry.
The discussion above focuses on investor strategies with respect to individual properties, or clusters of like
properties. A small investor will only buy properties which he is reasonably certain he can put to profitable
use, unlike large investors who buy a bulk portfolio of properties, particularly in low property value areas.
However, an additional issue, which can be very problematic for a community comes into play when an
investor buying a portfolio is buying ‘blind’ or gambling that while many of the properties in the portfolio
may have little or no value, some will have considerable value and will make up for the worthless ones.4 As a
result, the investor may triage the portfolio and adopt different strategies with respect to different properties,
holding onto those from which they can realize value and writing off and walking away from some low value
properties, particularly those in need of major repair. This may be a rational investment strategy, but it can do
incalculable harm to the neighborhoods in which the properties being written-off are located.5
Investors and Neighborhoods
Whatever the investors’ strategies or business models, their purchases are an important part of the housing
picture in many, if not most, neighborhoods impacted by foreclosures. The volume of properties investors are
buying and the dollars they are spending dwarf the amount being spent in the U.S. Department of Housing and
3 One such responsible long-term investor making major investments in properties in Cleveland’s distressed inner-ring suburbs was
profiled in Investors Business Daily, March 18, 2010. The mere fact that a responsible investor in Cleveland would be considered
worthy of a feature story reflects the extent to which they are a rare breed in that market.
4 The practice of bulk purchasing was widespread in the tax foreclosure area long before the foreclosure crisis, in the course of which
investors learned that if they bought a pool of properties at a deep enough discount, the return from a small number of high-value
properties in such a pool would more than offset writing off as much as 80 to 90 percent of the properties in the pool. While local
governments initially saw bulk sales of tax liens or tax foreclosed properties as fiscally advantageous, many have since come to learn that
the long-term negative consequences of the practice usually far outweigh the short-term benefits.
5 For a vivid description of how this practice is undermining Atlanta’s Pittsburgh neighborhood, see Alyssa Katz, “There Goes the
Neighborhood”, The American Prospect, September 10, 2009.
12CHAPTER I: DISTRESSED PROPERTY INVESTOR STRATEGIES
Urban Development’s Neighborhood Stabilization Program6 and other public sources by cities and CDCs.
Investor activity will inevitably have a powerful impact on the neighborhoods where it is taking place.
It is easy enough to conclude that this activity is having some neighborhood impact, but far more difficult is to
determine what impact it is having. That, in turn, is a function of a number of different factors, some directly
under the investor’s control, and some the product of the interplay between investor activity and other market
and neighborhood dynamics. Three separate potential impacts can be identified:
• Investor activity may lead to the conversion of formerly owner-occupied homes to rental occupancy;
• Investor activity may displace potential homebuyers, thus reducing the number of new homeowners in
the area; and
• Particular investor strategies and property management practices may lead to negative neighborhood
impacts.
Many of the houses investors buy and turn into rental units were formerly owner-occupied. That change may
potentially have a destabilizing effect on the neighborhood, even where the investor is a responsible landlord.
This is difficult to measure, but is generally held to be the case by local officials, CDCs and neighborhood
residents. Given, if nothing else, the significantly more transient nature of tenants compared to home owners,
and research supporting the associations between home ownership and both higher property values and
higher levels of property maintenance, it is a significant issue. The most important thing local governments or
CDCs can do to mitigate this tenure shift in a neighborhood is to prevent foreclosures and help homeowners
hold onto their homes.
Investors cannot be held responsible for the fact that property owners may be losing their homes to foreclosure.
What is a more relevant concern is whether investor activity is also having an effect on the number of new
homebuyers moving into the neighborhood. In order to answer that question, it is necessary to ask what
property outcomes are being displaced by investor purchases; in other words, what would happen to these
properties if investors were not in the market? Would they be bought by homebuyers, or would they remain
empty, and at risk of abandonment? In doing so, it is important to be realistic and avoid evaluating investor
impacts against an unrealistic set of expectations.
The answer to that question is bound to be somewhat speculative, but will, again, reflect the features of each
local market. Many housing market areas have had and continue to have a substantial housing supply surplus,
reflecting the fact that large numbers of REO properties are still being added to the normal volume of houses
6 The Neighborhood Stabilization Program (NSP), enacted in the summer of 2008, provided $3.92 billion to states and local
governments to acquire, rehabilitate or demolish foreclosed, vacant, and abandoned properties, and assist home buyers to acquire REO
properties. This program is now known as NSP1 to differentiate it from a second round of NSP funds appropriated early in 2009,
which added $1.93 billion and allowed funds to be provided to non-profit organizations as well as governmental entities.
13MEETING THE CHALLENGE OF DISTRESSED PROPERTY INVESTORS IN AMERICA’S NEIGHBORHOODS
for sale,7 and that homebuyer demand, although rising, is still constrained by unsettled economic conditions
and buyers’ difficulty obtaining mortgage financing. This would suggest that, in most cases, investors are
taking properties that would otherwise be at high risk of abandonment rather than pushing homebuyers out
of the market.8 If there were fewer investors in the market, cities and CDCs would be unable to pick up the
slack. Fewer investors would mean more abandoned properties.
Here, too, local players have little leverage. While it might be desirable in such cases to take steps to level – or
even tilt – the playing field to favor homebuyers over investors in the purchase of distressed properties, there
are relatively few steps that can be taken at the local level in the area where it counts most, in the property
disposition policies and practices of lenders and servicers. The scope for local action is far greater when it
comes to affecting investor strategies, and their practices on the ground. At the same time, pressure at the
national level to get lenders and servicers to change their policies needs to continue, as well as support for such
projects as the National Community Stabilization Trust.
As noted earlier, the impact of investors on a neighborhood is most powerfully driven by the investor’s choice
of strategy, reflecting, in turn, local market conditions. Of the four strategies shown in Table 1-1, two –
holding and rehabbing – are clearly more neighborhood-friendly than the other two. Investors who perform
responsible rehabilitation and resell properties in sound condition add value and stability to the community.
So do many, although not all, holders; even if their behavior does not align completely with the interests
of the community, they are more likely to respond positively to local government and community pressure
to change, if only because they have a strong financial interest in maintaining the value of their property.
Furthermore, anecdotal evidence from many different communities suggests that these investors sometimes
also provide a useful service by often enabling former homeowners who have lost homes through foreclosure
to remain as tenants in the same neighborhoods.
The strategies of flippers and milkers are more fundamentally in conflict with community interests. Neither
has any real interest in either preserving or enhancing the value of the properties they acquire. Indeed, while
under most circumstances it is better to have investors buy properties than allow those properties to remain
vacant or be abandoned, this is not always the case. In those cities or neighborhoods where most investors are
flippers or milkers, a case can be made that their activities at most delay abandonment for a year or two, while
perpetuating dangerous and unhealthy conditions. In such cases, it might be better to have less investment
and to use public tools to discourage investor buying outright. Before doing so, however, it is important for
local officials and CDCs to explore whether it might be possible to create ground rules that would draw
7 The flow of REO properties slowed down in many markets during 2009. Given continuing high levels of defaults, and a growing
number of properties seemingly stuck in the foreclosure process, there is a strong possibility that it will rise again during 2010 and
2011.
8 Large numbers of properties, moreover, are available to homebuyers in most markets in most price brackets on the conventional (non-
distressed) market, where investors are far less active.
14CHAPTER I: DISTRESSED PROPERTY INVESTOR STRATEGIES
more responsible investors and discourage flippers and milkers, rather than try to discourage investor activity
overall. After all, even in the most distressed markets there are some responsible investors. The same is true of
the ‘triage’ practices of large-scale investors mentioned earlier – potential strategies may be available either to
discourage such transactions entirely, or to change the ground rules so that their effect on the neighborhoods
where the properties are located is less harmful.
We will return to the strategies in the third section of this paper. Before that, we will look more closely at two
areas where investors are active, although under different market conditions – Phoenix, Arizona and New
Haven, Connecticut.
15MEETING THE CHALLENGE OF DISTRESSED PROPERTY INVESTORS IN AMERICA’S NEIGHBORHOODS
16CHAPTER II: INVESTORS AND MARKETS
Chapter II
Investors and Markets: Phoenix and New Haven
Phoenix
The city of Phoenix and its region are widely known for their rapid population growth since World War II.
From a modest population of 107,000 in 1950, the city’s population quadrupled in 10 years to 439,000 in
1960, and reached the one million mark shortly after 1990. In the year 2000 its population of 1.321 million
placed it 6th among all American cities. By 2000, the Phoenix metropolitan area, which is made up of Maricopa
and Pinal Counties and contains seven other cities with populations of 100,000 or more, had a population of
3.25 million people or 64 percent of the state’s population.
Background
Historically, Phoenix was a relatively affordable city. In 2000, the median house value according to the
census was $107,000, or roughly 2.5 times the median household income of $41,207. House prices in the
metropolitan area had increased only modestly during the 1990’s, with an average rate of increase of 3 percent
per year between 1989 and 1999. This changed dramatically after 2000, as prices began to rise at an ever faster
rate, as shown in Table 2-1 for January of each year between 1989 and 2010. Between 2000 and 2006, prices
rose at an average annual rate of more than 14 percent, peaking in mid-2006 at more than double the 2000
price level. The median sale price of existing homes hit $200,000 by March 2005, and had reached $250,000
by February 2006, an increase of 25 percent in less than a year. With median household incomes rising only
14 percent during that period, the median price doubled from 2.5 to more than 5 times the median household
income. Since then, prices have collapsed even more quickly. By January 2010, prices had dropped by more
than 50 percent, back to their 2002 level.
17MEETING THE CHALLENGE OF DISTRESSED PROPERTY INVESTORS IN AMERICA’S NEIGHBORHOODS
Table 2-1: Phoenix Metropolitan Area House Price Index 1989-2010
250
200
price index (2000=100)
150
100
50
1989 1990 1991 1992 1993 1994 1995 1996 1997 1998 1999 2000 2001 2002 2003 2004 2005 2006 2007 2008 2009 2010
year
Source: S&P/Case-Shiller Home Price Index.
The upward spiral of house prices was paralleled by increased new home construction, driven in part by
speculative buying. From 1997 on, over 40,000 building permits were issued each year in Maricopa County,
peaking in 2004 at 55,000. The trend was similar in the city of Phoenix, where permits peaked at 16,600 in
2004. Since the collapse of the bubble, housing construction has all but ceased, with only 1,700 permits issued
in 2009 in Phoenix (Table 2-2). Since the Phoenix area is highly dependent on residential construction as a
source of jobs and economic activity, the drastic contraction in the industry has contributed significantly to
the rise in unemployment and the continuing high level of mortgage foreclosures in the area.
18CHAPTER II: INVESTORS AND MARKETS
Table 2-2: Building permits in Phoenix and Maricopa County 1990-2009
60000
city of phoenix
maricopa county
50000
40000
price index (2000=100)
30000
20000
10000
0
1990 1991 1992 1993 1994 1995 1996 1997 1998 1999 2000 2001 2002 2003 2004 2005 2006 2007 2008 2009
year
Source: Bureau of the Census. 2009 data is preliminary based on sum of monthly reports. Data not available for
city of Phoenix prior to 1996.
Since the surge in mortgage foreclosures that began in the second half of 2006, foreclosures have dominated
the Phoenix real estate market. As Table 2-3 shows, the number of notices of trustee sales rose from 2,165 in
the first quarter of 2006 to 4,866 in the first quarter of 2007, to 15,662 in the first quarter of 2008 and 27,811
in the first quarter of 2009. While the number of trustee sale notices has declined somewhat since then, they
are still at extremely elevated levels. The number of properties pending trustee sale, most of which are likely to
end up in foreclosure, has stayed constant at roughly 50,000 since the middle of 2009.
19MEETING THE CHALLENGE OF DISTRESSED PROPERTY INVESTORS IN AMERICA’S NEIGHBORHOODS
Table 2-3: Notices of Trustee Sale in Maricopa County by Quarter 2005-2010
30000
notices of trustee sale
25000
price index (2000=100)
20000
15000
10000
5000
0
2005/1 2005/2 2005/3 2005/4 2006/1 2006/2 2006/3 2006/4 2007/1 2007/2 2007/3 2007/4 2008/1 2008/2 2008/3 2008/4 2009/1 2009/2 2009/3 2009/4 2010/1
year
year and quarter
Source: The Information Market.
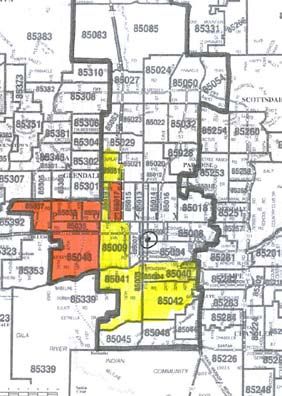
While no part of Phoenix is immune, foreclosures have disproportionately affected areas with low house prices,
which are also lower income and disproportionately Latino areas. Table 2-4 shows the REO transaction share
of total sales during 2009, and the percentage of single family homes pending trustee sale in April 2010, by zip
code and by average 2009 sales price. As Map 1 shows, the most heavily impacted zip codes are concentrated
in the west-central parts of the city. The population of all of the zip codes in the lowest two categories in Table
2-4 is 50 percent or more Latino. Appendix 1 provides a detailed breakdown by zip code.
20CHAPTER II: INVESTORS AND MARKETS
Table 2-4: Foreclosure impact by house price level9
average 2009 number of reo sales as percentage of total percentage of homes
sales price zip codes sales in 2009 pending trustee sale
Under $40,000 4 77.3% 7.4%
$40,000-$49,999 5 75.6% 5.8%
$50,000-$79,999 5 74.1% 5.9%
$80,000-$99,999 5 73.3% 5.7%
$100,000-$199,999 9 53.6% 3.2%
$200,000 and over 9 40.2% 3.3%
Source: AZ Central/The Information Market. Analysis by author.
Map 1: Concentrated foreclosure impacts by zip code in City of Phoenix
6 to 7.9% of homes in zip code
pending trustee sale
Over 8% of homes in zip code
pending trustee sale
Source: Data from The Information
Market. Mapping by author.
9 The overall percentage of single family homes pending trustee sale in Maricopa County was 4.2%. Some outlying areas showed even
higher foreclosure impact levels. The two zip codes with the highest shares of REO properties and houses pending trustee sale were
85353 in Tolleson and 85354 in Tonopah.
21MEETING THE CHALLENGE OF DISTRESSED PROPERTY INVESTORS IN AMERICA’S NEIGHBORHOODS
As foreclosures increased and prices collapsed, the number of resales in Phoenix dropped precipitously.
First quarter sales of existing single family homes dropped from 4,873 in 2005 to 1,454 in 2008. With large
numbers of new homes still being completed, and REO properties coming onto the market in increasing
numbers, realtors’ inventories skyrocketed. In 2005, the local housing market had been a tight one, with
inventories less than one month in the middle of that year. By the beginning of 2007, the inventory had risen
above six months, and by the beginning of 2008 to over 18 months. With prices dropping steadily, buyers
began to return to the market during 2008, but the real change took place during 2009, when prices began, at
least temporarily, to stabilize and the volume of resales returned to 2005 levels.
The increase in sales, however, was concentrated in the city’s low house price/lower income areas. Zip codes where
2009 house prices were over $100,000 actually showed a drop in the number of sales between 2008 and 2009
(Table 2-5). Sales in zip codes where the average price was under $100,000 went from 35 percent of all citywide
sales in 2008 to 64 percent in 2009. As Table 2-4 showed, 3 out of 4 sales in these zip codes were REO sales.
Table 2-5: 2008-2009 change in number of sales by price range
average 2009 sales price in zip code 2008 sales 2009 sales change
Under $40,000 675 2,614 + 287.3%
$40,000-$59,999 1,004 2,900 + 188.8%
$60,000-$79,999 1,355 2,748 + 102.8%
$80,000-$99,999 1,722 3,081 + 78.9%
$100,000-$199,999 2,564 2,512 - 2.0%
$200,000 and over 3,948 3,221 - 13.4%
citywide total 10,180 16,471 + 61.8%
Source: AZ Central; The Information Market. Analysis by author.
As a result of investor demand for low-priced properties, by April 2010 there was little more than a one month
inventory of single family properties selling for under $50,000 in the greater Phoenix area, compared to a 4
to 5 month supply for properties selling for $150,000 to $200,000 and over a year’s supply for houses selling
for over $500,000 (Table 2-6). While some buyers seeking to buy inexpensive houses may be frustrated by
22CHAPTER II: INVESTORS AND MARKETS
investor activity, it is unlikely that many homebuyers are active at the bottom of the price range.10 Investors
may be, however, in direct competition with non-profits seeking to buy houses to rehabilitate with NSP funds
for many of these houses.
Table 2-6: Phoenix inventory of houses for sale (in days) by price range, April 1, 2010
under $25K
$25K-$50K
$50K-$75K
$75K-$100K
$100K-$125K
$125K-$150K
$150K-$175K
$175K-$200K
$200K-$225K
$225K-$250K
price range
$250K-$275K
$275K-$300K
$300K-$350K
$350K-$400K
$400K-$500K
$500K-$600K
$600K-$800K
$800K-$1M
$1M-$1.5M
$1.5M-$2M
$2M-$3M
Over $3M
0 300 600 900 1200 1500
inventory (number of days)
Source: The Cromford Report, based on ARMLS data.
10 Given current mortgage interest rates and the relatively low property taxes in the Phoenix area, a family earning as little as $30,000
per year could most probably qualify for a house selling for $100,000 to $125,000, a segment of the market at which a substantially
greater supply is available. Given the difficulty that families earning less than that are likely to have in obtaining financing, or sustaining
homeownership under any circumstances, one questions how many such families are realistically in the market.
23MEETING THE CHALLENGE OF DISTRESSED PROPERTY INVESTORS IN AMERICA’S NEIGHBORHOODS
The Investor Market
The transformation of the Phoenix housing market since the end of the housing bubble has created an attractive
climate for distressed property investors. While it is impossible to calculate with any precision what number
of percentage of single family purchases are made by investors rather than homebuyers, it is clearly a very large
percentage. Data prepared by DataQuick and shown in Table 2-7 indicates that by spring 2009, investors
made up 45 percent of the Phoenix market.11 A recent newspaper account asserts that “of the 79,000 home
sales that closed in Maricopa County in 2009, a majority were connected to real estate investor activity.”12
Table 2-7: Investor share of sales of existing housing in City of Phoenix 1998-2009
50
40
% of total sales to investors
30
20
10
0
1999/1
1999/2
1999/3
1999/4
2000/1
2000/2
2000/3
2000/4
2001/1
2001/2
2001/3
2001/4
2002/1
2002/2
2002/3
2002/4
2003/1
2003/2
2003/3
2003/4
2004/1
2004/2
2004/3
2004/4
2005/1
2005/2
2005/3
2005/4
2006/1
2006/2
2006/3
2006/4
2007/1
2007/2
2007/3
2007/4
2008/1
2008/2
2008/3
2008/4
2009/1
year
Source: City of Phoenix based on MDA DataQuick.
11 A number of different approaches are used to estimate the number of investor-buyers. Analysts calculate the number of purchasers
who indicate to the county recorder that their ‘intended use’ of the property is as rental housing. That figure is likely to seriously
underestimate the total, since many buyers do not enter anything and, in any event, it is likely that many who do, do not fill it out
accurately. Another approach is to identify buyers who indicate that the address to which the property tax bill should be sent is other
than the address of the property. That may overestimate the total, since a non-negligible percentage of buyers in the Phoenix market are
buying second or vacation homes, and having the tax bills sent to their primary residence. Identifying cash buyers is equally inaccurate,
because some homebuyers in today’s mortgage market are buying with cash, and many investors obtain financing. In the final analysis,
one must look at all of these indicators and make an educated guess.
12 J. Craig Anderson, “Real estate investors propped up Phoenix-area housing in 2009,” The Arizona Republic, March 21, 2010.
24CHAPTER II: INVESTORS AND MARKETS
The dynamics of the Phoenix market favor investors. Although the number of REO sales has dropped from a
high of 71 percent of all sales in the city of Phoenix early in 2009 to roughly 40 percent in early 2010, the drop
in REO sales reflects less conventional sales growth than an increase in short sales and in third party purchases
at trustee sale (Table 2-8).
Table 2-8: Trends in distress sales in Maricopa County 2009
80
70
60
50
% of transactions
reo sales
40
short sales
3rd party trustee sales
30
20
10
0
1 2 3 4 5 6 7 8 9 10 11 12
month
Source: ARMLS and the Cromford Report. While REO sales and short sales are expressed as percentages of total
sales, third party purchases are expressed as a percentage of trustee sales.
Starting early in 2009, the number of trustee sales where the property was sold to a third party rather than
taken back by the bank began to rise steadily, going between February and August from 4 percent to 21 percent
25MEETING THE CHALLENGE OF DISTRESSED PROPERTY INVESTORS IN AMERICA’S NEIGHBORHOODS
of all properties sold at trustee sale. Since August 2009, the third party buyer rate has remained at or above 20
percent. Between August 2009 and March 2010, 7,400 properties in Maricopa County were diverted through
this means from the REO process, nearly all of which were most probably bought by investors.13 During the
same period short sales also rose, going from 8 percent of all sales or roughly 400 sales in Maricopa County in
December 2008 to 23 percent of all sales and 1,500 sales in December 2009. Investors are not only still buying
REO properties and buying properties at trustee sales,14 but also increasingly buying properties through what
might be characterized as “induced short sales.” Rather than wait for owners to list their properties as short
sales through brokers, investors (or entities acting on their behalf ) approach owners in pre-foreclosure, and
arrange a short sale transaction in which they will become the purchaser.
This can be a good strategy for the homeowner and the neighborhood as well as the investor. As a Canadian
investment company’s news release reads, “CBI group will negotiate short sales directly with banks on behalf
of the homeowner. Homeowners will have the option to remain in their homes as tenants, paying a monthly
rent that is significantly lower than their mortgage payment.”15 Homeowners will be given the opportunity to
rebuild their credit rating, and ultimately have the opportunity to buy their house back after five years, when
CBI plans to sell.
A variation on this model is the Housing Angels program, initiated by RealCore Realty and largely financed
by Canadian investors.16 RealCore negotiates short sales on behalf of the owner and takes title to the property.
The owner puts $3,000 into a broker trust account, and enters into a lease with a three year option to purchase
the property back. The purchase option allows him or her to buy back the house at the short sale price plus 10
percent compounded annual interest. Thus, if the short sale price is $120,000, the owner can buy the house
for $132,000 after one year, $145,200 after two years, or $159,720 after three.17
It is likely that the majority of REO buyers, along with a substantial share of the short sale buyers, are investors.
13 A small number of third party buyers may be homebuyers, but, given the highly competitive nature of the process, the number is
likely to be very small.
14 The rise in third party buying at trustee sales reflects the increasing use of what are known as “drop bids” by lenders, where they
reduce the minimum amount of the property’s auction price, reflecting their willingness to accept a bid that may be significantly below
the amount owed on the mortgage.
15 “CBI Group launches foreclosure assistance program in Phoenix, AZ” release dated November 4, 2008.
16 Although there is no way to quantify the amount involved, it is clear that a large part of the investment in distressed properties in
Phoenix is coming from Canada. Many Phoenix area realtors actively market properties to Canadian investors.
17 The program will also allow the former owner to move into another property owned by the investor group and enter into a similar
lease-purchase agreement on that property. It is hard to tell whether this is likely to be an appealing proposition for the former owner.
While it is highly unlikely that Phoenix area properties will appreciate at anything close to a 10 percent annual rate during the next few
years, it might still be an attractive proposition if the purchase terms are more reasonable and the transaction costs low.
26CHAPTER II: INVESTORS AND MARKETS
Data prepared by The Information Market for Arizona Central and tabulated by the author indicates that
there were 13,445 REO sales during 200918 for an aggregate total sale price of almost exactly $1 billion.
Assuming that two-thirds of these sales were to investors, and that investor purchases were weighted toward
lower-priced units, that would yield roughly 9,000 investor purchases in the City of Phoenix during 2009,
investing an aggregate dollar amount of $500 to $600 million.
Investor purchases are likely to be concentrated in a small number of zip codes. REO sales during 2009
exceeded 9 percent of the total number of single family homes in six zip codes shown on Map 2. These closely
match the impacted zip codes shown in Map 1. REO sales in those six zip codes accounted for 5,200 sales or
nearly 40 percent of the citywide total. Five additional zip codes in which REO sales were over 5 percent of
the number of single family homes accounted for an additional 3,000 REO sales in 2009. These are the areas
in which the most concentrated investor activity is taking place.
Map 2: Concentrated REO sales 2009
2009 REO sales between 5% and 9%
of single family homes in zip code
2009 REO sales exceed 9% of
single family homes in zip code
Source: Data from The Information Market.
Mapping by author.
18 This figure, which was obtained by summing separate zip code totals available at http://www.azcentral.com/realestate/homevalues/
homevalues.php, appears high, however, compared to other tallies for the same period.
27MEETING THE CHALLENGE OF DISTRESSED PROPERTY INVESTORS IN AMERICA’S NEIGHBORHOODS
The Bottom Line
The effect of distressed property investors in Phoenix as of early 2010 appears to be more positive than negative,
but with potentially significant risk factors in play. Whether the effect of investors continues to be positive
will depend both on market factors, and the manner in which the city as well as the non-profit community
address their presence.
The most important role that investors have played is that of absorbing the oversupply of houses in the
Phoenix market. This has helped stabilize prices, and even more importantly, has reduced the extent to which
foreclosures have led to long-term vacancy and abandonment. The sheer volume of properties that have
been absorbed by investors during the past year vastly exceeds the number that could have been absorbed by
homebuyers, or by the city and its non-profit partners using NSP funds. In addition, investors have operated
as something of a haven for many owners who have lost their homes, allowing them and their families often to
continue to live in comparable housing conditions in the same or a similar neighborhood. This may well have
mitigated at least some of the social impact of the foreclosure crisis in the Phoenix area.
There is also reason to believe that many, and arguably most, of the investors in the Phoenix market are
responsible investors at a basic threshold level; that is, that they have a reasonable concern for maintaining
the value of their property in order to benefit from potential future appreciation. Rent levels, while adequate
at present to provide for a reasonable cash flow, are not adequate to provide for short-term amortization of
the purchase price, except perhaps in some of the city’s poorest areas. Table 2-9 provides a price/rent and cash
flow analysis for a range of Phoenix investors, based on representative sales prices and rents for modest and
mid-range 3 bedroom houses in the city.19 Were it not for the investors’ expectation of appreciation, the level
of cash flow shown in the table – except for the low-end unit – would most probably not be large enough to
draw the level of investor activity that has been taking place.
19 In contrast to New Haven, where we have also calculated cash flow based on the HUD Fair Market Rent, the number of vouchers
as a percentage of the Phoenix rental pool is much smaller, and efforts to find voucher holders do not appear to be a significant part of
the investor strategy in Phoenix.
28CHAPTER II: INVESTORS AND MARKETS
Table 2-9: Return from rental ownership for representative properties in Phoenix
low-end low-mod moderate
Purchase price $40,000 $68,000 $90,000
Bedrooms 3 3 3
Repairs $10,000 $ 5,000 $ 5,000
Total cost $50,000 $73,000 $95,000
Monthly rent $695 $795 $995
Annual gross rent (less 10% vacancy) $7506 $8586 $10746
Property taxes $560/yr $950/yr $1260/yr
Op. & maint. $1200 $1500 $1800
Net income/ dwelling unit/year $5746 $6136 $7686
Net income as % of cost 11.5% 8.4% 8.1%
Source: Analysis by author based on representative prices and rent levels.
Since they expect appreciation, most Phoenix investors are more likely to be in my terminology holders rather
than milkers. That does not mean, as will be discussed below, that there are no problem investors, or that there
are no market conditions in the city that might trigger irresponsible investor behavior. It does mean that most
Phoenix investors are likely to respond to sensible regulations and incentives.
The first problem is the stability of the rental market itself. The influx of investors has expanded the rental
inventory at a time where there is little net population growth taking place. While some of this inventory has
been filled by former homeowners displaced by foreclosures, much of it has absorbed demand that would
otherwise have been filled by the city’s multifamily housing inventory, as tenants have found that they can rent
a 3 bedroom single family house for little more than a modest 2 bedroom apartment. Economic conditions
in the multifamily rental sector, particularly in the city’s many modest garden apartment complexes, are dire,
with weak cash flows and untenably high vacancy rates the rule.20 Apartment owners are lowering their rents
– either through incentives or outright reductions in monthly rents – or offering other concessions in order to
compete with the single family inventory. By mid-2010, many garden apartment units, both 1 and 2 bedroom
apartments, were renting for less than $500 per month.
20 One observer commented to the author that the only reason most of the city’s garden apartment complexes have not been foreclosed
is that “the banks don’t want them,” while another estimated the vacancy rate in those complexes at over 25 percent.
29MEETING THE CHALLENGE OF DISTRESSED PROPERTY INVESTORS IN AMERICA’S NEIGHBORHOODS
These problems may not be unique to the multifamily market. According to market analysis firm RealFacts,
rent levels in the Phoenix area dropped by nearly 9 percent from the third to the fourth quarter of 2009 to $695
per month,21 while evidence from the fall of 2009 suggests that some investors were having difficulty finding
or holding responsible tenants. One realtor was quoted saying “landlords are lowering the bar on screening
tenants and taking deposits. Homes are being wrecked, and landlords stuck with big cleanup fees. It’s hard to
make money on rentals now.”22 At the same time, Tom Ruff of The Information Market finds credible evidence
that between the fall of 2009 and the spring of 2010 the rental market has appreciably tightened.23
It is difficult to draw conclusions about future trends in the rental market, which are heavily dependent on
broad economic as well as real estate market trends. While it is possible that the number of new foreclosures
is declining, the volume of properties in the foreclosure process is such that the supply of REO properties,
trustee sales and short sales will remain elevated for some time to come. Many of the displaced homeowners
will become part of the market for single family rental houses, but others will double up or move out of the
area. While more of the houses coming on the market will be absorbed by homebuyers and in-migrants if the
economy improves, the consensus of economic forecasts24 is that although there will be some gains in the local
economy during 2010, employment will continue to decline in the Phoenix area throughout the year and only
begin to grow again in 2011.
Market recovery may be further slowed down by the potential collateral effects of Senate Bill 1070, Arizona’s
harsh legislation against undocumented immigrants. Even before the bill went into effect at the end of July
2010, evidence of a declining immigrant presence in many Phoenix neighborhoods was already beginning to
accumulate, with increasing vacancies in both residential and commercial properties.25 Many of the garden
apartment projects in central Phoenix are heavily dependent on immigrants for their tenant base, but the
immigrant population is also a major part of the single-family market in the city’s west-central neighborhoods.
Thus, the prospects for investors, and by extension for the viability of those parts of the city of Phoenix where
21 No central tracking of rentals exists comparable to those available for house sales. The RealFacts report may understate rent levels,
since its database appears to be skewed toward multifamily properties. A tabulation by the author of 105 listings believed to be within
the city of Phoenix on Craigslist for April 25, 2010 yielded a median rent of $728. A tabulation by the author of 300 properties on
rentalhome.com on August 19, 2010 yielded median rents by number of bedrooms as follows:
0-1 bedroom $ 550 3 bedroom $ 919
2 bedroom $ 642 4+ bedroom $1,091
22 Quoted in Catherine Reagor, “Valley landlords face new reality” Arizona Republic, October 11, 2009.
23 “Single Family Detached Rental Inventory Falls Dramatically” March 21, 2010 post on The Cromford Report.
24 W.P.Carey School of Business, Arizona State University, Blue Chip Economic Forecast, http://wpcarey.asu.edu/bluechip/phoenix/
index.cfm
25 See Nicholas Riccardi, “In Arizona, the devastating effects of immigration law,” Los Angeles Times, July 25, 2010.
30CHAPTER II: INVESTORS AND MARKETS
large numbers of foreclosures are taking place and REOS are being created, remains highly uncertain.
Two other areas of concern should be noted, both specific to the areas most heavily impacted by foreclosures.
In some of those neighborhoods, investors have been buying properties at particularly low prices. During
2009, 1,751 REO properties sold for less than $40,000 in five particularly hard hit west-central Phoenix zip
codes. At such low price levels, investors may be less concerned about maintaining value on a long-term basis,
and may seek to milk the property by maximizing short- to medium-term income;26 alternatively, they may
look for opportunities to flip the properties, perhaps to less sophisticated investors. In either case, these areas
could be seeing more destructive landlord activities than elsewhere in the Phoenix area.
The second effect is closely related to the first. In many of the same zip codes REO sales make up a significant
part of the total housing stock; in 2009 alone, the number of REO sales in six zip codes, all predominately
lower income, Latino areas, exceeded 9 percent of the number of single family houses in the area. Looking at
the longer-term trend, with large numbers of properties in these areas in the foreclosure process, it would not
be unreasonable to estimate that from mid-2007 through the end of 2010, 20 to 30 percent of the housing
stock in these areas could move into investor ownership. While not all were previously owner-occupied, this
nonetheless will represent a significant drop in homeownership, something that in itself can have a significant
destabilizing effect.
New Haven
Founded in 1638, New Haven was one of the major centers of America’s first industrial revolution, beginning
at the end of the 18th century, and a major industrial city through the middle of the 20th century. Its
population peaked in 1950 at 164,443 (or 50 percent larger than Phoenix at the time), declining to 126,021
by 1980. The city’s population has remained relatively stable since then. In the course of the past sixty years,
however, the city has been transformed from an industrial city to a post-industrial one with an economy
based on education, services and health care. New Haven’s economy today is dominated by Yale University
and its affiliated Yale-New Haven Hospital. Despite its economic transformation, New Haven remains an old
city, with an older housing stock and a large lower income and minority population. The median household
income in New Haven in 2000 was only $29,604,; while nearly 3 out of 5 residents were African-American
(36 percent) and Latino (22 percent).
26 If an investor bought a house for $30,000, and could rent it for $650/month, assuming he was spending little or nothing for
property taxes or maintenance, the annual cash flow (assuming a 10 percent vacancy and collection loss) would be roughly $7,000, or
23 percent of the purchase price. This is substantial, but is still well short of the cash flow needed to justify a decision to milk a property
and ultimately walk away from it. Still, if the investor expected the property to retain some residual value at the end of 3 to 5 years, he
might adopt a milking strategy based on a partial (say, 50 percent) recovery of his acquisition cost.
31MEETING THE CHALLENGE OF DISTRESSED PROPERTY INVESTORS IN AMERICA’S NEIGHBORHOODS
Background
New Haven experienced an earlier, although in retrospect modest, housing bubble in the late 1980’s. After
single family prices collapsed, falling 40 percent from their 1988 peak, they began to rise again, nearly tripling
in price to peak at $220,000 in 2006. Since then, they have fallen by roughly one-quarter (Table 2-10).27
Table 2-10: City of New Haven Single Family Sales Prices 1987-2009
250000
200000
median sales price
150000
100000
50000
1987 1988 1989 1990 1991 1992 1993 1994 1995 1996 1997 1998 1999 2000 2001 2002 2003 2004 2005 2006 2007 2008 2009
year
Source: The Warren Group. 2009 data through November only.
While the price curve resembles that of Phoenix, the run-up in prices had less effect on construction. Since
New Haven is a fully built-out city, new housing units are created almost entirely through redevelopment or
27 In contrast to the Case-Shiller data, which uses a matched pairs model to ensure that prices are comparable from year to year, the
New Haven data is raw sales data; in other words, variations in price from year to year may reflect variations in the character of the
houses sold in different years as well as changes in market conditions.
32You can also read