PEOPLE'S REPUBLIC OF CHINA- HONG KONG SPECIAL ADMINISTRATIVE REGION - IMF
←
→
Page content transcription
If your browser does not render page correctly, please read the page content below
IMF Country Report No. 19/20

               PEOPLE’S REPUBLIC OF CHINA––
               HONG KONG SPECIAL
               ADMINISTRATIVE REGION
               2018 ARTICLE IV CONSULTATION—PRESS RELEASE
January 2019   AND STAFF REPORT
               Under Article IV of the IMF’s Articles of Agreement, the IMF holds bilateral discussions with
               members, usually every year. In the context of the 2018 Article IV consultation with the People’s
               Republic of China––Hong Kong Special Administrative Region, the following documents have
               been released and are included in this package:
               •    A Press Release.
               •    The Staff Report prepared by a staff team of the IMF for the Executive Board’s consideration
                    on a lapse-of-time basis. It is based on information available at the time it was completed on
                    December 20, 2018.
               •    An Informational Annex prepared by the IMF staff.
               The document listed below has been or will be separately released.

                   Selected Issues

               The IMF’s transparency policy allows for the deletion of market-sensitive information and
               premature disclosure of the authorities’ policy intentions in published staff reports and other
               documents.
                                      Copies of this report are available to the public from
                                       International Monetary Fund • Publication Services
                                             PO Box 92780 • Washington, D.C. 20090
                                        Telephone: (202) 623-7430 • Fax: (202) 623-7201
                                     E-mail: publications@imf.org Web: http://www.imf.org
                                                  Price: $18.00 per printed copy

                                             International Monetary Fund
                                                   Washington, D.C.

               © 2019 International Monetary Fund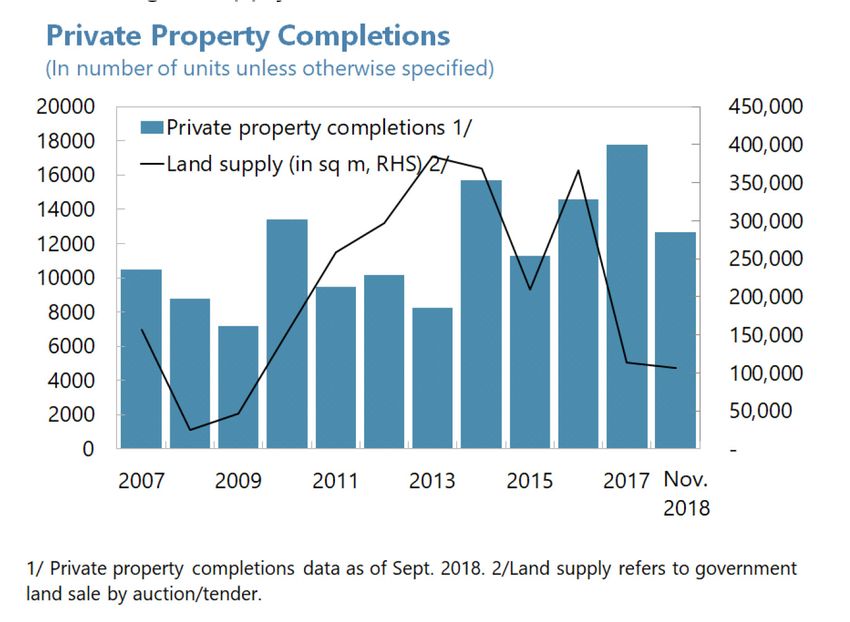
Press Release No. 19/11 FOR                                               International Monetary Fund
IMMEDIATE RELEASE                                                         700 19th Street, NW
January 25, 2019                                                          Washington, D. C. 20431 USA

    IMF Executive Board Concludes 2018 Article IV Consultation with People's Republic
                  of China—Hong Kong Special Administrative Region

On January 10, 2019, the Executive Board of the International Monetary Fund (IMF)
concluded the Article IV consultation1 with People's Republic of China—Hong Kong Special
Administrative Region and considered and endorsed the staff appraisal without a meeting on
a lapse-of-time basis.2

The Hong Kong SAR’s economy is expected to grow 3.5 percent in 2018 resulting from a
strong cyclical upswing in the first half of the year, continued global recovery, and buoyant
domestic sentiment. In 2019, growth is expected to slow to 2.9 percent. Private consumption
(aided by tight labor market) and investment (benefitting from projects currently in the
pipeline) are expected to continue to support growth, with headwinds coming from the
increased trade tensions, tighter global financial conditions, and slower growth in Mainland
China. Over the medium-term, the economy is expected to grow at around 3 percent, close to
its potential.

The authorities continued their track record of prudent macroeconomic policies. Financial
regulation and supervision continued to be strengthened, including through the
implementation of the Basel III requirements on capital, liquidity, and loss absorbing
capacity of banks. Supervision of bank loans to property developers has been appropriately
tightened, and Mainland China-related exposures have been closely monitored. Despite the
fiscal stimulus in 2018/19, the budget is expected to deliver a surplus. While the property
market showed initial tentative signs of softening in the recent months, the authorities thus
far appropriately maintained their three-pronged approach of increasing housing supply and
retaining tight macroprudential measures and demand side measures to guard financial
stability.

Nevertheless, risks to Hong Kong SAR’s outlook have increased. These include the further
escalation of global trade tensions, possible disorderly tightening of global financial

1
  Under Article IV of the IMF's Articles of Agreement, the IMF holds bilateral discussions with members,
usually every year. A staff team visits the country, collects economic and financial information, and discusses
with officials the country's economic developments and policies. On return to headquarters, the staff prepares a
report, which forms the basis for discussion by the Executive Board.

2
 The Executive Board takes decisions under its lapse-of-time procedure when the Board agrees that a proposal
can be considered without convening formal discussions.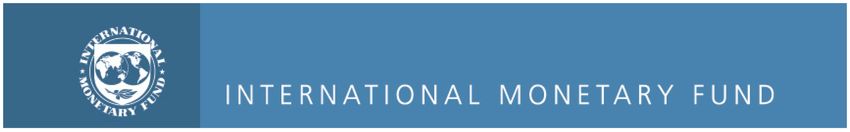
conditions, slower-than-expected growth in Mainland China, and a sharp housing market
correction. In the long-term, population aging may weaken Hong Kong SAR’s growth and
fiscal position. Sizable buffers built over the years should help navigate this less favorable
environment: at the end of 2017, fiscal reserves stood at 41 percent of GDP, or 28 months of
government spending, while the FX reserves stood at around 127 percent of GDP or twice
the monetary base. Banks have built strong capital and liquidity buffers, significantly above
the international standards, and asset quality remains strong. The Linked Exchange Rate
System continued to be the appropriate exchange arrangement for Hong Kong SAR.

Executive Board Assessment

In concluding the 2018 Article IV consultation with Hong Kong Special Administrative
Region (SAR), Executive directors endorsed staff appraisal as follows:

Outlook. Growth is projected to remain robust in 2018 a result of the global recovery,
continued solid growth in Mainland China, and increased consumer confidence, while a
modest slowdown is expected in 2019 including as a result of ongoing trade tensions. Over the
medium-term, Hong Kong SAR is expected to grow close to its potential growth of around 3
percent supported by sustainable (though gradually slowing) growth in Mainland China as
rebalancing and financial sector reforms progress.

Risks. The balance of risks for Hong Kong SAR has shifted to the downside. Risks arise from
further escalating U.S.-China trade tensions, possible disorderly tightening of global financial
conditions, slower-than-expected growth in Mainland China, and a sharp housing market
correction. These shocks are likely correlated and could materialize together, which would
amplify their effects. At the same time, the development of the Greater Bay Area creates
opportunities for Hong Kong SAR over the medium term, given its unique position as the
gateway to Mainland China and as a global financial center with renowned professional
services.

Buffers. Many years of sound macroeconomic and prudential policies have endowed Hong Kong
SAR with significant buffers to weather these shocks. These include ample FX reserves, one of the
strongest net International Investment Positions in the world, and fiscal reserves covering more
than two years of government spending. Banks’ capital buffers and liquidity positions remain
strong, due to stringent regulatory standards.

Financial sector policies. Robust financial regulation and supervision should help weather
domestic and external shocks. The implementation of Basel III requirements remains on track,
and the countercyclical capital buffer has appropriately been increased further. The authorities
have also introduced the net stable funding ratio, and rules on loss-absorbing capacity
requirements for authorized institutions will be operationalized by year-end, ensuring that
institutions have sufficient financial resources to absorb losses and be re-capitalized in case of
failure. Supervision of bank loans to property developers has been appropriately strengthened
through higher capital charges. Mainland China-related exposures are also closely monitored.
The authorities should also consider measures to extend the regulatory perimeter to reduce
regulatory arbitrage from lending by property developers. The Securities and Futures
Commission intends to impose quantitative limits on margin lending by brokers. The
development of a risk-based capital regime for insurance companies is in the Phase-2, with a
focus on detailed rules for quantitative requirements.

Housing policy. The combination of macroprudential measures and stamp duties currently in
place remains appropriate, but more needs to be done to raise housing supply. While
macroprudential measures have allowed for building buffers in the financial system against a
correction, housing prices remain overvalued, and affordability has deteriorated. A significant
increase in housing supply remains the most needed course of action. The DSD/NRSD is
assessed to be a capital flow management measure and macroprudential measure under the
IMF’s Institutional View of Capital Flows and should be phased out once systemic risks
dissipate.

Exchange rate regime and external position. The LERS remains the appropriate exchange
rate arrangement for Hong Kong SAR. Since its introduction, the LERS has served as an
anchor of stability, helping to ensure sustained growth, competitiveness, and the smooth
functioning of the extensive financial services industry. The functioning of LERS is aided by
Hong Kong SAR's flexible economy, ample fiscal buffers, and strong financial regulation and
supervision. The credibility of the arrangement is further underscored by ample FX reserves.
Hong Kong SAR’s external position and the HK dollar remain broadly in line with medium-
term fundamentals and desirable policy settings.

Fiscal policy. The FY2018/19 budget is expected to deliver a fiscal stimulus that is not needed
given the economy's strong cyclical position. At the same time, increased expenditure on
social welfare, health, and education is welcome, though some allowances could be better
targeted, and spending on public housing should be raised. Other expenditure increases should
be carefully analyzed as they may be difficult to reverse in the future, thus complicating long-
term fiscal management when aging pressures arise. The authorities should also consider
reversing the recent tax cuts. Furthermore, the authorities should strive for greater
countercyclicality in the face of both positive and negative shocks.

Long-term fiscal challenges. Aging will lead to higher pension and healthcare spending and
the housing market will likely normalize, which may lead to structural fiscal deficits.
Therefore, the authorities will need to consider measures to ensure fiscal sustainability, unless
the social safety net is scaled back. The Tax Policy Unit should study possible tax-broadening
measures and their impact on long-term fiscal sustainability, competitiveness and growth.
Options identified through international benchmarking include introducing/raising indirect
taxes like sales tax or VAT and raising excise taxes to avoid overreliance on direct taxes. On
the expenditure side, periodic expenditure reviews should continue to ensure adequate quality
of fiscal spending. Hong Kong SAR’s strong fiscal buffers afford it time to plan for meeting
future needs.

Inequality. The authorities’ efforts to reduce inequality and poverty through a combination of
subsidies, allowances, social welfare payments, and public housing should continue.
Introduction of the Annuity Scheme and the reverse mortgage can help ensure adequate
retirement income. Going forward, additional steps would be welcome including: increasing
progressivity of personal income taxation, ensuring adequate levels of spending on housing,
health, education and social welfare, and better targeting existing benefits.

Competitiveness and long-term growth. Efforts to raise labor force participation of women
and older workers should continue. The authorities’ plan to abolish the arrangement for
"offsetting" severance payment and long service payment with Mandatory Provident Fund
benefits is welcome, and should proceed as planned. Plans to develop the bond market and
further promote innovation and technology are steps in the right direction. Further expansion
of the Hong Kong SAR’s role as a leading financial center and as the gateway to Mainland
China should also help.
Hong Kong SAR: Selected Economic and Financial Indicators, 2015-23
                                                                                                                   Proj.
                                                                2015      2016       2017    2018     2019     2020        2021     2022     2023
NATIONAL ACCOUNTS
Real GDP (percent change)                                         2.4       2.2        3.8     3.5      2.9      3.0         3.1      3.1      3.1
    Contribution
         Domestic demand                                          1.4       2.5        5.2     5.4      3.3      3.5         3.5      3.6      3.5
                Private consumption                               3.1       1.3        3.7     4.0      2.2      2.3         2.3      2.5      2.5
                Government consumption                            0.3       0.3        0.3     0.4      0.3      0.3         0.3      0.3      0.3
                Gross fixed capital formation                    -0.7       0.0        0.7     0.9      0.8      0.9         0.8      0.7      0.8
                Inventories                                      -1.2       0.9        0.5     0.1      0.0      0.0         0.0      0.0      0.0
         Net exports                                              0.8      -0.3       -1.4    -1.9     -0.4     -0.5        -0.3     -0.5     -0.4
    Output gap (in percent of potential)                         -0.2      -0.8        0.0     0.5      0.3      0.2         0.2      0.1      0.1
Saving and investment (percent of GDP)
   Gross national saving                                         24.9      25.5      26.6     25.6     25.7     25.7        25.7     25.5     25.5
   Gross domestic investment                                     21.5      21.5      22.3     22.3     22.2     22.3        22.3     22.2     22.1
   Saving-investment balance                                      3.3       4.0        4.3     3.4      3.5      3.4         3.4      3.4      3.5
LABOR MARKET
Employment (percent change)                                       0.9       0.2        0.9     1.0      0.4      0.4         0.3      0.3      0.3
Unemployment rate (percent, period average)                       3.3       3.4        3.1     2.6      2.6      2.6         2.6      2.6      2.6
Real wages (percent change)                                       0.5       1.2        2.3     1.6      1.0      1.2         1.3      1.3      1.3
PRICES
Inflation (percent change)
    Consumer prices                                               3.0       2.4        1.5     2.4      2.1      2.2         2.4      2.5      2.5
    GDP deflator                                                  3.6       1.7        2.9     3.1      2.0      2.0         1.7      1.9      1.9
GENERAL GOVERNMENT (percent of GDP)
Consolidated budget balance                                       0.6       4.5        5.6     3.3      2.0      1.8         1.7      1.7      1.7
    Revenue                                                      18.8      23.0      23.3     22.2     21.0     20.9        21.2     21.2     21.2
    Expenditure                                                  18.2      18.6      17.7     18.9     19.0     19.1        19.5     19.5     19.5
Fiscal reserves as of March 31                                   35.1      38.3      41.4     42.2     42.1     41.9        41.6     41.3     41.0
FINANCIAL
Interest rates (percent, period-average)
Best lending rate                                                 5.0       5.0        5.0      ...      ...      ...         ...      ...      ...
Three-month HIBOR                                                 0.4       0.6        0.9      ...      ...      ...         ...      ...      ...
10-year Treasury bond yield                                       1.6       1.2        1.6      ...      ...      ...         ...      ...      ...
MACRO-FINANCIAL
Loans for use in Hong Kong SAR (ex. trade financing)              6.3       8.0      16.1     14.6      8.4      7.4         9.1      8.1      9.3
House prices (end of period, percent change)                      2.4       7.9      14.7     14.8      3.3      3.1         4.5      5.9      6.6
Credit Gap 1/                                                    11.0      10.9      19.6     19.3     10.2      7.2         5.6      2.6      2.0
Hang Seng stock index (percent change)                           -7.2       0.4      36.0       ...      ...      ...         ...      ...      ...
EXTERNAL SECTOR
Merchandise trade (percent change)
    Export value                                                 -1.8      -0.5        8.0     8.0      5.3      3.6         4.0      3.6      3.5
    Import value                                                 -4.1      -1.0        8.7     8.6      5.3      3.9         4.3      4.1      3.8
    Terms of trade                                                0.5       0.0       -0.1     0.8      0.0     -0.1        -0.2     -0.2     -0.1
Current account balance (percent of GDP) 2/                       3.3       4.0        4.3     3.4      3.5      3.4         3.4      3.4      3.5
Foreign exchange reserves 2/
    In billions of U.S. dollars, end-of-period                 358.8      386.2     431.6    447.7    470.0    492.8       510.7    528.1    540.9
    In percent of GDP                                          116.0      120.3     126.4    123.6    122.2    119.9       117.2    113.9    109.4
Net international investment position (percent of GDP)         324.2      359.2     409.4    387.0    372.1    357.6       344.4    331.3    318.7
Linked rate (fixed)
    Market rate (HK$/US$1, period average)                     7.752      7.762     7.793       …        …        …           …        …        …
    Real effective rate (period average, 2010=100)              113.9      118.3     118.2      …        …        …           …        …        …
 Sources: BIS,CEIC; HKSAR Census and Statistics Department; and IMF staff estimates.
1/ Based on loans for use in Hong Kong SAR
2/ Data published using the Balance of Payments Statistics Manual 6 (BPM6) format
PEOPLE'S REPUBLIC OF
CHINA—HONG KONG SPECIAL
ADMINISTRATIVE REGION
STAFF REPORT FOR THE 2018 ARTICLE IV CONSULTATION
December 20, 2018 DISCUSSIONS
KEY ISSUES
• Overview. Hong Kong SAR’s economy benefitted from a strong cyclical upswing through
the first half of 2018, supported by the continued global recovery, buoyant domestic
sentiment, and the booming property market. However, near-term risks have
significantly increased – including those from trade tensions, tighter global financial
conditions, and capital outflows from emerging markets. Also, long-term challenges,
including from aging, elevated inequality, and the persistent housing shortage, need to
be tackled. Prudent macroeconomic policies and ample buffers are in place to help
smoothen the transition and ensure continued stability.
• Policies. While macroeconomic and financial policies have generally been appropriate
and allowed for building of buffers, fiscal policy could have been more countercyclical.
Going forward, the recommended policy strategy includes:
Financial sector. The robust regulatory and supervisory framework should
continue to be strengthened to limit buildup of risks. Recent increases of
household loans merit close monitoring. Fintech developments should also be
carefully evaluated to balance efficiency gains against potential risks.
Housing market. The three-pronged strategy, comprised of macroprudential
measures, stamp duties, and measures to boost housing supply, remains
appropriate and should continue in place, and be adjusted as financial stability
risks evolve. However, ultimately resolving the imbalances in the housing market
requires expanding supply and further efforts are needed in this area.
Exchange rate. The Linked Exchange Rate Regime remains the appropriate
arrangement for Hong Kong SAR and should remain as an anchor of economic
and financial stability.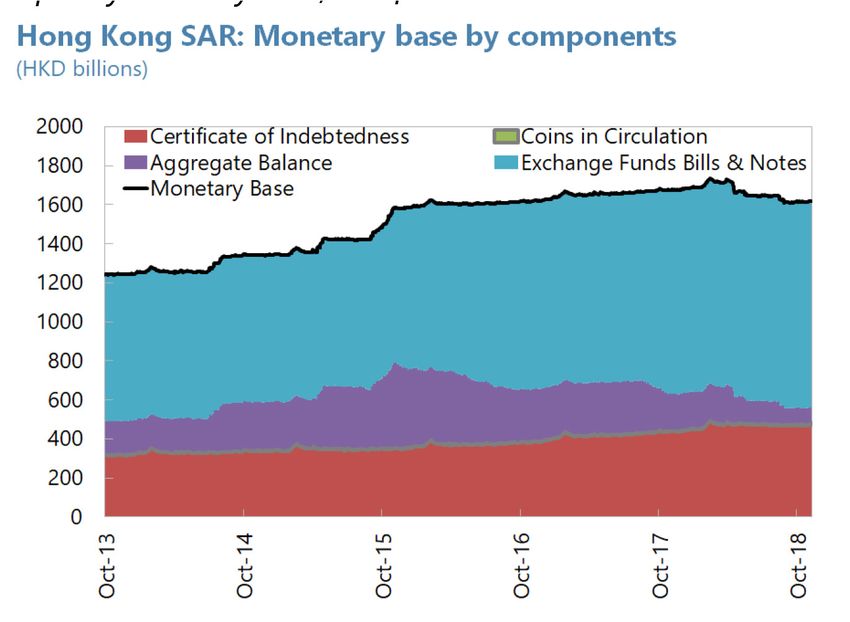
PEOPLE’S REPUBLIC OF CHINA—HONG KONG SAR
Fiscal. Fiscal stimulus does not appear necessary in the short-term given the
economy’s cyclical strength, and while higher spending on social welfare and
education is warranted given elevated income inequality, tax cuts should be
reversed, and other expenditure carefully evaluated. In the long term, revenues
will need to be raised to cope with aging-related fiscal pressures.
Long-term growth. Increasing labor force participation of women and older
workers could help stem labor force declines. Further regional integration,
including in the context of the Greater Bay Area, could create growth
opportunities.
2 INTERNATIONAL MONETARY FUND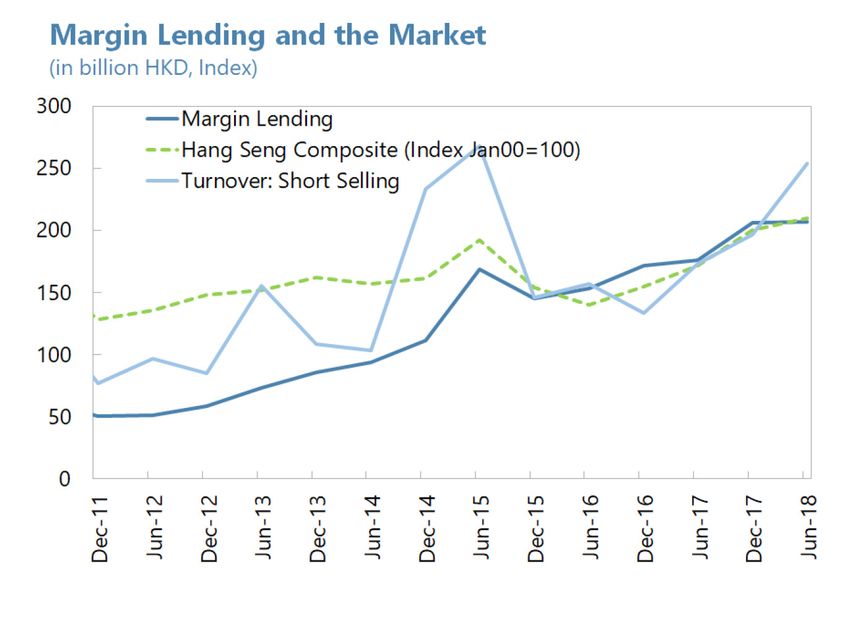
PEOPLE’S REPUBLIC OF CHINA—HONG KONG SAR

 Approved By                Discussions took place in Hong Kong SAR during October 29 –
 Kenneth Kang and           November 9, 2018. The team comprised Sonali Jain-Chandra (head),
 Petya Koeva Brooks         Emilia Jurzyk, Rui Mano (all APD), and Sally Chen (Resident
                            Representative, MCM). Markus Rodlauer (APD) joined the
                            concluding meetings. The mission met Financial Secretary Paul Chan,
                            HKMA Chief Executive Norman Chan, and other senior officials.
                            Zhongxia Jin, Sun Ping, and Georgina Lok (OED) joined the official
                            meetings. Ananya Shukla, Gabriel Alvim (all APD), Daisy Wong
                            (COM), Atis Lee, and Kevin Chow (Resident Representative Office)
                            provided support to the mission.

   CONTENTS
CONTEXT: STRONG REBOUND AMID GROWING RISKS _______________________________________ 5

DEVELOPMENTS: THE ECONOMY OPERATING AT FULL EMPLOYMENT ______________________ 5

MANY RISKS SURROUND THE BASELINE ______________________________________________________ 9
A. Rising Trade Tensions _________________________________________________________________________ 10
B. Sharper-Than-Expected Tightening of Global Financial Conditions____________________________ 10
C. Sharp Slowdown in the Property Market ______________________________________________________ 11
D. Slowdown in Mainland China _________________________________________________________________ 12
E. Amplification of Risks Scenario ________________________________________________________________ 14

SIGNIFICANT BUFFERS IN PLACE ______________________________________________________________ 15

POLICY CHALLENGES ___________________________________________________________________________ 16
A. Ensuring Continued Financial Stability ________________________________________________________ 16
B. Containing the Housing Market Boom ________________________________________________________ 18
C. Preserving the Exchange Rate Arrangement __________________________________________________ 21
D. Ensuring Fiscal Sustainability __________________________________________________________________ 22
E. Bolstering Long-Term Growth Prospects ______________________________________________________ 26

STAFF APPRAISAL _____________________________________________________________________________ 30

BOXES
1. Amplication of Risks Scenario for Hong Kong SAR ____________________________________________ 33
2. Financial Conditions and Growth at Risk ______________________________________________________ 34
3. Greater Bay Area: Opportunities and Challenges ______________________________________________ 35

                                                                 INTERNATIONAL MONETARY FUND        3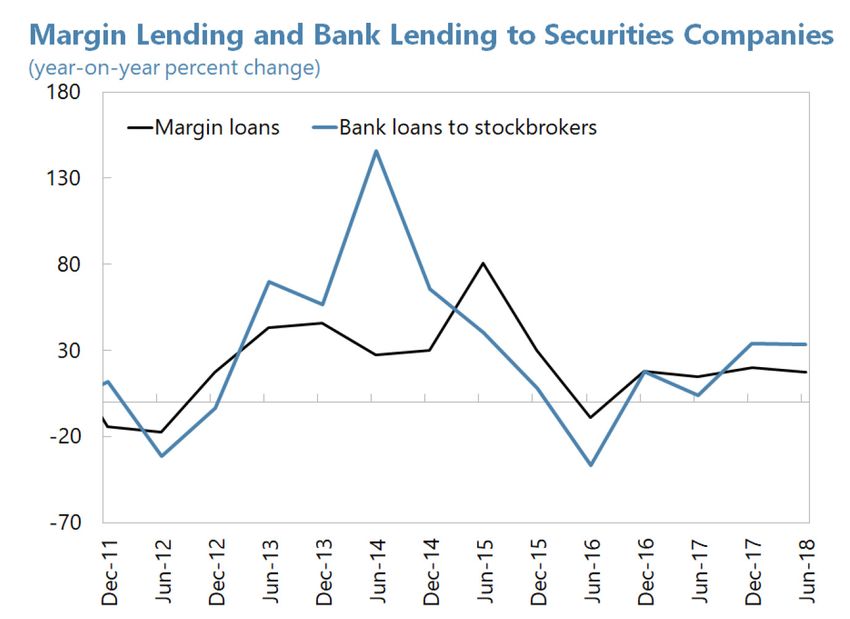
PEOPLE’S REPUBLIC OF CHINA—HONG KONG SAR

FIGURES
1. Strong Rebound in Growth _____________________________________________________________________ 6
2. Strong Fiscal Position but Spending Pressures Loom in the Medium-Term____________________ 36
3. Housing Boom Continues Despite Tight Macroprudential Settings ____________________________ 37
4. The Linked Exchange Rate System Has Operated Smoothly ___________________________________ 38
5. Debt Vulnerabilities ___________________________________________________________________________ 39
6. Exposures of Hong Kong SAR _________________________________________________________________ 40

TABLES
1. Selected Economic and Financial Indicators, 2015-23 _________________________________________ 41
2. Balance of Payments, 2015-23_________________________________________________________________ 42
3. Consolidated Government Account, 2015-2023 _______________________________________________ 43
4. Monetary Survey, 2013-19 ____________________________________________________________________ 44
5. Vulnerability Indicators, 2013-18 ______________________________________________________________ 45

APPENDICES
I. Risk Assessment Matrix ________________________________________________________________________ 46
II. Debt Sustainability Analysis ___________________________________________________________________ 47
III. External Sector Assessment ___________________________________________________________________ 49
IV. Implementation of the 2014 FSAP Recommendations ________________________________________ 51
V. Summary of Macroprudential Measures Introduce Since 2009 ________________________________ 64
VI. Main Recommendations of the 2016 Article IV Consultation _________________________________ 70

4    INTERNATIONAL MONETARY FUND
PEOPLE’S REPUBLIC OF CHINA—HONG KONG SAR

CONTEXT: STRONG REBOUND AMID GROWING RISKS

1.       The Hong Kong SAR economy benefited from a strong cyclical upswing and
momentum continued through the first half of 2018… Growth rebounded strongly in 2017 and
the first half of 2018 as a result of the global recovery, continued momentum in Mainland China, and
increased consumer confidence. Inflation remained subdued and unemployment fell to a 20-year
low. The booming economy and the buoyant property market boosted fiscal revenues, resulting in a
large fiscal surplus.

2.      …but challenges are increasingly clouding the horizon. Risks, including the escalating
trade tensions, a disorderly tightening of global financial conditions, slower-than-expected growth
in Mainland China, and a sharp property market correction, could have a significant negative impact
on Hong Kong SAR’s economic prospects. At the same time, Hong Kong SAR should continue to
benefit from its role as a global financial center, and growth opportunities could be generated from
the development of the Guangdong-Hong Kong SAR-Macao SAR Bay Area (Greater Bay Area).

3.       Going forward, Hong Kong SAR will need new drivers of growth. The property boom
has left the city with one of the least affordable housing in the world and high commercial rents,
amid elevated income inequality. Its services sectors face stiff competition from cities in Mainland
China and elsewhere in Asia. That, together with the structural challenge of an aging population—
likely to bring a decline in the labor force and productivity—may result in falling competitiveness,
slower growth, and a deteriorating fiscal position. Fortunately, many years of prudent macro policies
left Hong Kong SAR with ample buffers that should ease the transition and allow for policies to
ensure continued stability and prosperity, and increased inclusion. The authorities’ have taken a
number of steps to address these challenges including efforts to increase housing supply and
provide public housing to a large part of the population, and boosted spending on health and social
welfare to increase inclusion, as well as maintaining robust financial regulation and supervision
including for fintech.

DEVELOPMENTS: THE ECONOMY OPERATING AT FULL
EMPLOYMENT
4.     Strong growth continued amid increased consumer confidence and the global
recovery, slowing modestly in Q3.

•   Domestic activity. Growth remained strong in 2017 and through 2018:Q1, and started to
    moderate since 2018:Q2. Private consumption was the main contributor, supported by a tight
    labor market (unemployment stood at 2.8 percent in the three months ending October, the
    lowest in over 20 years), continued growth in real wages, and tourism inflows from Mainland

                                                                 INTERNATIONAL MONETARY FUND       5
PEOPLE’S REPUBLIC OF CHINA—HONG KONG SAR
China (which account for 40 percent of retail sales). The output gap is estimated to be 0.5
percent and inflation remains subdued, although picked up slightly to 2.7 percent in October.
Figure 1. Hong Kong SAR: Strong Rebound in Growth
The economy expanded 3.7 percent y/y in Q1-Q3 2018… …driven by strong private consumption….
Contribution to Real GDP Growth by Major Expenditure Retail Sales Volume
Components (in percent (yoy))
(percent) 40
8
Government consumption 30
Net exports
6 Investment (incl. changes in inventories)
20
Private consumption
4 GDP
10
2 0
0 -10
-2 -20
-30
-4
Oct-07 Jul-09 Apr-11 Jan-13 Oct-14 Jul-16 Oct -18
Apr-18
2007 2008 2009 2010 2011 2012 2013 2014 2015 2016 2017 2018
Q1-Q3
…strong tourist arrivals, especially from Mainland China …and very tight labor market conditions.
Visitor Arrivals Unemployment and Wage Developments
(in percent (yoy)) (percent; index)
60 108 6.0
50 Visitor Arrivals: Total Visitor Arrivals: China 106
5.0
40
104
30 4.0
102
20
10 100 3.0
0 98
2.0
-10 96
-20 Real Wages (Index, 2007Q1=100) 1.0
94
-30 Unemployment Rate (%, RHS)
92 0.0
-40
Sep-07 Apr-09 Nov-10 Jun-12 Jan-14 Aug-15 Mar-17 Oct-18
Oct-07 Jul-09 Apr-11 Jan-13 Oct-14 Jul-16 Oct -18
Apr-18
Note: Unemployment series is a seasonally adjusted, 3 month average; Real Wages series is
a non-seasonally adjusted, 3 month average.
Trade activity held steady … …and services exports continued to expand.
Exports and Imports of Goods Exports of Services
(three month moving average, year-on-year percent change) (in percent (yoy))
40 20
Goods Exports Goods Imports Transportation Financial Services Travel Other Total
30 15
20
10
10
5
0
0
-10
-20 -5
-30 -10
Jan-07 Aug-08 Mar-10 Oct-11 May-13 Dec-14 Jul-16 Oct -18
Feb-18 Mar-07 Sep-08 Mar-10 Sep-11 Mar-13 Sep-14 Mar-16 Sep-17
Sep-18
Sources: CEIC, Haver, and IMF staff calculations.
6 INTERNATIONAL MONETARY FUNDPEOPLE’S REPUBLIC OF CHINA—HONG KONG SAR
• External sector. Despite rising trade tensions between Hong Kong SAR’s two major trading
partners, exports expanded 8 percent y/y in 2018Q1-Q3 (compared to the average of 1.6
percent during 2015-2017), with 5 percent increase in volumes. Amid strong domestic demand,
imports edged up even more: net exports continued to subtract from growth and the current
account surplus moderated from 4.3 percent of GDP in 2017 to 2.4 in H1 2018. Capital outflows
resumed in Q2, after large inflows in 2017, driven by portfolio investment.
• Exchange rate. The Linked Exchange Rate System (LERS) has continued to anchor exchange rate
developments. Ample liquidity in the domestic interbank market slowed the upward adjustment
of the HIBOR despite interest rate increases by the U.S. Fed. The resulting HIBOR-LIBOR
differential widened in April, leading to HK dollar depreciation to 7.85 per U.S. dollar, the floor of
the convertibility undertaking. The Hong Kong Monetary Authority (HKMA) intervened as part of
the currency board, selling US$13 billion between April and August. These operations drained
liquidity from the banking system and raised the HIBOR closer to the LIBOR, which led to the
recent strengthening of the HKD closer to midpoint of the band.
US Dollar Sold by HKMA under Weak-side Convertability Spread between USD LIBOR and HKD HIBOR
Undertaking (bps)
(USD billions) 120
0.0
100 1m USD LIBOR minus 1m HKD HIBOR
-0.2 3m USD LIBOR minus 3m HKD HIBOR
-0.3 -0.3 -0.2
-0.5 80
-0.4
60
-0.8 -0.8
-1.0 -0.9
-1.0 40
-1.2 -1.2
-1.5 20
0
-2.0 -1.9 -1.9
-20
-2.2
-2.5 -40
14-Aug
15-Aug
23-Aug
27-Aug
28-Aug
15-May
16-May
17-May
18-May
12-Apr
13-Apr
16-Apr
17-Apr
18-Apr
Jan-15 Jul-15 Jan-16 Jul-16 Jan-17 Jul-17 Jan-18 Nov-18
Jul-18
Source: HKMA. Sources: CEIC, and IMF Staff Calculations.
• Property prices. Housing prices continued Residential Property Price Indices per Apartment Class /1
(Jan 1999 = 100)
their upward trend, but softened recently. 500
450 Private Private A
Trough-to-peak (March 2016 to July 2018), 400
Private B Private C
house prices grew 45 percent, and even more 350
300 Private D Private E
for the smallest, and thus most affordable, 250
200
apartments. House prices declined 3.7 percent 150
between July and October, and transactions 100
50
declined from the robust figures seen in the 0
200001 200301 200601 200901 201201 201501 201801
201810
first half of the year. Sources: Haver and IMF staff calculations.
1/ Class A denotes apartments of less than 40 m2, class B: 40 m2 to 69.9 m2, class
C: 70m2 to 99.9m2, class D: 100m2 to 159m2, class E: above 160 m2.
• Financial conditions. Financial conditions
remained accommodative in the first half of 2018 and then started to move towards neutral.
Local interest rates rose modestly from historically low levels, equity prices fell 20 percent from
INTERNATIONAL MONETARY FUND 7PEOPLE’S REPUBLIC OF CHINA—HONG KONG SAR
the peak in January to end-November, capital Financial Conditions Index
outflows resumed and domestic lending
4
3
moderated.
2 Tightening
1
• Credit. Credit growth slowed to 7.2 percent y/y
0
in Q3 2018 vs. 16.1 percent in 2017, particularly -1
among loans for use outside Hong Kong SAR, -2
especially in Mainland China. The growth of -3 Loosening
domestic loans moderated as well, with growth -4
Jan-07 May-08 Sep-09 Jan-11 May-12 Sep-13 Jan-15 May-16 Sep-17
in consumer lending easing to 9.9 percent, Sources: Bloomberg, and IMF Staff Calculations.
driven by 13 percent y/y growth in other Note: FCI is based on principal component analysis of data on funding costs and quantity from
1980 to Q2 2018.
household lending (including credit cards and
Loans for use in Hong Kong SAR by type
other unsecured loans) and continued robust (share in total)
Financial and Stock Brokers Construction and Property Purchases
mortgage lending. The household debt-to-GDP Households
Total Loan Growth (RHS)
Other Lending
100 30
ratio dropped slightly from 71.2 percent in Q2 to 90
25
70.7 percent in Q3 2018, while corporate debt 80
70 20
also came down from 177 percent of GDP to 60
50
15
170 percent over the same period. 1 With a 40 10
30 5
moderation in credit growth, the domestic 20
0
10
credit-to-GDP ratio stabilized at 240 percent in 0 -5
Q3 and the credit gap, defined as the credit-to-
Mar-04
Mar-05
Mar-06
Mar-07
Mar-08
Mar-09
Mar-10
Mar-11
Mar-12
Mar-13
Mar-14
Mar-15
Mar-16
Mar-17
Mar-18
GDP ratio relative to trend, fell to 16.1 percent in Sources: Haver Analytics, and IMF Staff Calculations.
Q2 from 20.6 percent in Q4 2017, but remains
elevated.
• Fiscal. The FY2017/18 surplus came in at 5.6 percent of GDP, much stronger than budgeted
(0.6 percent of GDP). Land premia and stamp duties were the main contributors, amid the
Contribution to Loan Growth Credit-to-GDP Gap based on Loans for Domestic Use
(Percent, year-on-year growth) (percent)
30
Loans for use outside HKG Other loans (undeterm. use)
Trade loans Building and constr.
HH property purchase Other HH 25
Financial Other loans, use in HKG
Total loans 20
30 2015-17 average
15
20
10
10
5
0
0
Sep-10
Sep-11
Sep-12
Sep-13
Sep-14
Sep-15
Sep-16
Sep-17
Sep-18
-10
2015Q1
2015Q2
2015Q3
2015Q4
2016Q1
2016Q2
2016Q3
2016Q4
2017Q1
2017Q2
2017Q3
2017Q4
2018Q1
2018Q2
-20
Sources: HKMA, and IMF staff calculations. Sources: HKMA.
1
Household debt is estimated based on bank lending to households, including residential mortgage loans, credit
card advances and loans for other private use. It does not cover mortgage loans extended by property developers to
home buyers, which is small relative to outstanding mortgage loans extended by banks.
8 INTERNATIONAL MONETARY FUNDPEOPLE’S REPUBLIC OF CHINA—HONG KONG SAR
booming property market. As a result, fiscal reserves rose to about 41 percent of GDP or
28 months of government spending by end-2017.
5. Baseline projections. Growth is projected to slow moderately in the second half of 2018
and through 2019. The annual growth rate is projected to be 3.5 percent in 2018, and 2.9 percent in
2019. The forecast relies on the following assumptions:
• Tariffs announced until end-September 2018 come into effect, but trade tensions do not
escalate further, and global trade grows at 4.4 percent in 2019-2020.
• Mainland China’s economic growth slows slightly but remains robust at 6.2 percent over the
next two years.
• Rising global interest rates are transmitted to Hong Kong SAR, gradually reducing the credit gap
and cooling the property market.
• Private consumption remains robust, supported by tight labor market conditions.
• Government spending rises significantly in 2018, delivering a positive fiscal impulse.
6. Medium-term growth. Over the medium-term, Hong Kong SAR is expected to grow close
to its potential growth of around 3 percent and the positive output gap is expected to gradually
close. Hong Kong SAR’s growth prospects are projected to be supported by sustainable (though
gradually declining) growth in Mainland China, as rebalancing and financial sector reforms progress.
Authorities’ Views
7. The authorities broadly agreed with mission’s assessment. They noted that the short-
term outlook for Hong Kong SAR remained strong until the third quarter of 2018 on the back of
robust private consumption aided by tight labor market conditions and investment, as well as still-
strong exports. Some of the negative effects of some external downside risks started to materialize
at the end of Q3. Overall, the authorities believe that Hong Kong SAR’s strong buffers and robust
policy frameworks will enable it to navigate through the challenges. Some softening in the property
market should have only a limited impact on growth given the strong financial position of both
households and banks. Hong Kong SAR is expected to benefit from further development of the
Greater Bay Area, as well as its position as the gateway to Mainland China and a global financial
center.
MANY RISKS SURROUND THE BASELINE
Risks have shifted to the downside. Hong Kong SAR remains vulnerable to further escalating U.S.-
China trade tensions, possible disorderly tightening of global financial conditions, slower-than-
expected growth in Mainland China, and a sharp housing market correction. GDP could be knocked
down by 2½ percent over two years and remain lower in the medium-term in a scenario in which
multiple shocks, including escalating trade tensions and turmoil in emerging markets, materialize.
INTERNATIONAL MONETARY FUND 9PEOPLE’S REPUBLIC OF CHINA—HONG KONG SAR
A. Rising Trade Tensions
8. Rising trade tensions would have a significant impact on Hong Kong SAR’s highly-
open economy. China and the U.S. are its
Hong Kong SAR Banks' Mainland China Exposure
major trading partners, and the city’s economy (Trillions of HKD)
and labor market are highly dependent on a 5
Mainland Mainland Non-Mainland
range of trade-related industries, including 4
SOE's Private Entities Entities
logistics, wholesale and retail. While tariff
actions thus far have not weighed on trade 3
through Hong Kong SAR, the impact of further 2
escalation could lower its GDP by 1 percent in
1
2019, with the effects likely larger once the full
impact on consumer confidence and financial 0
Mar-14
Mar-15
Mar-16
Mar-17
Mar-18
Sep-14
Sep-15
Sep-16
Sep-17
Sep-18
Dec-13
Dec-14
Dec-15
Dec-16
Dec-17
Jun-14
Jun-15
Jun-16
Jun-17
Jun-18
markets is factored in (see Box 1). The
transmission would operate through real Sources: HKMA.
economy channels—chiefly trade, logistics and
tourism—and financial channels, through re-pricing of risk in equity markets, higher corporate
spreads and possible deterioration of the quality of the large Mainland-related loan portfolio.
B. Sharper-Than-Expected Tightening of Global Financial Conditions
9. After a decade of “easy money”, Hong Kong SAR remains vulnerable to faster-than-
expected tightening of global financial conditions. Several factors are at play:
• Monetary policy surprises by the Fed or the ECB. Robust growth in the U.S., aided by fiscal
stimulus, raises the prospect of faster-than-anticipated interest rate hikes. Also, the ECB has
announced that the bond purchase program will end in December 2018. Higher rates in the U.S.
and the Euro-area, in turn, could lead to a rise in global rates, term premia, and U.S. dollar
appreciation, which would feed directly into HK dollar appreciation and increase local funding
rates.
• “Bumpy” financial and local government reforms in China. If further reforms are not
managed well, they could bring about increased volatility and disorderly repricing of credit risks,
resulting in investor losses and a reduced risk appetite.
10. Tighter liquidity conditions would have a broad-based impact.
• Households. HIBOR-based mortgages accounted for 50.8 percent of new mortgages in
October. While most HIBOR-based mortgages are capped by the prime rate that prevents rates
from rising too sharply, if banks decide to increase prime rates, mortgage payments would rise.
10 INTERNATIONAL MONETARY FUNDPEOPLE’S REPUBLIC OF CHINA—HONG KONG SAR
Staff analysis suggests that for every 1 New Mortgage Pricing Scheme
(Share in Percent)
percentage point increase in interest rates,
New mortgages reference to prime rate
120
New mortgages reference to HIBOR
household debt service rises by about 5 100
New mortgages with fixed rate (mostly first year)
percentage points. Moreover, analysis by the 80
HKMA indicates that a 1 percentage point 60
increase in the outstanding mortgage debt 40
service ratio would reduce household
20
consumption by around ¾ percent in the long-
0
run. Jan-04 Jan-06 Jan-08 Jan-10 Jan-12 Jan-14 Jan-16 Jan-18
Sources: HKMA.
• Corporates. The leverage of nonfinancial corporates has also been rising, with corporate debt
increasing from 125 percent of GDP in 2010 to 170 percent in Q3 2018. Higher interest rates
would increase refinancing costs, reduce investment and potentially weigh on bank balance
sheet growth. Staff analysis suggests that a 3 percentage point interest rate increase would
reduce investment by ½ - 1 percent.
• Global financial market volatility and capital flows. As a financial center, Hong Kong SAR is
highly vulnerable to shifts in risk sentiment. Already, high-frequency data suggests that capital
outflows have increased in recent months.
11. The end of a prolonged period of easy financial conditions is expected to dampen
growth over the medium term. Easy financial conditions in the recent past are tightening amid
rising interest rates, equity market losses, capital outflows, and an increase in market volatility. With
financial conditions moving to neutral, the near-term impact on growth is expected to be limited.
However, a dramatic tightening in financial conditions could have a large negative impact on growth
(see Box 2). 2
C. Sharp Slowdown in the Property Market
12. The property market remains one of the least affordable in the world due in part to
supply shortages, although it has recently started to show signs of cooling. Staff analysis
suggests that as of Q2 2018, house prices exceeded those suggested by fundamentals by around
20-35 percent. Housing affordability deteriorated further: since 2009, house prices increased more
than 260 percent and rents doubled, while average wages grew less than 50 percent. The average
mortgage payment-to-income ratio for owners of small and medium-sized units stood at 74 percent
in Q2 2018 (based on government estimates). As a result, Hong Kong SAR remains one of the least
2
The growth-at-risk (GaR) exercise links current financial conditions to the distribution of future growth outcomes.
Specifically, it assesses the impact of changes in financial conditions on future growth - based on quarterly growth
rate - and financial stability. “Near term” refers to the one-year horizon; “medium term” refers to the three-year
horizon out to 2021.
INTERNATIONAL MONETARY FUND 11PEOPLE’S REPUBLIC OF CHINA—HONG KONG SAR
affordable housing market in the world. More recently, prices retreated from their July peak by 3.7
percent to October, indicating that the housing market may be starting to soften.
Domestic Housing Affordability Indicators Affordability Indicators: International Housing Markets
(Q1 2004 = 100) (Median house price to median annual gross income)
400 Hong Kong SAR 19.4
Rents
350 Sydney 12.9
Wages
300 Vancouver 12.6
House prices
Santa Cruz 10.4
250 Mortgage payment to income ratio
San Jose 10.3
200
Melbourne 9.9
150
Santa Barbara 9.4
100 Los Angeles 9.4
50 Honolulu 9.2
0 San Francisco 9.1
Salinas-Monterey 9.1
2009Q1
2009Q3
2010Q1
2010Q3
2011Q1
2011Q3
2012Q1
2012Q3
2013Q1
2013Q3
2014Q1
2014Q3
2015Q1
2015Q3
2016Q1
2016Q3
2017Q1
2017Q3
2018Q1
2018Q3
0 5 10 15 20 25
Sources: Haver and IMF staff calculations. Sources: Demographia, 14th International Housing Affordability Survey.
13. Gradual interest rate increases have the potential to cool the market in an orderly way,
but sharper-than-expected increases would pose a risk. A sharper-than-expected increase in
interest rates, particularly if accompanied by weaker growth in trading partners, could weigh on
consumption. The direct impact on the banking sector would likely be limited given that the share of
mortgages in bank portfolios has fallen to 20 percent, loan-to-value (LTV) ratios on new mortgages
fell to 45 percent in October, and banks are well capitalized. Instead, adverse impacts on banks’
balance sheets would materialize through second-round effects of lower consumption and reduced
business profitability and investment via the wealth effects channel.
D. Slowdown in Mainland China
14. The degree of interconnectedness between Hong Kong SAR and Mainland China is
high and continues to rise. Hong Kong SAR benefits from close ties to Mainland China through
trade, tourism, and financial sector linkages (Figure 6). Thus, a significant slowdown in Mainland
China either due to insufficient/not-well-managed domestic reforms or further trade tensions could
significantly impact Hong Kong SAR.
• Real sector. Trade linkages between Mainland China and Hong Kong SAR remain strong and
Mainlanders account for over ¾ of all tourism spending. Domestic consumption also likely
captures some of their spending. A slowdown in Mainland China would impact the trade,
logistics and tourism sectors.
• Banking system. Financial exposure to Mainland China remains high, with around 39 percent of
loans extended for Mainland-related purposes. Asset quality of that lending remained sound,
with an NPL ratio at 0.64 percent in Q3 2018. Also, the average interest coverage ratio of A-
share firms improved and the debt-at-risk ratio fell from 6.9 percent in Q2 2017 to 5.0 percent in
Q3 2018, reflecting stronger earnings and moderation in leverage. Softer growth in Mainland
China combined with a weaker global trade environment could lower growth of Mainland-
related lending and dent the quality of existing loans.
12 INTERNATIONAL MONETARY FUNDPEOPLE’S REPUBLIC OF CHINA—HONG KONG SAR
Hong Kong SAR Banks: Non-Bank China Exposure by Interest Coverage of Non-Financial A-share Firms
(Times of earnings over interest expenses)
Borrower Type
(percent of total loans) 5
70 4.5 4.3 4.4
4.1
Chinese SOEs 1/
60 4 3.8
3.6
Chinese private entities
50
3.5 3.2
Non-China entities 3
40
Other exposure 2.5
30
Non-banks China exposure 2
20
1.5
10 1
0 0.5
Jun-06 Jun-08 Jun-10 Jun-12 Jun-14 Jun-16 Jun-18
0
Source: HKMA, CEIC, and IMF staff calculations. 2013 2014 2015 2016 2017 2018H1
Note: The breakdown is only available from 2013Q4.
1/ Loans used onshore, thus exposed to Mainland China's economic cycle. Sources: WIND, and IMF staff calculations.
• Hong Kong SAR is a regional financial center and a gateway to Mainland China. Cross-
border flows between the Mainland and Hong Kong SAR have increased in recent years,
boosting the prospects of Hong Kong SAR’s financial sector. Its role as a fundraising platform for
Chinese firms has expanded from equity fundraising through IPOs to bank borrowing and bond
financing.
Bank financing. A downturn in the investment and financing needs of Mainland corporates
could negatively weigh on Hong Kong SAR banks’ balance sheet growth and profit outlook.
Capital market financing. In 2017, total equity raised by Mainland firms listed in Hong
Kong SAR amounted to US$47 billion, and offshore bonds issued by Mainland firms
increased by almost 60 percent to US$66 billion. Much of this expansion is dependent on
China’s growth prospects and is sensitive to RMB exchange rate expectations. Anticipating
greater fund flows between the Mainland and Hong Kong SAR, the daily quota for Stock
Connect Schemes was increased: the southbound daily quota into Hong Kong SAR increased
from RMB 10.5 billion to RMB 42 billion for both the Shanghai-Hong Kong and Shenzhen-
Hong Kong Schemes since May 2018. Usage remains limited, however, with net inflows
averaging no more than 3 percent of the new quota in 2018.
Asset management business. The asset management business has grown rapidly, with total
asset under management reaching HK$31.6 trillion in mid-2018 from HK$18.3 in 2016.
Overseas investors make up two-thirds of the funding. The industry’s growth reflects Hong
Kong SAR’s highly-regarded regulatory framework and position as a preferred gateway to
the Mainland, where the number of high-net-worth individuals has increased rapidly.
RMB internationalization. RMB deposits edged higher relative to a year ago in 2018,
reflecting stabilization of RMB expectations in 2017 and 2018:H1. However, the escalation of
trade tensions and recent RMB depreciation could weigh on the demand for renminbi assets
in the near term and have a negative impact on RMB deposits and trade settlement
INTERNATIONAL MONETARY FUND 13PEOPLE’S REPUBLIC OF CHINA—HONG KONG SAR
conducted through Hong Kong SAR. 3 Over RMB Deposits in Hong Kong SAR
(RMB Billions)
the medium to long term, this market is 1200
RMB Demand and Savings Deposits
9
expected to continue growing with ongoing
8
1000
RMB Time Deposits 7
RMB internationalization and further 800 RMB Deposits/Total Deposits (%, 6
opening-up of Mainland China’s capital
RHS) 5
600
4
account. 400 3
2
200
E. Amplification of Risks Scenario 0
1
0
Jan-08 May-09 Sep-10 Jan-12 May-13 Sep-14 Jan-16 May-17 Sep-18
15. GDP could fall by 2½ percent over two Sources: CEIC, and IMF Staff Calculations.
years under a scenario of rising trade tensions and turmoil in emerging markets. Rising trade
tensions could come in conjunction with a generalized re-pricing of risks in emerging markets and
tighter global financial conditions, leading to capital outflows and dollar appreciation. These external
shocks could be amplified as sharp corrections in Hong Kong SAR’s asset markets dampen
consumption and investment through sizable wealth effects (see Box 1).
Authorities’ Views
16. The authorities broadly agreed with the mission’s assessment of risks and are carefully
monitoring risks and exposures. They agreed that near-term risks have increased, but
underscored that Hong Kong SAR’s strong buffers and robust policy frameworks, including ample
fiscal reserves, the smoothly operating Linked Exchange Rate System underpinned by sizeable
Exchange Fund, strong regulatory and supervisory frameworks and a well-capitalized banking
system, will enable Hong Kong SAR to navigate through these challenges. They underscored that
the Government and the financial regulators will continue to closely monitor developments and
financial markets, with a view to ensuring financial stability.
• Trade tensions. The authorities generally share the mission’s view that a further escalation in
trade tensions between the US and Mainland China, together with its repercussions on global
economic sentiment, trade and investment activities, and financial markets, could be a major
source of downside risk to the Hong Kong SAR’s economic outlook. The direct impact of tariffs
through the trade channel is not expected to be large, however indirect impacts through
confidence effects and financial markets and those affecting the Asian value chain could be
much larger, but are highly uncertain.
• Faster-than-expected U.S. monetary policy normalization could potentially trigger sizeable
outflows from Hong Kong SAR after years of easy monetary policy globally. Fed rate hikes,
combined with the uncertainties associated with the economic and financial market impacts of
the trade disputes, have already affected investor sentiment and contributed to some capital
3
Despite increased uncertainty surrounding the RMB’s outlook, the average daily turnover in renminbi Real Time
Gross Settlement system remains high at about RMB1trillion, in part underpinned by active forex transactions in the
CNH market and cross-border investment flows through the Stock and Bond Connect schemes.
14 INTERNATIONAL MONETARY FUNDPEOPLE’S REPUBLIC OF CHINA—HONG KONG SAR
outflows. That said, contagion to Hong Kong SAR from emerging markets’ outflows has been
limited.
• Disruptive correction in the property market. Eight rounds of macroprudential measures left
banks well prepared for the first-round impact of a correction in house prices. Even accounting
for second-round effects, stress tests indicate that banks’ solvency positions would not breach
safe regulatory thresholds.
• Mainland exposures. Tight underwriting standards have been maintained, and the NPL ratio for
this lending remained below 1 percent during the 2015-16 episode of market stress in Mainland
China. The HKMA also pays close attention to credit mitigation actions, like guarantees or
collateral, to make sure they are enforceable. While the share of exposures to POEs has risen,
these remain to less risky sectors.
SIGNIFICANT BUFFERS IN PLACE
17. Many years of prudent macroeconomic policies left Hong Kong SAR with significant
buffers to weather these shocks.
• External. Despite the recent interventions as part Various Buffers
of the operation of the currency board, FX 90 160
reserves currently stand at around 126 percent of 80 Fiscal reserves (% GDP) Capital adequacy ratio (%)
140
LTV of new loans approved (%) Foreign reserves (% GDP, RHS)
GDP, or twice the monetary base. The current 70
120
account is in surplus and the net international
60
100
50
investment position is equivalent to 409 percent 40
80
of GDP, one of the largest in the world, and a 30
60
strong buffer against external shocks. 20
40
10 20
• Fiscal. Prudent fiscal management and the strong 0
08Q1 11Q1 14Q1 17Q1 17Q4 18Q3
0
real estate market allowed Hong Kong SAR to Sources: Haver Analytics, and IMF Staff Calculations.
accumulate fiscal reserves of 41.4 percent of GDP.
Budgetary debt remains negligible at 0.1 percent of GDP, 4.6 percent if considering the wider
General Government, and are more than offset by the official assets. Staff and the authorities
project fiscal surpluses in the coming 5 years, and staff estimates that fiscal reserves will increase
to HK$1.5 trillion (41 percent GDP) by 2023.
• Banks. Banks’ capital buffers and liquidity positions remain strong. The Common Equity Tier 1
capital ratio stood at 15.3 percent in Q2 2018, significantly above Basel III standards. Banks’
significant holdings of high-quality liquid assets—a cushion against funding pressures—kept the
liquidity coverage ratio at 158 percent in Q3, well above the international requirement of
90 percent. Asset quality remained high, and net interest margin widened to 1.6 percent,
boosting profitability. However, systemic risks arise from banks’ high and increasing exposure to
Mainland China and to the overvalued property market, amid rising household leverage.
INTERNATIONAL MONETARY FUND 15PEOPLE’S REPUBLIC OF CHINA—HONG KONG SAR
POLICY CHALLENGES
The authorities’ macroeconomic policies continue to be guided by the principles of a lean and efficient
government and a reliance on market forces with flexible and efficient markets for goods, labor and
capital, all of which have served Hong Kong SAR well. The main policy lever is fiscal policy, with
monetary and exchange rate policies constrained by the Linked Exchange Rate System, which has
served as an anchor of stability. The main fiscal policy challenge is to guard the economy against
near-term shocks while preparing for longer-term challenges. Going forward, preserving financial
stability, increasing housing supply to contain the housing price boom, increasing spending to combat
elevated inequality and impending aging pressures will be key to securing growth.
A. Ensuring Continued Financial Stability
18. Robust financial regulation and supervision should help weather domestic and foreign
shocks.
• Banking, securities and insurance sectors. The authorities have implemented all the main
recommendations from the 2014 FSAP (See Appendix IV). The next FSAP is scheduled for 2019.
The implementation of Basel III requirements remains on track. Given the large credit gap
and the overvalued housing market, the countercyclical capital buffer has been appropriately
set at 1.875 percent and is planned to increase to 2.5 percent in 2019. To ensure stability of
banks’ liquidity positions, the authorities have introduced the net stable funding ratio.
Detailed implementation of the resolution framework has progressed with new loss-
absorbing capacity requirements for authorized institutions becoming operational by year-
end. These ensure that systemic institutions hold sufficient financial resources to absorb
losses and can be re-capitalized in case of failure.
Supervision of bank loans to property developers has been appropriately strengthened
through higher capital charges for those exposed to developers offering high-LTV
mortgages. Mainland China-related exposures are also closely monitored.
The development of a risk-based capital regime for insurance companies is in the Phase-2,
with a focus on detailed rules for quantitative requirements.
Stock exchange listing rules have been eased to allow dual class stocks with the aim to
attract more IPOs.
• Anti-Money Laundering/Combating the Financing of Terrorism (AML/CFT). The enactment
of the Anti-Money Laundering and Counter-Terrorist Financing (Amendment) Ordinance and the
Companies (Amendment) Ordinance in 2018 is an important step to better align Hong Kong
SAR’s AML/CFT legal framework with Recommendations of the Financial Action Task Force
(FATF) including with respect to the risk-based approach. Their effective implementation is
16 INTERNATIONAL MONETARY FUNDPEOPLE’S REPUBLIC OF CHINA—HONG KONG SAR
crucial to preserve Hong Kong SAR’s reputation as a leading global financial center, in particular
in light of the ongoing FATF evaluation. Some progress has been made 4 and these efforts
should be advanced to enhance effectiveness of AML/CFT measures.
19. …but continued efforts are necessary to counter potential risks.
• The rapid growth of household bank loans deserves continued intensified scrutiny. To
strengthen risk management of this type of lending, the HKMA required banks to adhere to
prudent underwriting standards such as setting maximum loan tenor and debt-servicing ratio
limits in extending personal loans; longer tenor loans are usually subjected to lower debt-
servicing ratio limits. In general, banks have maintained prudent credit limits, conservative
collateral valuation and prompt margin call mechanisms for personal lending.
• Margin lending by brokers has also risen rapidly and the Securities and Futures Commission’s
proposal to impose quantitative limits to their leverage and concentrated exposures is
warranted. The HKMA and the Securities and Futures Commission should continue to cooperate
closely to monitor brokers’ leverage through the banking system.
• Lending by property developers should continue to be monitored closely. The authorities should
consider measures to extend the regulatory perimeter to reduce regulatory arbitrage.
20. Continued efforts to support healthy development of the fintech sector will be key to
bolster Hong Kong SAR’s standing as a regional financial center. A number of initiatives are
currently underway:
• The HKMA launched an Open Application Programming Interface Framework for the banking
sector in July 2018 to encourage greater banking sector competition and innovation 5; all retail
banks will be required to have open API at the end of the implementation, which will take place
over four phases.
• The revised Guidelines on Authorization of Virtual Banks was issued in May 2018.
• The Faster Payment System, allowing the use of emails and mobile phones for payments in
Hong Kong dollars and RMB across 21 banks and ten e-wallets, was launched in September
2018 and supports instant, multi-currency payments on a 24/7 basis.
• The HKMA is strengthening collaboration with authorities in other jurisdictions to support
innovation and information sharing. A distributed ledger technology-based trade finance
platform – eTradeConnect – was launched in October 2018. Meanwhile, the Enhanced Fintech
4
Banks improved their AML/CFT frameworks to target high-risk areas, resulting in a 25 percent increase in the
number of reported suspicious transactions in 2017. The Fraud and Money Laundering Intelligence Taskforce,
comprising representatives of the police, the HKMA, and the banking sector, was established on a pilot basis.
5
An open API is a publicly-available application programming interface that provides public access to software
applications.
INTERNATIONAL MONETARY FUND 17You can also read