A Costly Diagnosis Subsidizing coal power with Albertans' health - March 2013 - the lung association
←
→
Page content transcription
If your browser does not render page correctly, please read the page content below
A Costly Diagnosis
Subsidizing coal power with Albertans’ health
March 2013

A Costly Diagnosis
Subsidizing coal power with Albertans’ health

                  March 2013

                               Canadian Association of
                                Physicians
                                    for the
                               Environment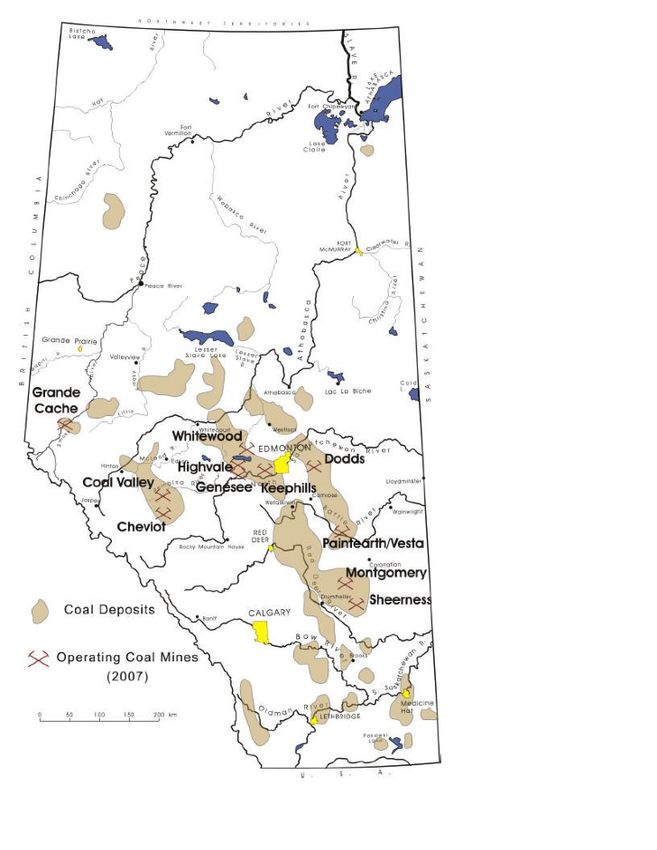
A Costly Diagnosis: Subsidizing coal power with Albertans’ health
Kristi Anderson, Tim Weis, Ben Thibault, Farrah Khan, Beth Nanni, and Noah Farber
March 2013

Production management: Kevin Sauvé
Editor: Roberta Franchuk
Additional contributors: Simon Dyer, Tom Marr-Laing
Cover design: Steven Cretney
© 2013 The Pembina Foundation, The Asthma Society of Canada, The Canadian Association of
Physicians for the Environment, The Lung Association, Alberta & Northwest Territories and The
Pembina Institute.
All rights reserved. Permission is granted to reproduce all or part of this publication for non-
commercial purposes, as long as you cite the source.
This report was prepared for the Pembina Foundation for Environmental Research and Education
by the Pembina Institute, The Canadian Association of Physicians for the Environment, The
Asthma Society of Canada and The Lung Association, Alberta & Northwest Territories. The
Pembina Foundation is a national registered charitable organization that enters into agreements
with environmental research and education experts to deliver on its work.

ii                                                                                 A Costly Diagnosis
About the Asthma Society of Canada
                                       The balanced voice for asthma in Canada.
                                 The Asthma Society of Canada (ASC) is a national charitable
                                 volunteer-supported organization solely devoted to enhancing the
quality of life and health for people living with Asthma and Associated Allergies through
education and research. Since its inception in 1974, the ASC provides a variety of asthma
education and awareness programs, funds many research projects (to gain a better understanding
of the disease and how it can be better managed) and has gained a reputation for providing high
quality Asthma education and information to Canadian asthma consumers.

About the Canadian Association of Physicians for the
Environment
      Canadian Association of   The national voice of physicians on issues of health and the environment.
 Physicians             CAPE is a group of physicians, allied health care practitioners and
     for the
Environment            citizens committed to a healthy and sustainable environment. As an
                       organization composed mostly of physicians, CAPE brings its health
expertise to environmental issues and is an important voice for environmental health in Canada.
CAPE addresses issues of environmental degradation by educating health care professionals and
the public, through advocacy and in close cooperation with partner groups. CAPE is concerned
about Ecosystem Health, Human Health and Sustainable Development.

About the Lung Association, Alberta & Northwest Territories
                                               Healthy lungs and clean air so we can all breathe easier.
                                        The Lung Association, Alberta & Northwest Territories
                                        (TLA) funds critical research and delivers tools, resources
and support to individuals, families, employers and government to build healthy communities.
TLA’s efforts are driven by our mission to prevent lung disease and promote lung health with a
vision of healthy lungs and clean air so we can all breathe easier.

About the Pembina Institute
                                Leading Canada’s transition to a clean energy future.
                        The Pembina Institute is a national non-profit think tank that advances
                        clean energy solutions through research, education, consulting and
advocacy. It promotes environmental, social and economic sustainability in the public interest by
developing practical solutions for communities, individuals, governments and businesses. The
Pembina Institute provides policy research leadership and education on climate change, energy
issues, green economics, energy efficiency and conservation, renewable energy, and
environmental governance.

iii                                                                                     A Costly Diagnosis
The Asthma Society and the Lung Association, Alberta & NWT are charitable
organizations that need your support. The Asthma Society needs support for
providing programs to teach Canadians with asthma about their disease and
how to manage it most effectively. The Lung Association relies on generous
donors to help advocate for clean air, support those affected by lung disease,
and fund vital research.
www.asthma.ca/corp/help/donate.php www.ab.lung.ca/site/donate
The Pembina Institute and CAPE are non-profit organizations that need your
support to continue providing independent analysis of the major environmental
health and energy policy issues in Canada. Please become a donor today:
www.pembina.org/donate www.cape.ca
Acknowledgements
This research was made possible by generous financial support from the Oak Foundation, the
Pembina Foundation as well as the Canadian Health and Environment Education and Research
Foundation.
The authors would like to sincerely thank the advisory committee for their contribution to this
report. The members of the advisory committee are: Alvaro Osornio Vargas, M.D.; Dr. Rob
Oliphant, Asthma Society of Canada; Kerri Johannson; John O’Connor, M.D.; Raquel Feroe,
M.D.; Joe Vipond, M.D.; Irena Buka, M.D.; and Dr. Mishka Lysack.
iv A Costly DiagnosisForeword In the year 2000, I introduced a course for undergraduate medical students called Ecosystem Health. The course was designed to help medical students understand the relationship between human health and the environment. A key component of that course was education about climate change and its impact on the environment and on human health. The course outlined how the earth had warmed considerably over the past 30 years and that this warming is not a “normal fluctuation” in earth temperatures. Carbon dioxide levels had increased markedly and the theory was and is that this “greenhouse gas” would lead to a hotter earth. My hope in the year 2000 was to convince medical students and the public at large that global warming was real. I thought that the challenge at the time to was in the convincing – convincing the majority of the population that global warming was a worry for humanity. I thought that once we understood that global warming was real and that it was a problem, I was confident that we as responsible humans would collectively act to stop it. I was dead wrong. We are seeing more and more of the severe weather events that were predicted a decade or so ago. Global warming is now real and recognized as a problem by most, but far too little is being done to stop it. The challenge has unfortunately changed from proving the existence of global warming to doing something significant about it — making real changes in our energy use and how energy is generated. Global warming is beginning to threaten the existence of many if not all on the planet, particularly those who are poor and live a marginal existence — the very people who are powerless to do anything about global warming. Those who can make the difference, those people in power, the ones that produce the most carbon dioxide, are not acting for fear of slowing economic growth. Economic growth, and energy production and consumption, seem to trump environmental responsibility, and in turn threaten the future of human existence. How do Canadians begin to save the world? We begin where we can win and make a big difference in reducing our carbon footprint. The abolition of coal in power generation is the one place to begin. Using coal to produce electricity is dirty in many ways. The mining, transportation and burning of coal leads to significant carbon dioxide and other greenhouse gases being released into the air. The combustion of coal pollutes the air, causing illness and death in more people than any other method of energy generation. According to figures in Scientific American, the mining, transportation and burning of coal for electricity generation is responsible for more deaths per kilowatt of electricity generated than any other source of power — a death rate 70 times that of renewable energy sources. This does not include the effects of the air pollution it generates which results in even more illness-related deaths, asthma, pneumonia and cardiovascular events. The Province of Ontario has taken a bold leadership position by phasing out coal-generated electricity. Ontario recognizes the disease burden coal-generated electricity places on its present and future residents. It is critical for other provinces and jurisdictions to follow Ontario’s lead. Once Canada becomes coal free, we truly can influence other countries by example. Once Canada is coal free, we can leverage other countries such as the United States to do the same, given the harm their emissions from coal electricity generation has on Canadians. It is a great opportunity for Canada to lead the world by acting environmentally responsibly. v A Costly Diagnosis
This past year, I was blessed with the birth of my first grandchild. He is loving, trusting and
oblivious to the perils of climate change. We all now know that climate change is real and a real
threat to human existence as we know it. Someday my grandson will know about climate change
and if nothing is done about it, will probably suffer some consequence because of it. Our
children and our grandchildren are coming into a world that has been spoiled by our
overconsumption and reluctance to make the necessary changes to reduce carbon emissions.
How can we fulfill our responsibilities to our children, our grandchildren and our great-
grandchildren? By taking the first major step — phasing out our coal-generated electricity.
John Howard, MD, FRCPC
Chair, Canadian Association of Physicians for the Environment (CAPE)
Professor of Paediatrics and Medicine
Schulich School of Medicine
London, Ontario, Canada

vi                                                                              A Costly Diagnosis
Contents
Summary ..................................................................................................................................... 1


1.
   Introduction .......................................................................................................................... 4

      1.1
   Coal power in Alberta: past, present and future .............................................................. 4

      1.2
   Scope of report ................................................................................................................ 6


2.
   Coal in Alberta...................................................................................................................... 8

      2.1
   Alberta’s coal deposits .................................................................................................... 8

      2.2
   The coal power fuel life cycle in Alberta .......................................................................... 9

3.
   Air pollution from coal-fired electricity generation and associated health risks ........ 15

      3.1
   Emissions management in Alberta ................................................................................ 15

      3.2
   Nitrogen oxides ............................................................................................................. 17

      3.3
   Sulphur dioxide ............................................................................................................. 19

      3.4
   Mercury ......................................................................................................................... 20

      3.5
   Particulate matter .......................................................................................................... 23

      3.6
   Lead .............................................................................................................................. 26

      3.7
   Cadmium ....................................................................................................................... 28

      3.8
   Dioxins and furans ........................................................................................................ 29

      3.9
   Hexachlorobenzene ...................................................................................................... 29

      3.10
   Arsenic ........................................................................................................................ 30

      3.11
   Polycyclic aromatic hydrocarbons ............................................................................... 31

      3.12
   Ground-level ozone ..................................................................................................... 32

      3.13
   Pollutants in a mixture ................................................................................................. 33

      3.14
   Greenhouse gases ...................................................................................................... 34


4.
   Populations at risk in Alberta ........................................................................................... 41

      4.1
   General population ........................................................................................................ 41

      4.2
   Fetal and newborn health .............................................................................................. 42

      4.3
   Children’s health ........................................................................................................... 43

      4.4
   First Nations health risks ............................................................................................... 44

      4.5
   Health of the elderly and people with chronic health conditions ................................... 45


5.
   Estimates of health damage ............................................................................................. 46

      5.1
   About the modelling ...................................................................................................... 46


vii                                                                                                                          A Costly Diagnosis
5.2
Premature deaths .......................................................................................................... 50
5.3
Asthma .......................................................................................................................... 51
5.4
Hospital admissions and emergency room visits .......................................................... 51
5.5
Summary of ICAP estimates ......................................................................................... 52
5.6
Environment Canada estimates .................................................................................... 53
6.
Health care and public costs of coal to Albertans.......................................................... 56
6.1
ICAP cost estimates ...................................................................................................... 56
6.2
Air Pollution Emissions Experiments and Policy model cost estimates ........................ 57
6.3
Environment Canada cost estimates ............................................................................ 59
6.4
Cost estimates associated with mercury ....................................................................... 59
6.5
Cost comparison summary ........................................................................................... 61
7.
Conclusions ....................................................................................................................... 63
7.1
Finding a level playing field ........................................................................................... 63
7.2
Leadership opportunities for GHG reductions ............................................................... 65
List of Figures
Figure 1. Coal-fired electricity generating units in Alberta (coloured bars denote unit size in MW)
.............................................................................................................................................. 4
Figure 2. Allowed lifespan of existing coal power units in Alberta under federal regulations. ...... 5
Figure 3. Coal deposits in Alberta ................................................................................................. 8
Figure 4. Conventional process for generating electricity from coal ........................................... 11
Figure 5. Schematic of integrated coal gasification combined cycle process ............................. 13
Figure 6. Nitrogen oxide (NOx) emission intensities of Alberta’s coal power units in 2011 relative
to the regulated intensity standard ...................................................................................... 18
Figure 7. Sulphur dioxide (SO2) emission intensities of Alberta’s coal power units in 2011
relative to the regulated intensity standard ......................................................................... 20
Figure 8. Mercury emissions intensities of coal-fired facilities in Alberta in 2011 ....................... 22
Figure 9. Total particulate matter emission intensities of Alberta’s coal power units in 2011
relative to the regulated intensity standard ......................................................................... 25
Figure 10. Provincial dependence on coal-fired electricity and electricity sector GHG intensity 35
Figure 11. Industrial sources of greenhouse gas emissions in Alberta (2010) ........................... 36
Figure 12. Pathways by which climate change impacts human health, with modifying influences
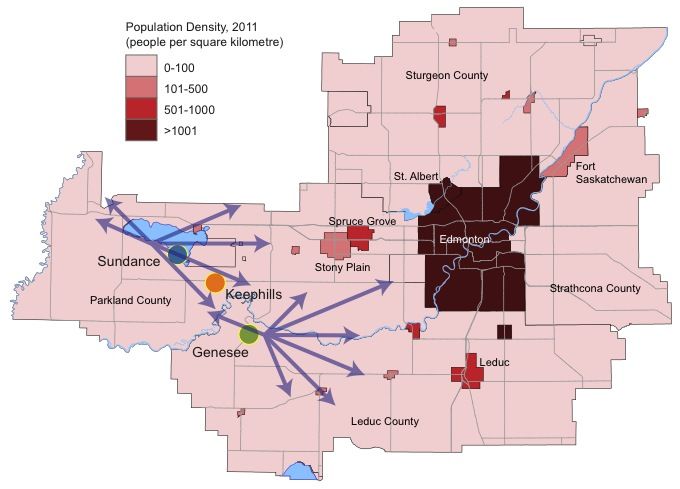
of environmental, social, and health system conditions ...................................................... 37
Figure 13. Coal-fired electricity generating stations near Edmonton, with population density and
prevailing wind directions .................................................................................................... 41
viii A Costly DiagnosisFigure 14. Estimated premature deaths due to air pollution from coal-fired generating stations in
Alberta ................................................................................................................................. 50
Figure 15. Estimated number of asthma symptom days due to air pollution from coal-fired
generating stations in Alberta ............................................................................................. 51
Figure 16. Total economic damages from physical health effects due to air pollution from coal-
fired generating stations in Alberta ..................................................................................... 57
Figure 18. Comparison of greenhouse gas reductions using different end-of-life regulations .... 66
Figure 19. Comparison of cumulative greenhouse gas reductions using different end-of-life
regulations .......................................................................................................................... 67
List of Tables
Table 1. Types of coal and their characteristics ........................................................................... 9
Table 2. Coal type and technology used by coal-fired power stations in Alberta ....................... 12
Table 3. Emissions by coal-fired generating stations within 70 km of Edmonton ....................... 42
Table 4. The Illness Costs of Air Pollution Alberta health damages summary ........................... 48
Table 5. Summary of estimated health effects of air pollution from coal-fired generating stations
in Alberta ............................................................................................................................. 53
Table 6. Cumulative avoided health impacts in Alberta from coal regulations, 2015-2035. ....... 54
Table 7. Health effects of air pollution from coal-fired generating stations in Alberta based on
Environment Canada estimates .......................................................................................... 55
Table 8. Estimate of annual economic damages related to health from emissions from coal-fired
power plants in Alberta based on the Air Pollution Emissions Experiments and Policy
model .................................................................................................................................. 59
Table 9. Cost comparison of estimated economic damages from health impacts associated with
air pollution from coal plants in Alberta ............................................................................... 61
Table 10. Summary of costs of coal-fired electricity in Alberta ................................................... 62
ix A Costly DiagnosisList of Abbreviations BATEA Best Available Technology Economically Available BLIERs Base Level Industrial Emissions Requirements CAAQS Canadian Ambient Air Quality Standards CASA Clean Air Strategic Alliance CCME Canadian Council of Ministers of the Environment CCS Carbon capture and storage CO2e Carbon dioxide equivalent GHG Greenhouse gas HCB Hexachlorobenzene Hg Mercury ICAP Illness Costs of Air Pollution kg Kilogram km Kilometre MeHg Methylmercury MW Megawatt MWh Megawatt-hour NOx Nitrogen oxides O3 Ozone PAHs Polycyclic aromatic hydrocarbons PM Particulate matter PM2.5 Particulate matter with aerodynamic diameters below 2.5 micrometres PM10 Particulate matter with aerodynamic diameters below 10 micrometres SO2 Sulphur dioxide SOx Sulphur oxides µg Microgram VOCs Volatile organic compounds x A Costly Diagnosis
Summary
Coal electricity in Alberta                        Table A. Key emissions from coal plants in
                                                   Alberta
Alberta burns more coal than the rest of
Canada combined. Alberta generated 64 per           Air Emission              2011       % of
cent of its electricity in 2012 by burning coal,                            releases    Alberta
                                                                                         total
higher than the average in the United States of
44 per cent. Coal causes more pollution than        Sulphur dioxide         114,500 t      33
any other source of electricity, including          Nitrogen oxides          71,500 t      10
greenhouse gas pollution as well as air
                                                    Fine particulate
contaminants such as sulphur dioxide and            matter
                                                                             1,780 t       6
mercury that pose health risks. Globally, coal
                                                    Mercury                  216 kg        44
produces more greenhouse gas emissions than
any other fossil fuel.                              Greenhouse gases         43.2 Mt      18.5

Currently there are several discussions
underway that will affect the length of time       Health risks of emissions
that coal plants are allowed to operate in         There is an extensive body of literature
Alberta before reducing different emissions,       dealing with the health impacts of air
ranging from 40 to 50 years beyond their           pollutants. This report provides an overview
original commissioning date. These decisions       of many of the known health risks associated
will have real impacts on air quality in           with the emissions that result from burning
Alberta. As a result it is important to have a     coal for electricity production.
public discussion about the emissions in
Alberta resulting from coal.                       Nitrogen oxides, in addition to being acid rain
                                                   precursors, react in the atmosphere to form
Alberta has six coal plants comprising 18          ground-level ozone, which is linked to the
individual units, which range in size from 150     exacerbation of asthma, as is exposure to
MW to 495 MW for a combined capacity of            sulphur dioxide. Exposure to fine particulate
over 6,200 MW. In 2011, coal plants in             matter — either from direct emissions or
Alberta emitted 33 per cent of the sulphur         formed as a result of sulphur dioxide
dioxide (SO2), 10 per cent of the nitrogen         emissions — is known to affect lung
oxides (NOx), 6 per cent of the fine particulate   development in children. Short-term exposure
matter (PM2.5), and 44 per cent of the mercury     to fine particulate matter has also been
(Hg) from man-made sources in Alberta.             associated with increased incidence of cardiac
Other pollutants emitted by coal plants in         disease. Mercury and lead are pollutants
Alberta include lead, cadmium,                     emitted by coal plants that can affect
hexachlorobenzene, dioxins and furans,             neurological development when exposure to
polycyclic aromatic hydrocarbons, and              sufficient quantities occurs during the early
arsenic. In addition, the 43 megatonnes of         stages of life. A dangerously warming climate
greenhouse gas (GHG) emissions from coal-          increases the medical risks of heat exhaustion
fired electricity plants was only slightly less    and cardiovascular and respiratory diseases
than all of the GHG emissions from all of the      from more frequent and severe heat waves,
oilsands operations combined in 2011.

1                                                                                A Costly Diagnosis
while potentially allowing the introduction of The ICAP model estimates that total economic
new parasites and pathogens. Several damages in Alberta associated with the health
substances emitted by coal plants are known, impacts of air pollution from coal plants are in
probable or possible carcinogens. the range of $300 million annually, which
would translate into approximately 0.7 ¢/kWh.
Estimating damages in Alberta The ICAP results are lower than those of other
estimates — for example, estimates in the
In 2008, modelling by the Canadian Medical United States have ranged from 3.2 to 3.6
Association published a landmark report ¢/kWh, which reflects the lower population
estimating the impacts and costs of poor air densities in Alberta as well as some of the
quality from all sources in Canada. This same progress that has been made to reduce
model, the Illness Cost of Air Pollution emissions. Applying the Air Pollution
(ICAP), was used in this report to estimate the Emissions Experiments and Policy model,
health risks and economic damages of coal- which uses multipliers per pollutant to
fired electricity generation in Alberta. The estimate damages, to Alberta’s emissions
results are compared against Environment profile from coal plants generates an estimate
Canada’s published benefits of limiting the of 2.1¢/kWh in health impact damages.
lives of coal units to a maximum of 50 years, Basing estimates on the regulatory impact
as well as health and economic damage statement of Environment Canada’s Reduction
estimates from models in the United States. of Carbon Dioxide Emissions from Coal-fired
Generation of Electricity Regulation these
The ICAP model incorporates reported levels
health impact costs amount to 1.7 ¢/kWh.
of pollutants in the ambient air, and correlates
known health impacts to population densities Given the complexities of environmental
and forecasts. Based on studies on the health processes, these numbers should not be taken
effects of air pollution, including the chronic as definitive, but rather indicative of the costs
effects of exposure, ICAP estimates health of health risks that are not internalized from
damages in physical terms (i.e., illness rates) pollution.
and economic terms (i.e., monetary damages
associated with air pollution-related illnesses). In addition, Environment Canada determined
the social costs of greenhouse gas emissions to
Isolating reported levels of pollution from coal lie in a range of $26-104 per tonne. The low
plants in Alberta, and accounting for expected end of this range translates into an additional
retirement dates, the model suggests there are 2.9 ¢/kWh. Thus, including human health
700 visits to Alberta’s emergency departments risks, the total social cost of burning coal for
and 80 hospital admissions related to electricity is at minimum 3.6-5.0 ¢/kWh.
respiratory and cardiovascular ailments due to These costs do not include the costs associated
short-term exposure to air pollution from coal with environmental impacts from air
plants in Alberta annually. Exacerbation of pollution, and are at the very low end of
asthma from air pollution is estimated to be climate change estimates.
responsible for over 4,800 asthma symptom
days, which are days when asthma sufferers
must miss work or school due to their illness.
The model estimates that long-term exposure
to air pollution from coal plants is a
contributing factor to the premature deaths of
more than 100 Albertans each year.
2 A Costly DiagnosisTable B. Summary of costs of coal-fired same regulations do not require this phase-out
electricity in Alberta to be complete in Alberta until 2062.
Cost (¢/kWh)
Ontario’s coal fleet was once the size of
Minimum greenhouse gas social
2.9 – 11.6 Alberta’s, yet it will be phased out completely
cost by the end of 2014. Nova Scotia, which was
Economic damages from health
0.7 – 2.1
once more dependent on coal than Alberta,
impacts from air pollution has legislated targets that require 40 per cent
Economic damages from renewable electricity by 2020, which will cut
environmental impacts from air not calculated its coal dependence in half. In seeking an
pollution equivalency agreement with the federal
Total cost to society 3.6 – 13.7 government, Alberta should not be copying
Pool price (2012) 6.6
the weak aspects of the federal regulations,
but should use the opportunity to show
True cost of electricity from leadership by phasing out existing plants
10.2 – 20.3
coal
faster than the 50-year lives allowed under the
federal regulations. Such leadership would not
The current electricity market does not only significantly reduce greenhouse
internalize the health and environmental costs emissions but also have the co-benefit of
associated with its pollution from coal reducing the other health-damaging pollutants
burning, placing renewable energy at a market and their associated costs to Albertans.
disadvantage. Use of full-cost accounting for
electricity from coal would foster cleaner
sources of electricity as coal plants reach the
end of their lives.
Conclusions
There is a growing awareness of the price that
society pays for generating electricity from
coal, both in terms of climate change and
health impacts. Some of these costs are
starting to be applied to existing plants as
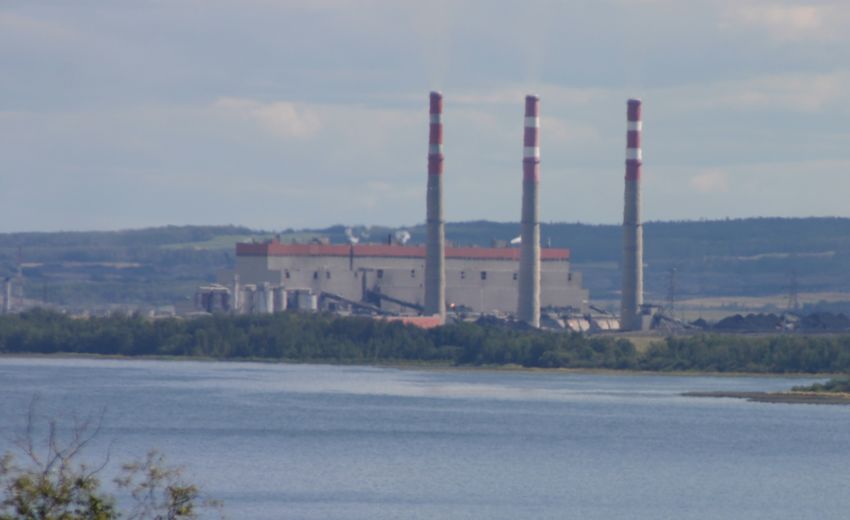
Sundance coal plant
mercury capture requirements increase and to
Photo David Dodge, The Pembina Institute
newer plants as stricter air NOx and SO2
requirements are implemented. However, air
pollutants and greenhouse emissions from
Alberta’s sizeable existing fleet are not fully
internalized.
Pricing in the additional health and
environmental costs of coal puts coal on par
with numerous sources of low and non-
polluting sources of electricity.
New federal greenhouse gas regulations mean
that an eventual phase-out of conventional
coal is inevitable in Canada, although those
3 A Costly Diagnosis1. Introduction
1.1 Coal power in Alberta: past, present and future
Unlike most Canadian provinces, Alberta generates the majority of its electricity by burning
coal. Alberta’s electricity system burns more coal than the rest of Canada’s provinces combined.1
In 2011, over two-thirds of the electricity traded on Alberta’s electricity market was generated
from coal. Not only does this make Alberta’s electricity system the most greenhouse gas (GHG)
intensive in Canada, it also means that the generation of electricity in Alberta results in major
releases of air pollutants and toxic contaminants that have numerous known health impacts.
A L BERTA
280
280
406
392
392
392
150
Milner
406
406
495
Sundance
Keephills
Grande
Cache
370
150
150
Edmonton
410
410
495
Battle River
Genesee
Red Deer
380
380
Calgary Sheerness
Scale
75 0 75 150 225
km km
Lethbridge
Figure 1. Coal-fired electricity generating units in Alberta (coloured bars denote unit size in MW)
2
Data source: Milner Power, TransAlta, Atco Power; map adapted from Natural Resources Canada
1
Statistics Canada, “Fuel consumed for electric power generation, by electric utility thermal plants,” CANSIM Table 127-
0004, (2010 data). www5.statcan.gc.ca/cansim/
2
Milner Power Inc., “HR Milner Generating Station,” www.milnerpower.ca/; TransAlta, “Plants in Operation,”
www.transalta.com/facilities/plants-operation; ATCO Power, “Battle River Coal-Fired Generating Station,”
http://www.atcopower.com/Our+Facilities/North+America/Battle+River+%28AB%29/Battle_River_Coal_Fired_Generati
ng_Station.htm; Natural Resources Canada, “Alberta,” The Atlas of Canada,
http://atlas.gc.ca/site/english/maps/reference/provincesterritories/alberta
4 A Costly DiagnosisIntroduction
Alberta’s existing coal units are located in the central and south-central areas of the province (see
Figure 1) and range widely in age from the two-year-old Keephills 3 unit that was commissioned
in 2011, to the 44-year-old Battle River 3 unit, which has been operating since 1969. This means
a broad variance in efficiency, pollution control measures, and rates of pollution emissions —
and a long timeframe of dates over which these plants will be allowed continue to operate.
Recently established federal GHG regulations allow most existing coal plants to continue to
operate without any regulatory impact until they reach their fiftieth year of operation,3 at which
point they must either close or incorporate carbon capture and storage (CCS) technologies that
would reduce their greenhouse gas emissions by over half of their current rate. CCS is presently
expensive so unless there are major cost reductions, it is likely that most units in Alberta will be
shut down when they reach the federal age limit, as illustrated below in Figure 2.
Keephills 3
Genesee 3
Genesee 2
Sheerness 2
Genesee 1
Sheerness 1
Keephills 2
Keephills 1
Battle River 5
Sundance 6
Sundance 5
Sundance 4
Sundance 3
Battle River 4
Sundance 2
HR Milner 1
Sundance 1
Battle River 3
1960 1970 1980 1990 2000 2010 2020 2030 2040 2050 2060 2070
Year
Figure 2. Allowed lifespan of existing coal power units in Alberta under federal regulations.
Bar thickness is proportional to plant size.
4
Data source: Environment Canada
Regulations which may shorten the expected lives of some of the units in Alberta are the
provincial limits on sulphur oxides (SOx) and nitrogen oxides (NOx) that were negotiated over a
decade ago by the Clean Air Strategic Alliance (CASA). Under these regulations, each unit has a
specified NOx and SOx limit established from baseline performance from 2000–2003. Units can
operate without meeting this limit until the end of their “design life”, which is usually either the
3
Units are allowed to operate until their fiftieth anniversary of commissioning unless the year 2019 or 2029 falls between
their forty-fifth and fiftieth year of operation, in which case units will be required to comply with the regulation on the last
day of 2019 or 2029.
4
Calculations based on Government of Canada, Reduction of Carbon Dioxide Emissions from Coal-fired Generation of
Electricity Regulations SOR/2012-167. http://www.gazette.gc.ca/rp-pr/p2/2012/2012-09-12/html/sor-dors167-eng.html
5 A Costly DiagnosisIntroduction expiration of their power purchase agreement or 40 years after start-up, whichever is longer. Once the unit has reached the end of its design life it must comply with a “post-design-life intensity target,”5 either physically or using credits accumulated by it or another plant. This requirement could potentially change the viability of a coal plant, leading to it closing before it reached the federal limits, but if enough credits are available it is likely that most if not all coal units will be operated as long as they can, particularly as they are highly profitable once they are fully amortized. In the scenario that the federal coal regulations are the dominant policy governing the time allowed for coal units to operate unabated, no existing coal units in Alberta will feel an impact of these regulations until the last day of 2019. By the end of 2025, over twelve years away, the regulations will have impacted less than one-sixth of the coal capacity in the province. Nearly two-thirds will remain immune from any greenhouse gas emissions control through 2029. While the vast majority of the coal plants in the province date from the 1970s and 1980s, there are units in operation today that will be allowed to continue to operate through the 2030s, 2040s, and even one into the 2060s. Alberta’s coal power legacy, still dominant in today’s electricity grid, could remain relevant through the first half of this century — unless new policies arise at the provincial or federal level. Alberta has seen a 14 per cent increase in coal capacity from 2002 to 20126. Despite a federal narrative about Canada “phasing out coal” in the short term,7 Alberta is actually expected to experience a continued increase in coal-fired electricity in the next few years. Two units, Sundance 1 and 2, collectively known as Sundance A, have been offline since December 2010 due to an unexpected and catastrophic failure. As a result of a July 2012 arbitration decision, these units will be required to return to service, resulting in a 560 MW increase in capacity compared to 2012. The impacts of coal power in Alberta are relevant today, and will continue to be relevant for years and perhaps decades to come, and deserve appropriate attention to inform good public policy on electricity generation in the province. 1.2 Scope of report As described in the preceding section, Alberta is poised to continue to burn millions of tonnes of coal every year for decades to come in order to generate electricity. Given the known air pollutants and toxins that are released from burning coal, this research set out to examine the risks to human health from the continued use of coal in Alberta. This research is not an epidemiological study, but rather an attempt to collect known literature about the health impacts of coal, and relate that to the current and forecast pollutants released from burning coal for electricity generation in Alberta. Using this data, models were used to estimate the order of magnitude of human health impacts and costs. Additional work needs to be 5 Post-design-life requirements are 0.8 t/GWh of SOx and 0.69 t/GWh of NOx until the unit reaches 50 years, after which any unit must comply with the best available technology economically available, which become more stringent over time. 6 Alberta Electric System Operator, 2012 Annual Market Statistics Data File (2012), www.aeso.ca/downloads/2012_Annual_Market_Stats_Data_File.xlsx 7 Environment Canada, “Government of Canada to Regulate Emissions from Electricity Sector”, news release, June 23, 2010. http://www.ec.gc.ca/default.asp?lang=En&n=714D9AAE-1&news=E5B59675-BE60-4759-8FC3-D3513EAA841C 6 A Costly Diagnosis
Introduction

done to refine and better understand all of the human health impacts; this research lays a
foundation on which to build.
The focus of this work is on the air pollutants resulting from coal-fired electricity generation, but
there are also notable health impacts from other parts of the coal life cycle such as mining and
processing. Furthermore, health impacts resulting from climate change may in fact be the most
significant in the long term, albeit indirectly.

7                                                                                  A Costly Diagnosis
2. Coal in Alberta
While this report focuses specifically on the health impacts of air pollution from coal-fired
electricity generation, it is important to situate this activity and its effects within the broader
Alberta coal industry. Other stages of coal power’s fuel life cycle pose health risks, notably coal
mining. The majority of coal mined in Alberta is destined for electricity generation within the
province; as such, coal demand for electricity generation in Alberta is the major determinant of
coal mining output in the province. Therefore, the impacts of upstream coal activities —
beginning with mining — are relevant for a complete understanding of coal power’s
consequences in the province. These upstream stages deserve their own detailed treatment, but
are reviewed summarily here simply to acknowledge their relevance in a more comprehensive
conversation about coal power’s impacts.

2.1 Alberta’s coal deposits
Alberta holds 70 per cent of Canada’s coal
deposits or 33.3 billion tonnes (68 per cent of
which is estimated to be technically
recoverable).8 The location of the coal deposits
in Alberta can be seen in Figure 3.9 Alberta is
also Canada’s largest coal producer, producing
25–30 million tonnes of coal a year from 11
mines.
Coal is categorized based on carbon and
moisture content, energy value and chemical
composition. The four major types of coal are
lignite, sub-bituminous, bituminous and
anthracite, in order of decreasing carbon
content (see Table 1). In Alberta, sub-
bituminous and bituminous are the dominant
coal types that are mined and used for
electricity generation. In 2011, 37 million
tonnes of coal was mined in Alberta, 23.2                  Figure 3. Coal deposits in Alberta
million tonnes of which was sub-bituminous                 Source: Alberta Environment and Sustainable Resource
and 13.8 million tonnes bituminous.10
                                                                       11
                                                           Development

Approximately 80 per cent of the coal mined in Alberta is used for electricity generation. Most
of the remaining coal is shipped through British Columbia to international markets, in particular
8
 EUB, ST98-2012Alberta’s Energy Reserves 2011 and Supply/Demand Outlook 2012-2021 (2012), 18.
www.ercb.ca/sts/ST98/ST98-2012.pdf
9
  Alberta Environment and Sustainable Resource Development, “Coal Mines.” http://environment.alberta.ca/02251.html
10
   Alberta Energy, “Coal Statistics.” www.energy.alberta.ca/coal/643.asp
11
   Alberta Environment and Sustainable Resource Development, “Coal Mines.”

8                                                                                                A Costly Diagnosis
Coal in Alberta
Asia, where it is used in the production of steel and iron. Only small amounts of Alberta’s coal
are exported to other provinces in Canada.12
Table 1. Types of coal and their characteristics
Characteristics
Type of coal Carbon Moisture Use in Alberta
Hardness
content (%) content (%)
Lignite Soft 25-35 30-60 Not produced in Alberta
Subbituminous Medium soft 35-45 10-45 Electricity generation
Bituminous Medium hard 45-86 2-15 Export
Anthracite Hard 86-97Coal in Alberta
cent had undergone some form of reclamation by that time but only 16 per cent of the mined area
received reclamation certificates from Alberta Environment. Reclamation is typically insufficient
to bring about habitat restoration. Upon decommissioning, all of the mined area has been
converted to agricultural land rather than the mosaic of forests, wetlands and farms that existed
on the landscape prior to mining.19
Criteria air contaminants, including sulphur oxides, oxides of nitrogen, volatile organic
compounds, carbon monoxide, particulate matter less than 2.5 micrometres in diameter, and
ammonia are released during open mining processes.
Coal mining also results in emissions of greenhouse gases. Methane gas is frequently present in
coal seams, and is released as the seams are cut to extract the coal. Because methane is a
greenhouse gas 23 times more potent than carbon dioxide, fugitive methane releases are of
potential concern.
Overall, however, because of the enormous quantity of GHGs and criteria air pollutants emitted
during combustion of coal, upstream activities, while not negligible, are a relatively small
component of the coal-fired power plant life cycle, at 77 kg of carbon dioxide equivalent per
MWh (CO2e/MWh) out of a total life cycle emission factor of 1,029 kg CO2e/MWh.20
2.2.2 Transport
In Alberta, most coal mines are adjacent to coal-fired power plants. These mines are known as
“mine-mouth” operations because coal is removed from the earth and moved directly to a nearby
power generation plant.21
2.2.3 Combustion
To produce electricity, coal is typically crushed and then pulverized before it is burned to boil
water, creating high-pressure steam, which turns a turbine shaft. The shaft is connected to an
electrical generator, which produces electricity.
19
D. Schindler et al., Lake Wabamun: A Review of Scientific Studies and Environmental Impacts, prepared for Alberta
Environment (2004). Available at http://www.wwmc.ca/pdf/Lake Wabamu - A Review of Scientific Studies and
Environment.pdf
20
Hidden Costs of Energy, 82
21
Coal Association of Canada, “Markets,” 2012. www.coal.ca/main-markets/
10 A Costly DiagnosisCoal in Alberta
Figure 4. Conventional process for generating electricity from coal
22
Source: University of Kentucky
Because energy content in coal is largely carbon-based, the exhaust gas is predominately carbon
dioxide, but also contains steam, nitrogen oxides and sulphur dioxide as well as airborne heavy
metals. Coal is formed from prehistoric plants that have been compressed under heat and
pressure over millions of years. Over the millions of years that the coal formed, trace amounts of
toxic heavy metals such as mercury, cadmium and lead had time to accumulate in the coal in
small but significant proportions. Post-combustion technologies can be added to reduce the level
of these pollutants, including carbon dioxide. Pollution reduction technologies are expensive, and
are rarely voluntarily added to coal power plants unless they are required by government
regulation.
Coal provided over two-thirds of electricity generation in Alberta in 2011, amounting to 39,190
GWh of electricity — more than all other provinces combined. Saskatchewan, Ontario, Nova
Scotia and New Brunswick also burn coal to generate electricity, but in 2011, all of these
provinces together generated 33,411 GWh of coal-fired electricity.23 A decade ago, Ontario was
second to Alberta in the quantity of coal it used for electricity generation, but Ontario has
successfully phased out almost 90 per cent of its coal-fired electricity generation, with the
remainder to be completely eliminated by the end of 2014.
While coal-fired electricity makes up the majority of electricity sold on Alberta’s market, the
generating stations are concentrated in four locations across the province, as shown in Figure 1.
The vast majority of the coal burning in Alberta occurs approximately 70 km west of Edmonton,
22
University of Kentucky, “Uses of Coal.” http://www.uky.edu/KGS/coal/uses_of_coal.htm
23
Statistics Canada, “Electricity generated from fuels, by electric utility thermal plants,” CANSIM Table 127-0006.
www5.statcan.gc.ca/cansim/
11 A Costly DiagnosisCoal in Alberta
where 10 units comprising close to 4,700 MW (out of the province’s 6,286 MW of coal-fired
power generation) operate.24 The 10 units consume approximately 19.3 million tonnes of coal
per year. Two units totaling 760 MW of generation operate in the Sheerness power plant located
approximately 200 km northeast of Calgary, and 670 MW of generation operate in the Battle
River power plant, less than 125 km east of Red Deer. A single, relatively small 150 MW unit
operates near Grande Cache.
Coal-fired generating facilities in Alberta use various technologies to burn coal. The two most
modern units in Alberta (Genesee 3 and Keephills 3) use supercritical boilers operating at high
temperature and pressure and employ a high-efficiency steam turbine. Together, these
technologies result in close to 18 per cent less coal use per megawatt-hour of electrical energy
than conventional processes25, reducing the intensities of all emissions (amount of pollution
emission per unit of electricity generated).26 The boiler technologies and types of coal used in
some of Alberta’s coal-fired power plants are listed in Table 2. The other units in the province
use subcritical boilers to produce the steam to generate electricity from burning coal.
Table 2. Coal type and technology used by coal-fired power stations in Alberta
Annual coal
Facility Technology Fuel Mine consumption
(million tonnes)
Battle River 3, 4 & 5 Boiler Subbituminous Paintearth and Vesta 2.9
27
Genesee 1 & 2 Boiler Subbituminous Genesee
5.5
Genessee 3 Supercritical boiler Subbituminous Genesee
28
Keephills 1 & 2 Boiler Subbituminous Highvale (see Sundance)
Keephills 3 Supercritical boiler Subbituminous Highvale 1.8
Milner Boiler Coal washings Coal Valley Up to 0.5
Sheerness Boiler Subbituminous Montgomery and
3.8
Sheerness
Sundance Boiler Subbituminous Highvale 12
(includes Keephills 1 & 2)
Total 26.5
29
Data source: Industcards , or as indicated
Another technology for generating electricity from coal is integrated gasification combined cycle
(IGCC). An IGCC power plant uses a partial combustion process that converts coal into
“syngas” (synthetic gas), a mixture of carbon monoxide and hydrogen, which is then used to fire
24
Alberta Energy, “Electricity Statistics,” 2012. www.energy.alberta.ca/Electricity/682.asp
25
National Energy Board, Coal-Fired Power Generation – An Overview, Energy Brief, September 2008, 1.
http://www.neb-one.gc.ca/clf-nsi/rnrgynfmtn/nrgyrprt/lctrcty/clfrdpwrgnrtn2008/clfrdpwrgnrtnnrgybrf-eng.pdf
26
TransAlta, “Genesee 3,” 2011. http://www.transalta.com/facilities/plants-operation/genesee-3
27
Capital Power, “Genesee Mine,” 2011.
www.capitalpower.com/community/consultationengagement/geneseemine/Pages/default.aspx
28
TransAlta, “Highvale Mine,” 2012. www.transalta.com/facilities/mines-operation/highvale-mine
29
Industcards, “Power Plants Around the World: Coal-fired Plants in Canada,” 2012. www.industcards.com/st-coal-
canada.htm
12 A Costly DiagnosisCoal in Alberta the combustion turbine in a combined-cycle power plant (see Figure 5), similar to a natural gas plant. Plants operating with this technology are more efficient in their power production, have lower greenhouse gas emissions, and can scrub pollutants like sulphur and heavy metals from the fuel before it is burned. This technology also lends itself to deployment of carbon capture and storage.30 There are currently no IGCC plants in Canada but there are three operating in the United States.31 Figure 5. Schematic of integrated coal gasification combined cycle process Source: National Energy Board32 Another method of generating electricity from coal is the fluidized bed power plant. This is a technology that mixes limestone with the burning coal to absorb sulphur and, by reducing combustion temperature, reduces the formation of NOx. The fluidized bed operates at a lower temperature than a supercritical coal-fired plant so it uses slightly more fuel for the same level of electric output. There is one fluidized bed power plant in Canada, located in Point Aconi, Nova Scotia.33 Combustion of coal has numerous impacts on the surrounding environment. Acid deposition resulting from the emission of NOx and SO2 causes acidification of soils, streams and lakes.34 Though much of Alberta has alkaline soils that can temper the effects of acidic precipitation, there are areas that have limited buffering capacity and are therefore sensitive to acid deposition. 30 Ibid. 31 National Energy Board, Emerging Technologies in Electricity Generation – An Energy Market Assessment, 2006. http://www.neb-one.gc.ca/clf-nsi/rnrgynfmtn/nrgyrprt/lctrcty/mrgngtchnlglctcty2006/mrgngtchnlglctcty2006-eng.pdf 32 Ibid. 33 National Energy Board, Coal-Fired Power Generation: A Perspective, Energy Briefing Note, July 2008. http://www.neb-one.gc.ca/clf-nsi/rnrgynfmtn/nrgyrprt/lctrcty/clfrdpwrgnrtn2008/clfrdpwrgnrtn-eng.html#s3 34 J. Newman, E. Zillioux, C. Newman, C. Denny, P. Colverson, K. Hill, W. Warren-Hicks, and S. Marynowski. Comparison of Reported Effects and Risks to Vertebrate Wildlife from Six Electricity Generation Types in the New York / New England Region (New York State Energy Research and Development Authority, 2009). http://www.nyserda.ny.gov/Publications/Research-and-Development-Technical-Reports/Environmental-Reports/EMEP- Publications/~/media/Files/Publications/Research/Environmental/EMEP/Report%2009-02%20Wildlife%20report%20- %20web.ashx 13 A Costly Diagnosis
Coal in Alberta

Coal-fired electricity generation results in the deposition of mercury, which is converted in
aquatic environments to the biologically available and toxic substance methylmercury.
Methylmercury persists in nature as it is not easily broken down; as a result it bioaccumulates as
it moves up the food chain, negatively affecting fish and the birds and wildlife that feed on fish.35
Mercury deposition to Wabamun Lake’s sediments has increased several-fold over background
levels, largely due to the emissions from the local coal-fired generating stations.36 A more
complete discussion of pollution from combustion of coal is found in Section 3.

2.2.4 Post-combustion solid wastes
In addition to exhaust gases, a number of solid wastes byproducts remain following combustion
that can have significant impacts on health and the environment. These include coal ash and coal
ash slurry, which need to be stored and disposed of,37 but can still remain as threats to regional
water supplies.38

35
   Ibid.
36
   Schindler, et al., Lake Wabamun: A Review of Scientific Studies and Environmental Impacts.
37
   Alberta Environment and Sustainable Resource Development, Coal Ash: Acceptable Industry Practices (2012).
www.environment.gov.ab.ca/info/library/7638.pdf
38
   Alan H. Lockwood, Kristen Welker-Hood, Molly Ranch, Barbara Gottlieb, Coal’s Assault on Human Health
(Physicians for Social Responsibility, 2009), 11. http://www.psr.org/assets/pdfs/psr-coal-fullreport.pdf

14                                                                                              A Costly Diagnosis
3. Air pollution from coal-fired
   electricity generation and
   associated health risks
The major pollutants that result from burning coal are oxides of nitrogen (NOx), sulphur dioxide
(SO2), mercury, and particulate matter (PM). Coal combustion also results in emissions of
arsenic, cadmium, lead, polycyclic aromatic hydrocarbons (PAH), dioxins and furans.
Additionally, nitrogen dioxide reacts in the atmosphere to create another health hazard —
ground-level ozone, a major component of smog. Finally, coal facilities are some of the largest
greenhouse gas-emitting facilities in the province, while coal is the largest greenhouse gas
problem globally. Greenhouse gases contribute to global climate change, which poses significant
long-term risks to the health of Albertans and global citizens more broadly.
New pollution control technology when required by government regulation can reduce the
amount of pollution emitted by coal units, but many units, particularly older one, still emit
significant amounts of pollution. For example, in Alberta, the provincial government has
standards for SO2 and NOx emissions for new facilities (i.e. a generating unit that is
commissioned on or after January 1, 2006), but almost all existing facilities still emit those
pollutants at levels well above the standard, as shown in Figure 6, Figure 7 and Figure 9, based
on information reported to the National Pollutant Release Inventory.
These atmospheric emissions can have acute as well as chronic health consequences as a result
of inhaling the pollutants directly, or being exposed to them as they accumulate in the
environment, as they are transferred along the food chain or as they impact the health of our
ecosystems.
Air pollution from burning coal affects numerous systems in the body — respiratory,
cardiovascular, and the central nervous system. These impacts on human health result in loss of
work days, increased hospital visits, chronic respiratory illnesses, and premature mortality,
locally and regionally. All of these take a measurable toll on society in terms of the well-being of
the population, and the financial costs to the health care system.
This section describes the types of pollutants produced by coal-fired electricity generation in
Alberta, and outlines the major health impacts of these pollutants. Section 4 examines the
impacts on specific populations, while Section 5 attempts to quantify the human health and
financial costs.

3.1 Emissions management in Alberta
In Alberta, the Clean Air Strategic Alliance (CASA) has played a key role in working to reduce
emission levels of pollutants. This multi-stakeholder partnership is composed of representatives

15                                                                                A Costly Diagnosis
You can also read


