KlimRess - Impacts of climate change on mining, related environmental risks and raw material supply 106/2020
←
→
Page content transcription
If your browser does not render page correctly, please read the page content below

TEXTE

106/2020

KlimRess – Impacts of
climate change on mining,
related environmental
risks and raw material
supply
Case studies on bauxite, coking coal and iron ore
mining in Australia

TEXTE 106/2020

Environmental Research of the
Federal Ministry for the
Environment, Nature Conservation
and Nuclear Safety

Project No. (FKZ) 3716 48 324 0
Report No. FB000279/ANH,2,ENG

KlimRess – Impacts of climate change on
mining, related environmental risks and raw
material supply
Case studies on bauxite, coking coal and iron ore mining in Australia

by

Lukas Rüttinger, Christine Scholl, Pia van Ackern
adelphi research gGmbh, Berlin
and
Glen Corder, Artem Golev, Thomas Baumgartl
The University of Queensland, Sustainable Minerals Institute, Australia

On behalf of the German Environment Agency
Imprint

Publisher:
Umweltbundesamt
Wörlitzer Platz 1
06844 Dessau-Roßlau
Tel: +49 340-2103-0
Fax: +49 340-2103-2285
buergerservice@uba.de
Internet: www.umweltbundesamt.de

  /umweltbundesamt.de
  /umweltbundesamt

Study performed by:
adelphi research gGmbh
Alt-Moabit 91, 10559 Berlin

Study completed in:
August 2017

Edited by:
Section III 2.2 Resource Conservation, Material Cycles, Minerals and Metals
Industry
Jan Kosmol

Publication as pdf:
http://www.umweltbundesamt.de/publikationen

ISSN 1862-4804

Dessau-Roßlau, June 2020

The responsibility for the content of this publication lies with the author(s).
UBA Texte header: Please enter name of the project/report (abbreviated, if necessary)

Abstract

The following case study is one of five country case studies carried out as part of the project ‘Impacts
of climate change on the environmental criticality of Germany’s raw material demand‘ (KlimRess),
commissioned by the German Federal Environment Agency (Umweltbundesamt, UBA). The project
team comprised adelphi, ifeu Heidelberg and the Sustainable Minerals Institute of the University of
Queensland. The aim of the project was to assess how climate change potentially affects the
environmental risks of mining and raw material supply chains.
This case study analyses three mining operations in Australia: Rio Tinto’s Weipa bauxite mining
operations in Queensland (tropical climate), the Goonyella Riverside coking coal mining operations
also in Queensland (sub-tropical climate) and the Mount Whaleback iron ore mining operations in
Western Australia (arid hot desert climate). All three mining operations have a large land footprint.
The beneficiation of mined bauxite does not entail high environmental risks since no chemicals are
used. In contrast, refining and smelter processes pose higher risks to the environment (e.g. high
energy use at the smelter; highly alkaline red mud residue and high water use at the refinery). Saline
and/or acid water seepage from coking coal and iron ore mining pits and mine waste pose
environmental risks for surrounding soils and the groundwater. Coal mining additionally causes air
pollution.
Overall, the impacts of climatic changes are expected to aggravate or add to current environmental
risks. Extreme weather events stand out as the main risks across the three mining sites. In particular,
more intense wet weather extremes can lead to the flooding of mining areas, exacerbating the
environmental risks of drainage or discharge of hazardous waters at coking coal and iron ore mining
operations. In these kinds of operations, flooding can also interrupt transportation, whereas bauxite
transportation may be affected to a lesser extent. Droughts could affect mining and processing
operations, for example, by restricting water use, potentially halting production of bauxite, coking coal
or iron ore.

Kurzbeschreibung

Die vorliegende Fallstudie ist eine von fünf Länderfallstudien des im Auftrag des Umweltbundesamtes
(UBA) durchgeführten Projekts „Auswirkungen des Klimawandels auf die ökologische Kritikalität des
deutschen Rohstoffbedarfs“ (KlimRess). adelphi, das ifeu (Institut für Energie- und Umweltforschung
Heidelberg) und das Sustainable Minerals Institute der University of Queensland untersuchten dabei
die möglichen Auswirkungen des Klimawandels auf mit dem Bergbau einhergehende Umweltrisiken
und Rohstofflieferketten.
Diese Fallstudie analysiert drei Bergwerke in Australien: Rio Tintos Bauxitbergwerk in Weipa
(tropisches Klima), das Kokskohle Bergwerk Goonyella Riverside (subtropisches Klima) und das
Eisenerzbergwerk Mount Whaleback (trockenes, heißes Wüstenklima). Alle drei Bergwerke weisen
einen hohen Landverbrauch auf. Die Weiterverarbeitung des abgebauten Bauxits birgt keine hohen
Umweltrisiken, da keine Chemikalien verwendet werden. Im Gegensatz dazu stellen Raffinations- und
Schmelzprozesse ein höheres Umweltrisiko dar (z.B. hoher Energieverbrauch bei der Verhüttung;
hochalkalischer Rotschlamm und hoher Wasserverbrauch im Umschmelzwerk). Das Austreten von
salinen oder sauren Grubenwässern stellt Umweltrisiken sowohl beim Kokskohle- als auch beim
Eisenerzabbau dar. Der Kohleabbau verursacht zudem Luftverschmutzung.
Insgesamt kann davon ausgegangen werden, dass die Auswirkungen des Klimawandels die derzeitigen
Umweltrisiken des Bergbaus an den untersuchten Standorten verschärfen. Starkregenereignisse
stellen ein Hauptrisiko an allen drei Abbaustätten dar, welche Überschwemmungen zur Folge haben
und zum Austritt von belastetem Wasser beim Kokskohle- und Eisenerzabbau führen können.
Überschwemmungen können auch Transportunterbrechungen an den untersuchten Kokskohle- und

                                                                                                           3
UBA Texte header: Please enter name of the project/report (abbreviated, if necessary)
Eisenerzbergwerken mit sich bringen, während der Transport von Bauxit wahrscheinlich nur in
geringerem Maße beeinträchtigt würde. Dürren könnten zu einer Einschränkung des
Wasserverbrauchs führen, was den Abbau, die Aufbereitung, die Verhüttung und das Umschmelzen
beeinträchtigen könnte. Diese Einschränkungen könnten eine Drosselung der Produktion von Bauxit,
Kokskohle oder Eisenerz erforderlich machen.
4UBA Texte header: Please enter name of the project/report (abbreviated, if necessary)
Table of Contents
List of Figures .................................................................................................................................................... 8
List of Tables ..................................................................................................................................................... 9
List of Abbreviations ....................................................................................................................................... 10
1 Introduction .......................................................................................................................................... 11
1.1 Project background ........................................................................................................................ 11
1.2 Selection of case studies ................................................................................................................ 11
1.3 Content and structure .................................................................................................................... 12
2 Overview of climatic conditions and projected climatic changes ........................................................ 14
2.1 The tropics ...................................................................................................................................... 14
2.2 Arid regions .................................................................................................................................... 15
2.3 Coastal regions ............................................................................................................................... 15
2.4 Australia ......................................................................................................................................... 16
3 Overview of the mining sector in Australia and its economic relevance ............................................. 17
4 Overview of the mining governance of Australia ................................................................................. 19
4.1 Disaster risk reduction and climate change adaptation policies ................................................... 19
4.2 Environmental governance ............................................................................................................ 20
4.3 Indigenous people and mining ....................................................................................................... 21
4.4 Other mining-related conflicts ....................................................................................................... 23
5 Case study bauxite mining .................................................................................................................... 24
5.1 The global value chain of primary aluminium ................................................................................ 24
5.2 Weipa bauxite mining area and Gladstone’s alumina refineries and smelter ............................... 24
5.2.1 Overview of the Weipa bauxite mining area ........................................................................... 25
5.2.2 Overview of Gladstone’s alumina refineries ........................................................................... 26
5.2.3 Overview of Gladstone’s Boyne aluminium smelter ............................................................... 26
5.2.4 Overview of transportation systems ....................................................................................... 27
5.3 Extraction and processing technologies......................................................................................... 27
5.3.1 Extraction and processing technologies at the Weipa bauxite mining area ........................... 27
5.3.2 Processing technologies at Gladstone’s alumina refineries .................................................... 27
5.3.3 Processing technologies at Boyne Smelters ............................................................................ 28
5.4 Current environmental impacts and risks ...................................................................................... 28
5.4.1 Weipa bauxite mining area ...................................................................................................... 28
5.4.2 Gladstone alumina refineries .................................................................................................. 30
5.4.3 Gladstone Boyne alumina smelter .......................................................................................... 31
5.5 Current climate impacts and risks .................................................................................................. 32
5UBA Texte header: Please enter name of the project/report (abbreviated, if necessary)
5.5.1 Weipa bauxite mining area ...................................................................................................... 32
5.5.2 Gladstone alumina refineries and smelter .............................................................................. 33
5.6 Climate change impact assessment ............................................................................................... 33
5.6.1 Weipa bauxite mining area ...................................................................................................... 34
5.6.2 Potential climate impacts on refinery and smelter ................................................................. 34
5.6.3 Potential climate impacts on the ports in Weipa and Gladstone ............................................ 35
6 Case study coking coal mining .............................................................................................................. 37
6.1 The global value chain of coking coal ............................................................................................. 37
6.2 Goonyella Riverside coking coal mine ............................................................................................ 37
6.2.1 Overview of Goonyella Riverside mining area......................................................................... 38
6.2.2 Overview of transportation systems ....................................................................................... 39
6.3 Extraction and processing technologies......................................................................................... 39
6.3.1 Extraction and processing technologies at Goonyella Riverside ............................................. 39
6.4 Current environmental impacts and risks and mitigation measures ............................................. 40
6.4.1 Goonyella Riverside mining area ............................................................................................. 40
6.5 Current climate impacts and risks .................................................................................................. 43
6.5.1 Goonyella Riverside mine ........................................................................................................ 43
6.6 Climate change impact assessment ............................................................................................... 44
6.6.1 Potential climate impacts on the Goonyella Riverside mine area........................................... 45
6.6.2 Potential climate impacts on the railway connecting the mine and port ............................... 45
6.6.3 Potential climate impacts on Hay Point port ........................................................................... 45
7 Case study iron ore mining ................................................................................................................... 48
7.1 The global value chain of iron ore and steel .................................................................................. 48
7.2 Mount Whaleback iron ore mining area ........................................................................................ 49
7.2.1 Overview of the Mount Whaleback mining area .................................................................... 50
7.2.2 Overview of transportation systems ....................................................................................... 50
7.3 Extraction and processing technologies......................................................................................... 51
7.3.1 Extraction and processing technologies at Mount Whaleback ............................................... 51
7.4 Current environmental impacts and risks ...................................................................................... 51
7.4.1 Mount Whaleback mining area ............................................................................................... 51
7.5 Current climate impacts and risks .................................................................................................. 53
7.5.1 Mount Whaleback mining area ............................................................................................... 53
7.6 Climate change impact assessment ............................................................................................... 54
7.6.1 Potential climate impacts on the Mount Whaleback mine ..................................................... 55
7.6.2 Potential climate impacts on the railway connecting the mine and port ............................... 55
7.6.3 Potential climate impacts on Port Hedland port ..................................................................... 55
6UBA Texte header: Please enter name of the project/report (abbreviated, if necessary)
8 Summary and conclusion ...................................................................................................................... 58
9 References ............................................................................................................................................ 61
7UBA Texte header: Please enter name of the project/report (abbreviated, if necessary)
List of Figures
Figure 1: Map of Australia indicating Köppen-Geiger climate classification and
examined sites .................................................................................... 12
Figure 2: Aluminium global value chain and ranking for selected countries
(2016) .................................................................................................. 24
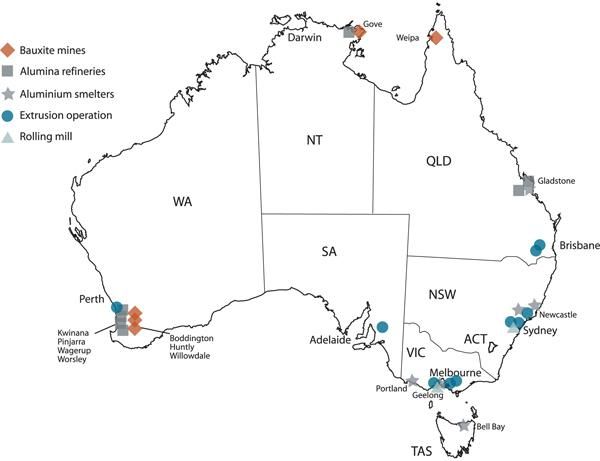
Figure 3: Map of the Australian aluminium sector ............................................ 25
Figure 4: Climate impact chain for bauxite........................................................ 36
Figure 5: Coking coal global value chain and ranking for selected countries
(2016) .................................................................................................. 37
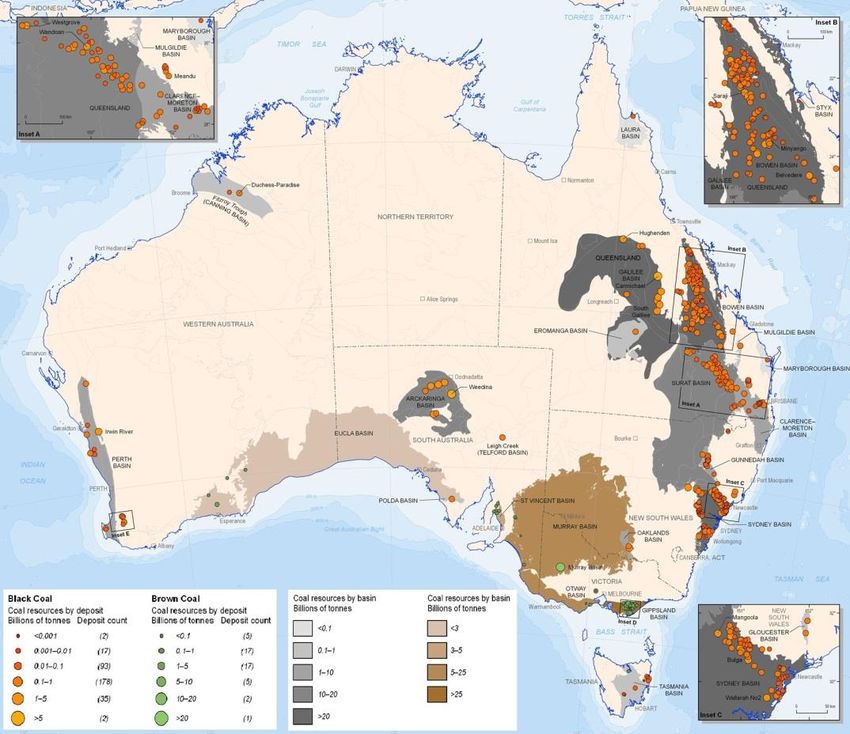
Figure 6: Australian In Situ Coal Resources. ...................................................... 38
Figure 7: Climate impact chain for coking coal.................................................. 47
Figure 8: Iron ore and steel global value chain and ranking for selected
countries (2016).................................................................................. 48
Figure 9: Australian In Situ Iron Ore Resources: Hematite. ............................... 49
Figure 10: Climate change impact chain for iron ore .......................................... 57
8UBA Texte header: Please enter name of the project/report (abbreviated, if necessary)
List of Tables
Table 1: Major sectors of the Australian industry, 2015-2016......................... 17
Table 2: Cargo statistics for Gladstone Ports in 2016....................................... 27
Table 3: Export statistics for port of Hay Point (QLD) in 2016. ........................ 39
Table 4: Cargo statistics for Port Hedland (WA) in 2016. ................................. 50
9UBA Texte header: Please enter name of the project/report (abbreviated, if necessary)
List of Abbreviations
AMD Acid Mine Drainage
AR4 Fourth Assessment Report of the Intergovernmental Panel on Climate Change
AR5 Fifth Assessment Report of the Intergovernmental Panel on Climate Change
BMU German Federal Ministry for the Environment, Nature Conservation and Nuclear Safety
(German: Bundesministerium für Umwelt, Naturschutz und Reaktorsicherheit)
BOM Bureau of Meteorology
BSL Boyne Smelters Limited
CSIRO Commonwealth Scientific and Industrial Research Organisation
CID Channel Iron Deposit
DBCT Dalrymple Bay Coal Terminal
EAF Electric Arc Furnace
ENSO El Niño Southern Oscillation
ETC Extratropical Cyclones
FPIC Free Prior and Informed Consent
GHG Greenhouse Gas
HPCT Hay Point Coal Terminal
OHP Ore Handling Plant
PGM Platinum Group Metals
QAL Queensland Alumina Limited
RCP Representative Concentration Pathway
RTA Rio Tinto Alcan
TSS Total Suspended Solids
UBA German Federal Environment Agency (German: Umweltbundesamt)
WA Western Australia
10UBA Texte header: Please enter name of the project/report (abbreviated, if necessary)
1 Introduction
1.1 Project background
The following case study is one of five country case studies of the project ‘Impacts of climate change on
the environmental criticality of Germany’s raw material demand‘ (KlimRess), commissioned by the
German Federal Environment Agency (Umweltbundesamt, UBA). The project team comprised adelphi,
ifeu Heidelberg and the Sustainable Minerals Institute of the University of Queensland. The aim of the
project was to assess how climate change can potentially impact the environmental risks of mining
and affect raw material supply chains.
Based on a systematic assessment of the case study results, the project team identified the most
significant climate impacts across case studies. The project team also explored the links between
climate change and a newly developed method to evaluate environmental hazard potentials as part of
an environmental criticality assessment (OekoRess method) in order to inform the discussion of
environmental criticality. Lastly, the project team combined data on current production and expected
future production of nine raw materials with data on countries’ vulnerability to climate change in
order to identify patterns of particularly vulnerable raw materials and producing countries. The
results are published in the final report of the project (see Rüttinger et al., 2020).
Based on these results, the project team developed recommendations on how to best adapt the mining
sector, how to incentivise climate change adaptation measures in mining and how to foster effective
mechanisms for the exchange of knowledge and expertise on the topic globally. These policy
recommendations were published separately in the form of a recommendation paper (see van Ackern
et al., 2020).
1.2 Selection of case studies
The case studies conducted as part of the project covered five different (climatic) regions:
1. Arid regions with water stress
2. Humid tropical regions
3. Polar or subpolar regions
4. Temperate regions
5. Coastal regions
In addition, the case studies covered nine raw materials that were identified and selected based on the
following criteria:
► The importance of minerals and metals for future and environmental technologies
► Base metals, alloys and auxiliary materials important for the German economy
Other criteria that informed the case study selection were the climate change vulnerability of
countries, their governance contexts and the prevalence of conflicts related to mining. The aim was to
select a set of most different cases. Further selection criteria were the political relevance for Germany,
the research institutions’ partner networks and the availability of data.
The selected metals and minerals were: bauxite, coking coal, copper, iron ore, lithium, nickel, PGMs, tin
and tungsten.
Each case study analysed a chosen mine site and the processing steps (to the extent these take place in
the relevant country). The project team evaluated the environmental and supply risks potentially
caused by climate stimuli and/or direct climate impacts for each of the mining and processing sites.
11UBA Texte header: Please enter name of the project/report (abbreviated, if necessary)
1.3 Content and structure
This study on Australia focuses on the following resources and mining sites (see Figure 1):
► Bauxite mine in Weipa, Queensland (tropical climate)
► Coking coal mine Goonyella Riverside, Queensland (sub-tropical climate)
► Iron ore mine Mount Whaleback, Western Australia (arid hot desert climate)
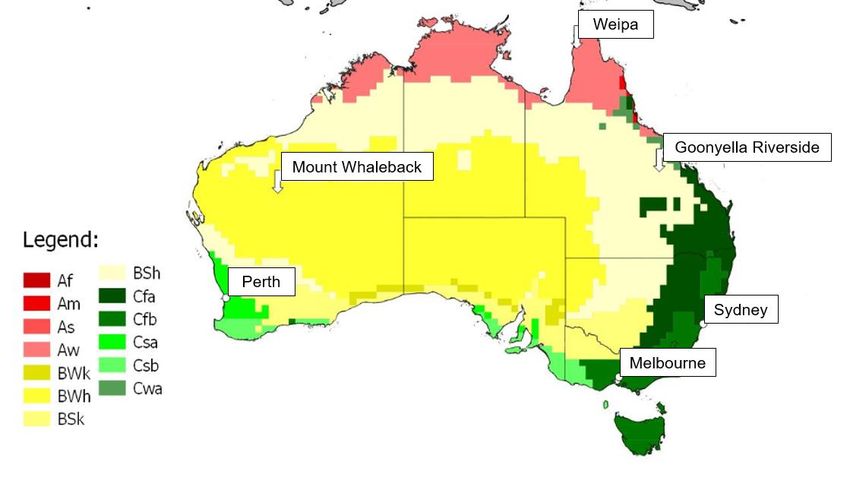
Figure 1: Map of Australia indicating Köppen-Geiger climate classification and examined sites
Source: Maps prepared by adelphi using QGIS Geographic Information System (http://qgis.osgeo.org); climatic regions
based on Rubel and Kottek, 2010. Arrows point to mine sites; dots indicate large cities.
The case studies are based on extensive secondary research, including the scientific literature, as well
as reports and statements published by national government agencies, civil society organisations,
mining and processing companies and the media.
First, the case studies provide a brief overview of the climatic conditions and projected climatic
changes (in the case of this study, for tropic, arid and coastal regions and for Australia as a whole). The
studies then present an overview of the country’s mining sector and its economic relevance as well as
a summary of the country’s mining governance (including disaster risk management, climate change
adaptation, the environment, indigenous people and mining-related conflicts).
Second, we analyse the resources separately, covering the following topics:
► The global value chain of the respective resource
► Site-specific overview of the mine site
► Extraction and processing technologies
12UBA Texte header: Please enter name of the project/report (abbreviated, if necessary)
► Current environmental impacts and mitigation measures
► Current climate impacts and risks
► Climate change impact assessment:
The climate impact assessments are based on the Guidelines for Climate Impact and Vulnerability
Assessment, published by the UBA (Buth et al., 2017). The Guidelines propose a combination of
concepts outlined in the Fourth Assessment Report (AR4) (IPCC, 2007) and Fifth Assessment Report
(AR5) (IPCC, 2014) of the Intergovernmental Panel on Climate Change. We use the terminology
proposed by the Guidelines. To increase the compatibility across the Guidelines and the new AR5
approaches, we also indicate in the right margin the AR5 terminology in the climate impact chain
diagrams (i.e. hazards, exposure and risks).
Finally, we summarise and discuss main findings of the case study.
13KlimRess – Climate change and mining in Australia: Case studies on bauxite, coking coal and iron ore
2 Overview of climatic conditions and projected climatic changes
Australia is characterized by different climatic zones. The mining sites analysed in this case study are
located in tropical as well as arid climatic zones. One mine is situated at the coast; all other mines are
located inland. All mines deliver their products to ports for export. The following chapter provides a
quick overview over these climatic zones, coastal regions as well as the Australian continent and
predicted climatic changes at the respective locations.
2.1 The tropics
The climate classification outlined by Köppen-Geiger defines the tropics as a region where the mean
temperature of the coolest month is 18°C or higher (Peel et al., 2007). This climatic zone has three
subtypes, defined by precipitation criteria: wet equatorial climate or tropical rainforest climate1,
tropical monsoon and trade-wind littoral climate2 and tropical wet-dry climate or tropical savannah
climate3 (Arnfield, 2016; Peel et al., 2007). The tropics cover 19 per cent of the global land area (Peel
et al., 2007).
The region is characterised by a warm climate, with mean annual temperatures exceeding 20°C and in
many parts even 25°C (Trewin, 2014). The temperature varies little during the year. The annual
ranges of temperature of tropical locations are usually very small; near the equator, the mean
temperature of the hottest months is only marginally higher than the mean temperature of the coolest
months (Trewin, 2014). Day-to-day temperature fluctuations are also very small (Trewin, 2014). In
contrast to the relatively constant temperature, precipitation regimes differ considerably throughout
the tropics, ranging from the driest places on earth (e.g. in the South American Atacama desert with
less than 1 mm mean annual rainfall) to the wettest (e.g. some locations in Hawaii with more than
10,000 mm mean annual rainfall) (Trewin, 2014). In regions with wet equatorial or tropical rainforest
climates, rain occurs regularly throughout the year. Tropical monsoon and trade-wind littoral climate
zones can be characterised by a well-defined, but brief dry season, while zones with tropical wet-
dry/tropical savannah climate usually have a longer dry season. For locations on islands or near the
coast, temperature and precipitation slightly vary.
The El Niño-Southern Oscillation (ENSO) causes high natural climatic variability in the tropics, which
makes it harder to detect the impacts of anthropogenic climate change (Corlett, 2014). Other human
impacts, such as deforestation and urbanisation, also have impacts on the region’s climate (Corlett,
2014). A lack of climatic data, especially for continental Africa, the Amazon and the tropical Pacific,
constrains projections (Trewin, 2014). Nevertheless, there has been an observable warming by 0.7 to
0.8 °C over the last century. This has led to some visible impacts on land and in the sea: high-mountain
flora and fauna have moved upslope, glaciers in the Andes and East Africa have shrunk and extreme
mass coral bleaching periods have occurred in the oceans (Corlett, 2014).
Rainfall trends for the tropics are less clear, since the amount of rainfall fluctuates from year to year,
partly due to ENSO. However, the last 30 years have shown a general increase in precipitation, with
some parts of the tropics experiencing a decrease (e.g. in parts of Brazil and the central equatorial
Pacific) (Trewin, 2014).
Tropical cyclones are important tropical atmospheric phenomena. They can have particular
destructive forces, as they combine extreme winds, extreme rainfall (can cause freshwater flooding
and landslides) and storm surges (can cause elevated sea levels and flooding). Storm surges caused by
cyclones have led to many fatalities in the past, especially along low-lying coastal areas with large
1 Precipitation in the driest month is at least 60 mm.
2 Precipitation in the driest month is less than 60 mm but equal to or greater than 100-average annual precipitation total
mm/25.
3 Precipitation in the driest month is less than 60 mm but less than 100-average annual precipitation total mm/25.
14KlimRess – Climate change and mining in Australia: Case studies on bauxite, coking coal and iron ore
populations (Trewin, 2014). The number of tropical cyclones per year has stayed notably constant
from year to year, between 75 and 100 cyclones per year. In terms of intensity, there are no clear
trends in the observed cyclone activities (Trewin, 2014).
Climate projections expect a further temperature increase of 1°C by 2050 and a 1-2°C increase by
2100 under the lowest-emission scenario, whereas high-emission scenarios assume increases of 1-2°C
(by 2050) and 3-4°C (by 2100) (Trewin, 2014). This is slightly less warming than in other climatic
regions. For rainfall projections, there is generally low confidence and therefore high uncertainty.
Rainfall might increase, seasons with rainfall might intensify (with wetter and longer wet seasons and
drier dry seasons) and extreme rainfall events might occur more often (Trewin, 2014). Projections
show that the number of cyclones will either decrease or stay more or less the same, but that there will
be a larger share of intense cyclones (Trewin, 2014). Heatwaves are also likely to increase in
frequency and severity. These changes can have severe impacts on many less developed tropical
countries due to their high vulnerability to extreme weather events, especially concerning poor people
in urban informal settlements and rural areas with less access to supporting infrastructure and public
services (Trewin, 2014; Corlett, 2014).
2.2 Arid regions
Arid climates have low mean annual precipitation rates, high year-to-year variability in precipitation
and a relatively low humidity (Arnfield, 2016; Peel et al., 2007). This climatic zone has four subtypes:
an arid desert climate, either of hotter4 or cooler5 nature, and a semi-arid steppe climate, also either of
hotter or cooler nature. Arid climate is the world’s dominant climate zone, covering over 30 per cent of
the global land area (Peel et al., 2007).
Over the next century, precipitation in many arid regions is expected to decrease by at least 20 per
cent (Arab Water Council, 2009). Although rainfall will likely be less frequent, it is expected to be more
intense (Arab Water Council, 2009). Increasing temperatures will also result in higher evaporation and
drier conditions, and this, combined with the decline in the frequency but increase in intensity of
rainfall, will result in droughts and floods (Arab Water Council, 2009).
2.3 Coastal regions
Coastal regions lie in all climatic zones6. Coastal systems and low-lying areas can be defined as areas
close to the mean sea level (Wong et al., 2014).
According to the Fifth Assessment Report of the Intergovernmental Panel on Climate Change (AR5), the
global sea level is very likely to raise (Wong et al., 2014). There is high confidence that coasts will be
impacted by submergence, flooding, coastal erosion and salt water intrusion caused by relative sea
level rise which can vary substantially from the projected global mean sea level rise based on
location(Wong et al., 2014). General sea level rise will also mean an increase in extreme sea levels7
(Wong et al., 2014).
Coastal ecosystems will suffer from increasing ocean acidification and warming (Wong et al., 2014). In
terms of extreme weather events, tropical cyclone frequency is likely to decrease or not to change;
however, the intensity of tropical cyclones is likely to increase (Wong et al., 2014). The intensified
impacts of cyclones (e.g. storm surges, storm waves, coastal flooding, erosion and consequently
causing potential damage to coastal infrastructures) would be felt most strongly in coastal regions
4 Average annual temperature is to or greater than 18°C.
5 Average annual temperature is less than 18°C.
6 An overview on coasts in polar region will be included in the case study on Canada.
7 Description of extreme sea levels: “Extreme sea levels are those that arise from combinations of factors including
astronomical tides, storm surges, wind waves and swell, and interannual variability in sea levels. Storm surges are caused
by the falling atmospheric pressures and surface wind stress associated with storms such as tropical and ETCs
[extratropical cyclones] and therefore may change if storms are affected by climate change.” (Wong et al., 2014: 370).
15KlimRess – Climate change and mining in Australia: Case studies on bauxite, coking coal and iron ore
(Corlett, 2014). Projections for increased winds and waves have only low confidence (Wong et al.,
2014).
Population growth, economic development and further urbanisation in coastal areas will put
additional pressure on coastal systems. Furthermore, coastal populations, especially in tropical
countries, are most vulnerable to sea level rise (Wong et al., 2014; Trewin, 2014). The Fifth Assessment
Report of the Intergovernmental Panel on Climate Change (AR5) states with high confidence: “Without
adaptation, hundreds of millions of people will be affected by coastal flooding and will be displaced
due to land loss by year 2100; the majority of those affected are from East, Southeast, and South Asia”
(Wong et al., 2014: 364).
2.4 Australia
According to the Köppen-Geiger climate types, the Australian continent can be subdivided into three
main climate zones: arid (covers 77.8 per cent of land area), temperate (covers 13.9 per cent of land
area) and tropical (covers 8.3 per cent of land area) (Peel et al., 2007: 1642). The analysed mining sites
are located in different climate regions. Weipa is located in northern Queensland and Goonyella
Riverside is located in central Queensland. While Weipa is characterised by a tropical climate,
Goonyella has a typical semi-arid climate. Weipa lies on the coast and Goonyella Riverside is located
inland. Mount Whaleback is located in Western Australia and has an arid hot desert climate.
Australia has a very high natural climatic variability, most importantly in regard to its rainfall patterns,
which are mainly linked to the ENSO (Reisinger et al., 2014). This natural variability makes it difficult
to distinguish and project anthropogenic climate change and the impacts it has on Australia (Reisinger
et al., 2014). However, the Fifth Assessment Report of the Intergovernmental Panel on Climate Change
(AR5) finds with high confidence that Australia’s long-term climatic trends are changing (Reisinger et
al., 2014).
The latest State of the Climate report, published by the Australian Bureau of Meteorology (BOM) and
the Commonwealth Scientific and Industrial Research Organisation (CSIRO) gives an overview of
observed current changes in Australia’s climate and predictions for future developments (BOM/CSIRO,
2016). The report states that the mean surface air temperature has increased by 1°C on average since
1910, rising particularly since the 1950s. Also, the number of days per year with temperatures above
35°C has increased in large parts of the Australian continent since the 1950s. While rainfall has
decreased in southern Australia since 1970 (during the agriculturally important season between May
and July), it has increased in northern Australia (during the monsoon season between October and
April). As for the oceans surrounding Australia, there are three important observations: the
temperature and the acidity levels of the oceans have increased, sea levels have risen and,
consequently, there has also been an increase in high tides and storm surges.
BOM and CSIRO project8 that most of these trends will continue: the mean temperature will increase
further, there will be more hot days, rainfall will be more intense in some regions and will decrease in
other regions. The oceans around Australia will heat up further, ocean acidification levels will increase
and the sea level will continue to rise.
8 In this report, the authors are not differentiating between different RCP scenarios.
16KlimRess – Climate change and mining in Australia: Case studies on bauxite, coking coal and iron ore
3 Overview of the mining sector in Australia and its economic
relevance
Australia is one of the world’s major producers of minerals and has almost 400 mines where 19
minerals are sourced in significant quantities (Geoscience Australia, 2017). In 2015, Australia had the
world’s largest resources9 of diamond, gold, iron ore, lead, nickel, rutile, tantalum, uranium, zinc and
zircon. Further, it had the second largest resources of bauxite, brown coal (lignite), cobalt, copper,
ilmenite, manganese ore, niobium, silver, thorium and tungsten in the same year. It had the fifths
largest resources of black coal10. In terms of global production, Australia ranked first in the production
of bauxite, rutile and zircon; second in diamond, gold, ilmenite, iron ore, lead, rare earths and zinc
production; and third in brown coal, manganese ore and uranium production. (Britt el al., 2016, data
referring to 2015). To illustrate further, the three minerals analysed in this study – iron ore, bauxite
and black coal – accounted for 25 per cent (iron ore), 29 per cent (bauxite) and 8 per cent (black coal)
of the global production in 2015 (Britt el al., 2016). Almost all iron ore (98 per cent) is produced in
Western Australia (Department of State Development, 2017). Coal is mostly produced in Queensland
(54 per cent of total Australian production) and New South Wales (44 per cent of total Australian
production) (Department of Industry, Innovation and Science, 2016c). For bauxite, production is
concentrated in Western Australia (55 per cent of total Australian production) and Queensland (34
per cent of total Australian production) (Department of Industry, Innovation and Science, 2016b)
Mining is of high importance to the Australian economy. After Services (output $1,015 billion, 61.1 per
cent of GDP) and Construction (output $134.2 billion, 8.1 per cent of GDP), it is the sector with the
third highest contribution to the national economy (Office of the Chief Economist, 2016). The mining
industry11 had an output of $114.9 billion in 2015-2016, which equals a 6.9 per cent share of the total
GDP (Office of the Chief Economist, 2016).
Table 1: Major sectors of the Australian industry, 2015-2016
Industry sector Output Share of GDP Share of employment
Services $1,015.0 billion 61.1 % 79.2 %
Construction $134.2 billion 8.1 % 8.8 %
Mining $114.9 billion 6.9 % 1.9 %
Source: Office of the Chief Economist 2016: 33.
The Australian total export value was $312 billion in 2015–2016. Mining products were among the top
exports. Iron ore had the largest export value with $47.7 billion, followed by coking and thermal coal
with the second largest export value of $34.3 billion (Office of the Chief Economist, 2016). $10.2 billion
of export value originated from bauxite, alumina and aluminium (Department of Industry, Innovation
and Science, 2016a). On worldwide comparison, Australia is the largest exporter of iron ore, coking
coal and alumina (Department of Industry, Innovation and Science, 2017).
Compared to its important economic output, the mining sector does require a relatively small
workforce. In 2015-2016, the sector employed about 200.000 people, which makes up 1.9 per cent of
the total employment in all industries (Office of the Chief Economist, 2016). However, it is the sector
with the highest salaries on average (AMMA, 2017).
In general, the mining sector has strong impacts on the national economy. In times where employment
in mining is high, the local economy and the housing market profit from the money available for
9 Resources are defined as Economic Demonstrated Resources in Britt et al, 2016.
10 Two major types of black coal are thermal or steaming coal that is used for generating electricity and coking or metallurgic
coal which is used for steel making.
11 Includes not only mineral mining but also natural gas production.
17KlimRess – Climate change and mining in Australia: Case studies on bauxite, coking coal and iron ore
spending (The Economist, 2017). Also, construction and importing industries do well in times of a
mining boom. In contrast, the strong value of the Australian dollar – a corollary of high mining export
prices – has a negative impact on other exporting industries, such as agriculture (Downes et al., 2014).
Yet, the mining sector is volatile and considerably smaller today than during boom times, providing
less employment than previously (Letts, 2016). Simultaneously, a cheaper Australian dollar is
strengthening other industries (e.g. agriculture and tourism) (The Economist, 2017).
18KlimRess – Climate change and mining in Australia: Case studies on bauxite, coking coal and iron ore
4 Overview of the mining governance of Australia
The governance of the mining sector lies on different levels of government. Yet, authorities on the state
and territory government12 level are the predominant regulators of the mining sector (Everingham et
al., 2013). They allocate mining licences, regulate the royalty system and access to land and water, and
they grant planning approvals, including environmental authorisations (Everingham et al., 2013;
Woods and Knight, 2016). Local governments are responsible for local property taxes, for local
infrastructure (e.g. roads and waste management) and buildings, and environment, health and
community matters (Everingham et al., 2013). The federal government oversees and regulates foreign
investments, uranium-related matters and other areas of taxation (Everingham et al., 2013). Yet, there
are also overlaps. For example, the federal government and the state/territory governments have
shared responsibilities with regard to the regulation of native lands and heritage matters as well as
environmental protection. State/territory and local governments jointly handle regional social and
economic issues as well as planning approval.
Further, “[m]andated consultation processes [e.g. in the case of an environmental impact assessment]
provide for nongovernmental stakeholders to influence local and regional developments in mining-
intensive areas. These stakeholders include significant interest groups such as indigenous groups,
regional boards, and civil society organizations” (Everingham et al., 2013: 589). In addition, the mining
industry commits itself in some cases to self-regulatory processes (Everingham et al., 2013).
Although the involvement of the three government levels, various government departments and
bodies as well as non-government stakeholders increases the complexity of the sector’s governance,
the overall governance of the mining sector is well functioning.
4.1 Disaster risk reduction and climate change adaptation policies
Among developed countries, Australia has one of the highest levels of vulnerability to the effects of
climate change (Forino et al., 2014). The Government of Australia acknowledges that it will experience
high losses due to natural disasters in the near future. It estimates that costs will triple by 2050,
amounting to US$ 17.7 billion (McClean, 2017).
Several agencies at the national level are responsible for climate change adaptation and disaster risk
reduction, e.g. Emergency Management Australia as part of the Attorney-General’s Department and the
Department of the Environment and Energy. Additionally, Australia has a meteorological service – the
Bureau of Meteorology – that provides detailed and timely forecasts, warnings (e.g. for severe
thunderstorms, cyclones, tsunamis and bushfires) and long-term outlooks. Concerning post-disaster
reconstruction, the federal government provides funding to states and territories as well as to
individuals for recovery.
However, Australia’s climate actions have been “inconsistent and lacking direction” over the past three
decades – not only with regard to climate mitigation, but also concerning disaster risk reduction and
climate change adaptation (Forino et al., 2014: 3). Climate policies of the main political parties in
Australia have changed repeatedly and there is a lack of coordination between the federal,
state/territory and local governments for disaster risk reduction and climate change adaptation
(Forino et al., 2014).
To strengthen cooperation between government levels and to link climate change adaptation to the
disaster risk reduction agenda, the Council of Australian Government brought several initiatives
12There are six states in Australia (New South Wales, Queensland, South Australia, Tasmania, Victoria and Western Australia)
and two mainland territories (the Australian Capital Territory and the Northern Territory). The states have their own
constitutions and legislative, executive and judiciary. The territories are similar to the states, with the main difference being
that the Commonwealth (i.e. federal) Parliament is entitled to alter or revoke the territories’ powers of self-government
(Australian Government, 2017).
19KlimRess – Climate change and mining in Australia: Case studies on bauxite, coking coal and iron ore
forward, e.g. the National Climate Change Adaptation Framework (2007) and the National Strategy for
Disaster Resilience (2011) (Forino et al., 2017). In 2015, the federal government published its National
Climate Resilience and Adaptation Strategy (Department of the Environment and Energy, 2017).
Regional level
In addition to national agencies, every state and territory has its own strategies and institutions, for
example, the Western Australia Climate Change strategy “Adaption to our changing climate”.
Queensland has modified its institutions over the past years. In the aftermath of the 2010-11
Queensland floods, the Queensland government set up the Queensland Reconstruction Authority,
initially for a limited period of time (Queensland Government, 2017a). As a reaction to the increasing
number and intensity of extreme weather events and subsequent disasters, the agency became
permanent in June 2015 (Robertson, 2015). It is the first permanent disaster recovery agency at the
state level in Australia and has an annual budget of AUD$ 30 million (Robertson, 2015). Furthermore,
Queensland updated its Strategy for Disaster Resilience in early 2017
(Queensland Government, 2017b).
Local level
In the National Climate Change Adaptation Framework, the Council of Australian Governments places
important responsibilities on local governments for climate change response and disaster risk
management (Forino et al., 2017: 100-101). However, local government responses to climate change
are highly variable, depending on their sizes, assets and locations13, among other factors (Forino et al.,
2017). Examples for local disaster management are the Local Disaster Management Plans of the
Gladstone Regional Council and Weipa Town Authority (Gladstone Regional Council, 2017; Weipa
Town Authority, 2017).
Mining companies
Mining companies also have adaptation strategies in place. For example, BHP Billiton has set up
environmental and climate change requirements that apply when undertaking business activities or
making investment decisions. These requirements include climate change adaptation (BHP Billiton,
2016). For the Western Australia Iron Ore operations, BHP Billiton developed a Climate Resilience
Plan (BHP Billiton, 2017a). Rio Tinto has a corporate Energy, Environment and Climate Change group
since 2002. The group evaluates the risk to Rio Tinto’s business from climate change. For its bauxite
mine in Weipa, Rio Tinto has developed a Climate Change Sensitivity Framework which helps the
company to assess climate change risks for operations and infrastructure (Peace et al., 2013).
4.2 Environmental governance
All stages of the mining life-cycle require environmental authorisation in Australia (Woods and Knight,
2016). State and territory governments are in charge of granting environmental approvals. In
Queensland, the responsible authority is the Department of Environment and Heritage Protection, and
in Western Australia, it is the Department of Water and Environmental Regulation14. Standard
approvals for operations with minor environmental disturbance are generally easy to obtain, while
significant and large-scale operations need a more comprehensive environmental approval which
requires environmental impact statements and a consultation with people who could be potentially
affected by the operations (Woods and Knight, 2016). If a mining operation is likely to cause
13Densely populated regions on the coast show generally a higher level of commitment (Fallon and Sullivan, 2014).
14The Western Australian Department of Water and Environment Regulation is a merger of the Department of Environment
Regulation, the Department of Water and the Office of the Environmental Protection Authority. It was established in July
2017. Prior to that, the Office of the Environmental Protection Authority was in charge of the environmental impact
assessment process (Environmental Protection Authority, 2017).
20KlimRess – Climate change and mining in Australia: Case studies on bauxite, coking coal and iron ore
environmental impacts with national significance (e.g. national heritage areas), the federal
government needs to be involved, as well (Woods and Knight, 2016).
During and after mining operations, the states’ and territories’ environmental authorities control and
monitor the companies’ environmental performance. The Queensland Department of Environmental
and Heritage Protection oversees over 25 legislative Acts to safeguard environmental protection and
health and ensures compliance with these Acts either in a proactive way or in reaction to complaints
or incidents (Department of Environmental and Heritage Protection, 2017). In Western Australia, the
Department of Water and Environmental Regulation has similar duties.
A recent example of environmental management and regulation was in the aftermath of the
destructive Cyclone Debbie in March 2017, when the Queensland Department of Environmental and
Heritage Protection carried out a series of investigations into the coal port spill from the Abbot Point
Coal Terminal into the Caley Valley Wetland and its potential damaging impacts.15
Environmental authorities can also enforce sanctions, such as “formal letters of warning, infringement
notices, modified penalty fines or court prosecution” (Department of Water and Environmental
Regulation, 2017a). In Western Australia, the Department of Water and Environmental Regulation has
reported several fines of AUD$25,000 each imposed on mining companies for the discharge of 20,000
to 288,000 litres hypersaline water into the environment (Department of Water and Environmental
Regulation, 2017b).
Although Australian states and territories have generally strong environmental management and
regulation systems in place, there are some claims that more monitoring is needed. For example, the
environmental law firm Environmental Justice Australia states that harmful air pollution from coal
mining in central Queensland is not well monitored and that air quality data is hard to access, which
makes it difficult for people to make well-informed decisions concerning their health (Lodge, 2016;
Edwards, 2016).
4.3 Indigenous people and mining
According to the 2016 Census, indigenous people make up 3.3 per cent of the total Australian
population (Biddle and Markham, 2017). In regions where the analysed mining sites are located, the
share of the indigenous people is higher. In the Cape York region, 51.6 per cent of the population
identify as indigenous, whereas 19.5 per cent of Weipa town residents are indigenous (Australian
Bureau of Statistics, 2017a; 2017f). In the Isaac region, the indigenous population has a share of 3.6
per cent of the total population and in the town of Moranbah 3.9 per cent of the total population is
indigenous (Australian Bureau of Statistics, 2017c; 2017d). In East Pilbara, 17.9 per cent of the
population is indigenous, with 12.9 per cent of the population living in Newman being indigenous
(Australian Bureau of Statistics, 2017b; 2017e).
Australian indigenous people have faced a long history of discrimination since the first European
settlers arrived on the Australian continent in 1788. In general, they have significantly lower levels of
education, lower employment rates, poorer health and lower life expectancy than non-indigenous
Australians (Closing the Gap report, 2017).
Considering the impacts of extreme weather event and climate change, indigenous people are
generally more vulnerable than non-indigenous people. A scoping study for the Australian Department
of Climate Change and Energy Efficiency16 found in 2009 that “[t]he existing social and economic
disadvantage that exacerbates many remote Indigenous communities’ vulnerability to climate change
15 Further details on that case are provided in the section on recent weather extremes (see case study on coking coal mining,
section 6.5.1).
16 The Department was dissolved in March 2013 and superseded by the Department of Industry, Innovation, Climate Change,
Science, Research and Tertiary Education which was dissolved in September 2013. The division on climate change is now
incorporated in the Department of the Environment and Energy.
21KlimRess – Climate change and mining in Australia: Case studies on bauxite, coking coal and iron ore
cannot be overstated” (Green et al., 2009: 140). Poor housing quality, lack of health services, failure-
prone communication facilities and power and water services are major issues that reduce the
resilience of Indigenous people (Green et al., 2009). Furthermore, dependence on natural resources for
livelihoods and strong cultural connections to the land increases the vulnerability of indigenous
people (Green et al., 2009).
Although Australian indigenous people do not always oppose mining, the relationship between
indigenous groups and the mining industry is shaped by struggles over access to land and benefit
sharing. The period between the mid-1960s and the mid-1990s was characterised by a number of
conflicts between indigenous groups and the mining industry (Langton, 2015). This situation started
to improve after the introduction of the Native Title Act in 199317, which laid down a legal framework
for the recognition and protection of indigenous lands (Langton, 2015). The Native Title Act grants
indigenous people the right to negotiate an agreement with the entity that wants to use their land;
however, there is no veto right in line with the principle of Free Prior and Informed Consent (FPIC),
which means indigenous people do not have the formal right to withhold their approval of a mining
project (Doyle, 2015). An exception can be found in the Northern Territory’s legislation where the
principle of FPIC is stipulated by law since 1976 (Doyle, 2015).
The number of agreements between indigenous groups and mining companies and/or local,
State/Territory and federal governments or other bodies has increased from one or two in the 1970s
to around 4,000 agreements (Langton, 2015). Although the quality and successful implementation of
these agreements is not always evident, some improvements for Indigenous people have been
achieved (Langton, 2015).
In the case of bauxite mining in Weipa, after several years of struggle against the mining operations,
Traditional Owner groups and indigenous community Councils of the Wik people, the Cape York Land
Council, the Comalco Aluminium Limited (now part of Rio Tinto Alcan) and the government of
Queensland reached the Western Cape Communities Co-existence Agreement in 2001 (Doyle, 2015).
There are also two other agreements in place: the Ely Bauxite Mining Project Agreement and the
Weipa Township Agreement (Doyle, 2015). All three agreements can be considered significant
achievements as they “provide economic, education and employment benefits as well as cultural
heritage support and formal consultation processes between the company and the Traditional Owners
of the land on which Rio Tinto Alcan operates” (Doyle, 2015: 59). In the context of the South of Embley
project, Rio Tinto and the local indigenous people have agreed on the Communities, Heritage and
Environment Management Plan in 2014, which e.g. includes the protection of certain sacred areas and
employment opportunities (Rio Tinto Alcan and WCCCA, 2014).
In the Pilbara, BHP Billiton Iron Ore entered into its first major agreement with local indigenous
people in August 2012, which also covers the Mount Whaleback mine. After four years of negotiations,
the Nyiyaparli People achieved an agreement of financial and non-financial benefits, e.g. the protection
of their most important heritage sites (YMAC, 2012). Other indigenous people, the Banjima of the
central Pilbara, had to go to court to achieve the recognition of their native title claim in 2013 (Jabour,
2013). The government of Western Australia and the Banjima were not able to reach an agreement
outside of court during 13 years of negotiation (Jabour, 2013). Additionally, the Banjima People agreed
on a comprehensive deal with BHP Billiton in 2015 (Wahlquist, 2015).
There are no known agreements with indigenous communities concerning the Goonyella Riverside
mine.
Indigenous people face various challenges with regard to mining activities on their traditional lands
and reaching agreements. The recognition of a native title is not always granted by the state;
sometimes group representation and governance is difficult; and there are often concerns over the
17 Amended in 1998 and 2017.
22You can also read