Review of mine water reports in the Hotazel, Kathu and Postmasburg areas, Northern Cape - Client: Agri Northern Cape - Amazon S3
←
→
Page content transcription
If your browser does not render page correctly, please read the page content below
Review of mine water
reports in the Hotazel,
      Kathu and
 Postmasburg areas,
   Northern Cape
Dr. Kevin Pietersen with contributions from Zaheed
                      Gaffoor
           Reviewer: Dr. Hans Beekman

   Client: Agri Northern Cape
                  May 2018
               Revised Final Report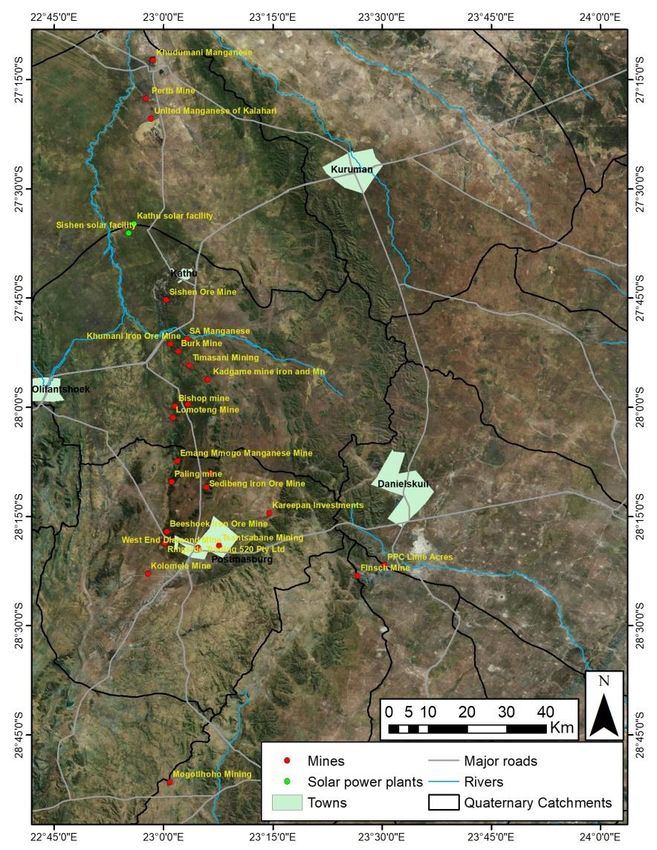
Review of mine water reports in the
      Hotazel, Kathu and Postmasburg
           areas, Northern Cape
EXECUTIVE SUMMARY

Since the 1930s there have been numerous investigations to better understand the
hydrogeology of the Hotazel, Kathu (Sishen) and Postmasburg areas in the Northern
Cape. There have been concerns about the dewatering operations of the Sishen Iron
Mine but there has been limited consideration in the studies of the cumulative dewatering
impact of all water users: agriculture, mining, (proposed) solar power generation facilities
and water supply, in the region – so called cumulative management. This has led to
concerns about the sustainability of groundwater abstractions in the region.

Agri Northern Cape approached Dr Kevin Pietersen to conduct a desk top review of mine
water reports made available by Agri Northern Cape to understand to which extent the
following issues are addressed in the reports: (a) aquifer characteristics; (b) groundwater
levels and flow, (c) recharge; (d) existing groundwater use and interference (including
cumulative impacts); and (e) reserve. The brief was not to review the technical
correctness of the reports provided but to gain an understanding to what extent the
reports made available by Agri Northern Cape address the above-mentioned issues and
what the gaps in knowledge are for the region. This study was a desk-top review of
groundwater literature with the aim to understand the issues in more detail.

The most significant impact of the mines in the region has been the dewatering of the
aquifers. The sources of water for dewatering are the banded iron formations (BIF) and
dolomites of the Ghaap Group. To predict changes in hydrogeological conditions resulting
from mine dewatering, the mines have constructed groundwater models at a local scale
with limited consideration of a broader perspective, i.e. a regional and holistic approach.
A regional and holistic approach allows for the assessment and evaluation of the
combined effect of abstractions of all stakeholders on the groundwater resources and
ultimately allows for appropriate groundwater management interventions. Note that the
groundwater modelling studies in the area were commissioned by the mines and are not
easily available in the public domain. The extent of the dewatering zones of the Sishen
Iron Ore and Kolomela Mines has been investigated extensively, whilst for the other
mines in the region there were no such detailed investigations accessible.

                                             i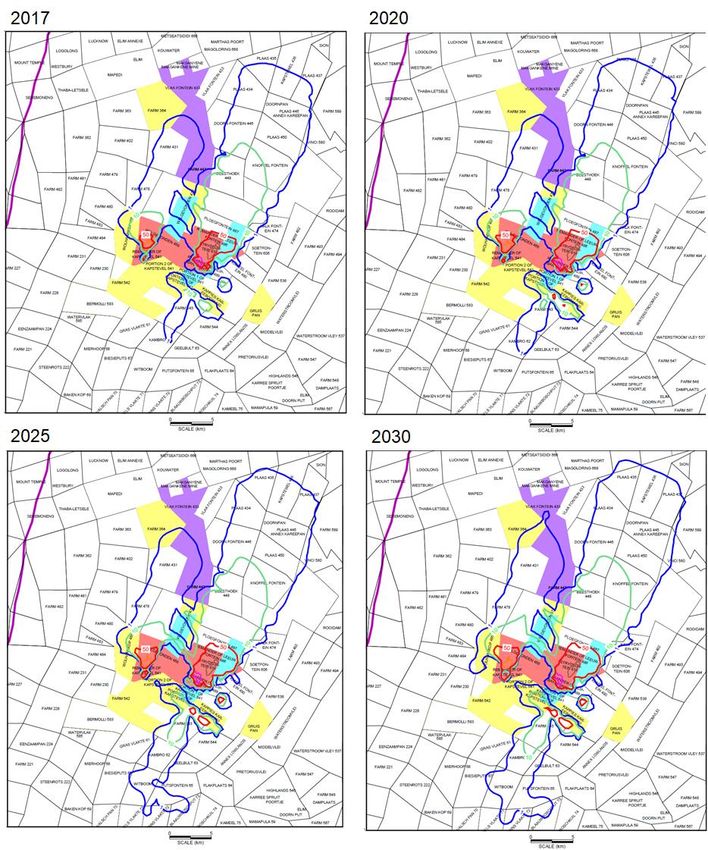
Groundwater discharge processes include evaporation and transpiration of groundwater,
and groundwater flow to the surface (seepage), including discharge to wetlands and
rivers and subsurface drainage. In semi-arid areas with relatively low rainfall,
quantification of groundwater recharge is complex because its rate is only a very small
fraction of the water balance (usually less than 5% of the average annual rainfall).
Recharge events in such environments are predominantly episodic or intermittent. This
means that rainfall is percolating to the water table only during extreme (surplus) rainfall
events. The dewatering of the aquifer systems means that flowing springs disappear and
baseflow is absent, giving rise to dry river beds (e.g. the Gamagara River). No major
visible discharge areas of the aquifer systems are observed except for discharge zones in
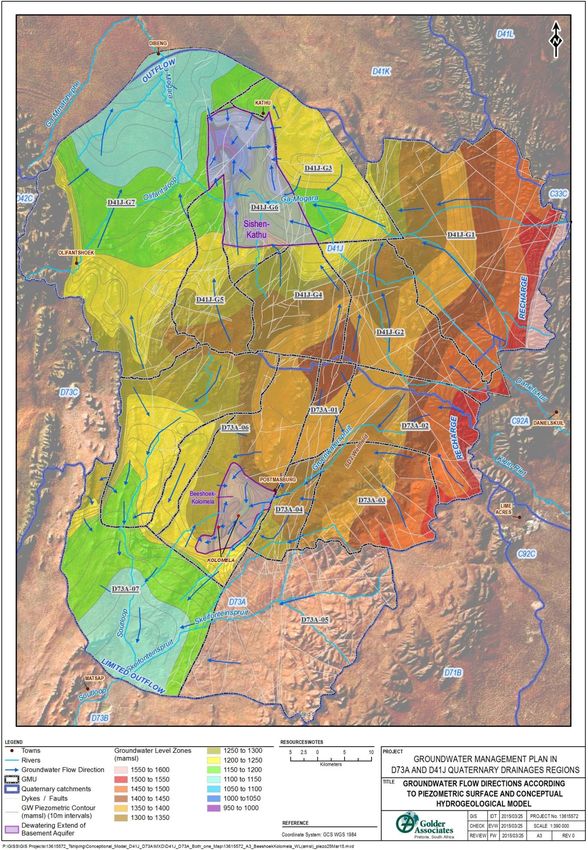
the Skeifontein Spruit. The natural groundwater drainage is from the eastern catchment
boundary (recharge area) in the east (Kuruman Hills) towards the outflow area at Dibeng.
Recharge can be local and indirect and is also induced as a result of the dewatering
activities. The Gamagara River is a gaining river outside the zone of dewatering. Inside
the dewatered zone (Moria to Demaneng and Demaneng to Mokaning) the Gamagara
River is a losing stream (recharging the aquifer). The aquifer is over-exploited
(abstraction from the aquifer exceeds sustainable rates). Discharge areas are difficult to
identify as the compartments are dewatered so the open pits are sinks to groundwater
flow in the region.
The absence of a holistic and integrated regional study makes it difficult to evaluate the
implications of large-scale groundwater abstraction on competing users. There are
concerns from stakeholders that water use licenses are issued without due regard of the
cumulative impact of these abstractions on the groundwater resources. The catchments
are water stressed (see reserve determinations). The water (consumption) footprint is
dominated by demand from the mining sector, followed by Local Municipalities,
agricultural sector and power generation. The challenge remains not only the provision of
adequate volumes of water for local economic development but also taking into account
spatial and temporal requirements. Only few studies have been conducted to understand
the cumulative implications of mine dewatering and large-scale abstraction on competing
groundwater users.
The decision-making framework developed by Seyler et al. [1] together with the
groundwater governance frameworks developed by Pietersen et al. [2,3] was used as a
basis for analysis of the sustainability of the resource. The analysis revealed the
following:
The current use of groundwater based on available literature is unsustainable. In the
catchments there are competing demands for groundwater consumption, i.e. water
ii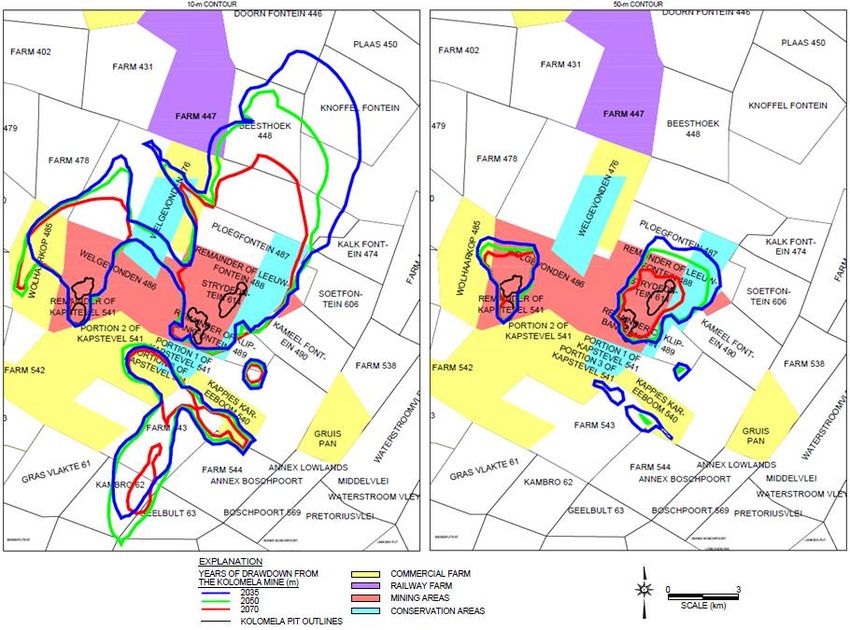
supply for domestic and industrial use and for agricultural purposes. Inspections and
investigations by Department of Water and Sanitation (DWS) indicated that a number of
mines in the region are operating without the needed water use authorizations. The
management of the groundwater resources must take into consideration not only
technical issues but also social and environmental aspects. The framework categories
identified in the table below were adapted to the local situation to analyse the
sustainability provisions for groundwater management in the region. In undertaking the
analysis, any areas where parts of the sustainability provisions are not addressed
represent a ‘gap’. The analysis reflected in the table is based on numerous sources of
information being provided and which were compiled, reviewed, and mined using a
framework analysis. Each of the identified gaps was categorised and colour-coded to
reflect the magnitude of the gap: (a) green (3) – criteria are met; (b) amber (2) – criteria
partially met; (c) red (1) – significant gap or absent.

Table:          Framework for analysis of sustainability provisions.

Capacity                Criterion                                  Context                                       Gap
Technical               Basic hydrogeological maps                 For identification of groundwater
                                                                                                                   3
                                                                   resources
                        Groundwater body/aquifer delineation       With classification of typology                 3
                        Availability of aquifer numerical          At least preliminary for strategic critical
                                                                                                                   3
                        ‘management models’                        aquifers
                        Change in natural discharge                Detection of change in water table
                                                                                                                   2
                                                                   towards discharge point
                                                                   Assessment of discharge                         2
                                                                   Flow in discharge-receiving
                                                                                                                   2
                                                                   environment
                                                                   Chemical composition of discharge-
                                                                                                                   1
                                                                   receiving environment
                        Change in pre-abstraction recharge         Detection of change in water table
                                                                                                                   2
                                                                   towards recharge zone
                                                                   Direct detection of change in water
                                                                                                                   2
                                                                   table in recharge zone
                                                                   Indirect detection of change in water
                                                                                                                   1
                                                                   table in recharge zone
                                                                   Assessment of surface water flows in
                                                                                                                   2
                                                                   recharge zone
                                                                   Chemical tracer for recharge source             1
                                                                   Increased recharge                              2
                        Change in storage                          Detection of change in water table              2
                        Response time/status of aquifer            Age of water
                                                                                                                   1
                        towards new dynamic equilibrium
                        Quantification of the relationship         The shape, gradient and scales of the
                        between increasing abstraction and         curves will vary for each system
                                                                                                                   2
                        reducing discharge and other aquifer
                        flows
                        Recovery assessment                        If this is very long, then the flows at a
                                                                   reasonable water supply planning and
                                                                                                                   1
                                                                   environmental timescale should be
                                                                   determined
Legal and               Water well drilling permits &              For large users, with interests of small
                                                                                                                   2
institutional           groundwater use rights                     users noted
                        Instruments to reduce groundwater          Water well closure/constraint in critical
                                                                                                                   1
                        abstraction                                areas
                        Instruments to prevent water well          In overexploited or polluted areas
                                                                                                                   1
                        construction

                                                            iii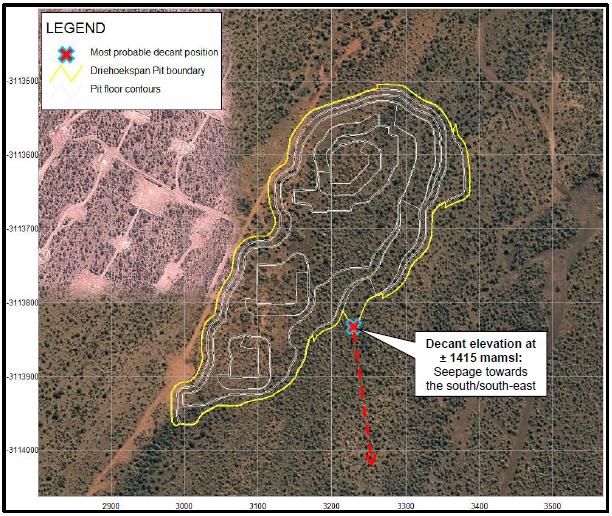
Capacity Criterion Context Gap
Sanction for illegal water well Penalizing excessive pumping above
1
operation permit
Groundwater abstraction & use ‘Resource charge’ on larger users
2
charging
Land use control on potentially Prohibition or restriction since
2
polluting activities groundwater hazard
Levies on generation/discharge of Providing incentives for pollution
1
potential pollutants prevention
Government agency as ‘groundwater Empowered to act on cross-sectoral
2
resource guardian’ basis
Community aquifer management Mobilising and formalising community
2
organisations participation
Cross-Sector Coordination with agricultural, mineral Ensuring ‘real water saving’ and
2
Policy and social development pollution control
Coordination Groundwater based urban/industrial To conserve and protect groundwater
2
planning resources
Compensation for groundwater Related to constraints on land-use
2
protection activities
Operational Public participation in groundwater Effective in control of exploitation and
1
management pollution
Existence of groundwater With measures and instruments
2
management action plan agreed
This analysis has highlighted gaps that need to be addressed to support sustainable
development of groundwater resources in the region. The indicators which are not met
focus on priority interventions. The benchmarking criteria proposed, which incorporates
international best practices, are there to evaluate the groundwater sustainability and
governance and to ensure good processes are put in place to reflect the voices and
interest of stakeholders.
An approach similar to a strategic environmental assessment is required to analyse the
cumulative impact of large-scale groundwater dewatering and abstraction on groundwater
users and environment. The groundwater resources and particularly the dolomite aquifers
are at risk of being dewatered unless regulations are enforced. Based on the evaluation
of numerous reports and the gap analysis, it is recommended to:
Establish a groundwater monitoring network that takes into account monitoring of
recharge and discharge areas;
Establish a standardised regional digital relational database that combines data
from all water users. The design should accommodate for all monitoring points,
all categories of data and different data collection scheduling (frequency), and
inclusion of historical data. Use of a common database will facilitate comparison
among different sites. To this end a database for the two catchment areas (D41J
& D73A) have been developed by Tshiping Water User Association that is
accessible for all stake holders (F Goussard Personal Communication);
Access to the common database for all water users; and
Develop a regional numerical model(s) to address the gaps identified in the
framework analysis.
iv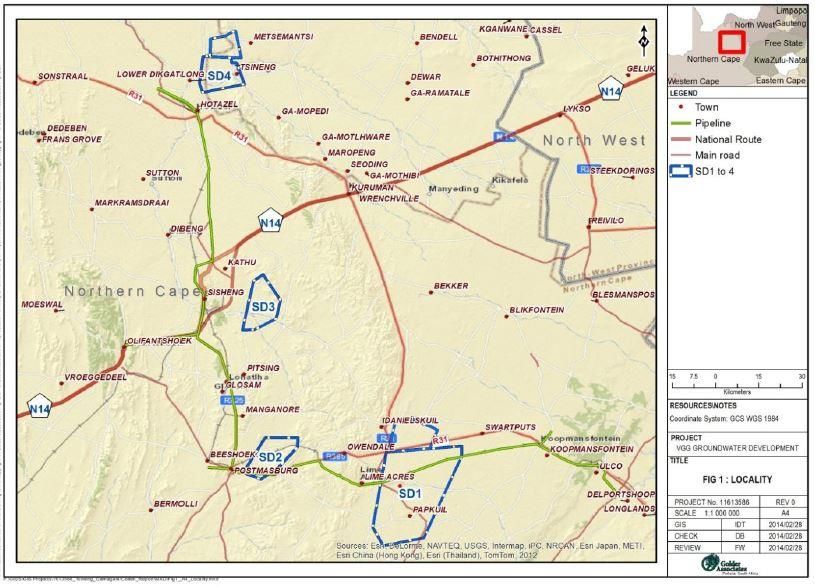
In conclusion, a technical-institutional model is required that facilitates decision-making
and trust among all stakeholders. One such model is the International Water Stewardship
(IWaSP) approach that builds multi-stakeholder partnerships between businesses,
governments and civil society with companies in various sectors such as agriculture,
hydropower, mining, beverage, food and textiles. The Water Risk and Action Framework,
was   developed     by   IWaSP     for   establishing   and   implementing    partnerships
(https://ceowatermandate.org/wraf/about/). The framework consists of five phases
(prepare, assess, commit, act, scale and exit) and serves to guide the creation and
execution of partnerships and should be applied taking into account the local situation –
see figure. I believe that components of such a structured process, especially water risk
assessment, identification of mitigation options and formulation and implementing
measures that address shared water risks, which is solution-focussed and action-
oriented, will benefit the stakeholders in the Northern Cape. This can form the basis of a
Strategic Environmental Assessment.

                                             v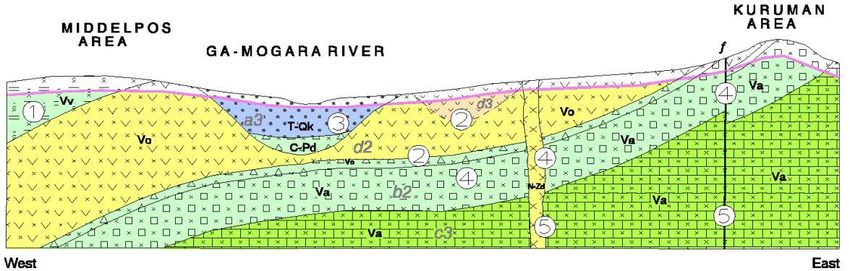
TABLE OF CONTENTS

Executive Summary ..............................................................................................................i
Table of Contents ................................................................................................................ vi
List of figures ...................................................................................................................... vii
List of tables ...................................................................................................................... viii
List of appendices ............................................................................................................. viii
List of acronyms .................................................................................................................. ix
1.            Introduction .......................................................................................................... 1
2.            Site description and Regulatory context .............................................................. 5
              2.1.           Site description ..................................................................................... 5

              2.2.           Regulatory context ............................................................................... 8

3.            Approach to the Assignment ............................................................................... 9
4.            Results ............................................................................................................... 10
              4.1.           Scale of mine dewatering ................................................................... 10

              4.2.           Impact of mine dewatering ................................................................. 24

              4.3.           Discharge and recharge areas ........................................................... 26

              4.4.           Groundwater use and interference ..................................................... 34

              4.5.           Cumulative impacts ............................................................................ 37

5.            Discussion ......................................................................................................... 39
6.            Conclusion ......................................................................................................... 42
7.            Acknowledgements............................................................................................ 44
8.            References ........................................................................................................ 44
Appendix 1:                  Review of mine and related water reports.......................................... 48
              Beeshoek Iron Ore Mine .................................................................................... 48

              Bestwood Estate ................................................................................................ 49

              Coza Mine .......................................................................................................... 49

              Essential Prospects 101 (Pty) Ltd ..................................................................... 50

              Finch Iron Ore Mine ........................................................................................... 50

              K2012077655 (Pty) Ltd ...................................................................................... 51

              Khumani Iron Ore Mine...................................................................................... 51

              Kolomela Mine ................................................................................................... 52

              Kudumane Manganese Mine ............................................................................. 61

              Lomoteng Mine .................................................................................................. 62

                                                                   vi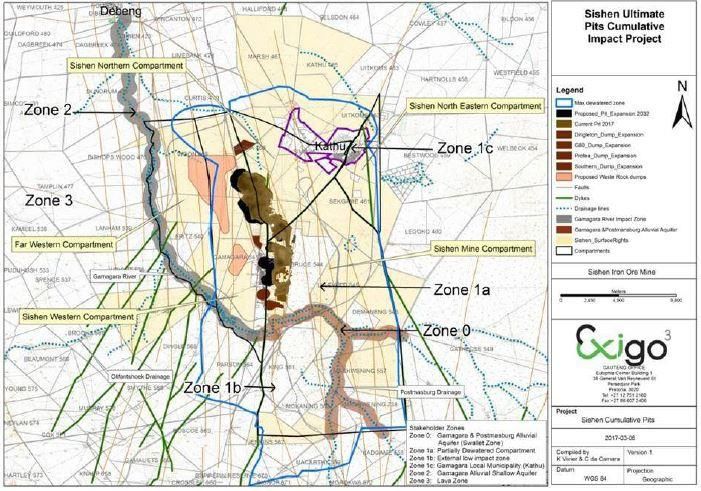
Sishen Iron Ore Mine ......................................................................................... 62

            Wincanton Solar Energy Power Plant ............................................................... 73

LIST OF FIGURES

Figure 1:                Regional geological map of the Maremane Dome region in the
                         Northern Cape Province indicating the location of the Sishen,
                         Khumani, Beeshoek and Sishen South iron ore deposits (modified
                         after Van Schalkwyk and Beukes, 1986 as cited by Smith and Beukes
                         [5]). ....................................................................................................... 2
Figure 2:                (a) Regional map of the Transvaal Supergroup in Griqualand West
                         showing the distribution of the Kalahari Manganese Field and Black
                         Ridge        thrust      fault.      (b)     Schematic           diagram          indicating         lateral
                         interfingering of the Hotazel and Mooidraai formations of the KMF on
                         the Kaapvaal Craton to the east, in the footwall of the Black Ridge
                         thrust fault with the Beaumont Formation to the west off the craton in
                         the hangingwall of the thrust (from Cairncross and Beukes, 2013 as
                         cited by Beukes et al [6]). ..................................................................... 3
Figure 3:                Location map of area under investigation showing rivers, mines,
                         population centres and proposed renewable power generation
                         stations. ................................................................................................ 5
Figure 4:                Water use by sector in 2015 and 2030 from the Vaal Gamagara Water
                         Supply Scheme [14]. The 2015 water use figures for Kalahari East
                         include agriculture water use. .............................................................. 6
Figure 5:                Generalized hydrogeological framework of the study area [23]. .......... 7
Figure 6:                Current licenced abstraction (section 21(a)) and dewatering volumes
                                                   3
                         (section 21(j)) (m /a) as per water use license authorisations. .......... 10
Figure 7:                Groundwater compartments and impacted zones 2016 (Meyer (2016)
                         as cited by Exigo [17]). ....................................................................... 11
Figure 8:                Dewatering volumes from Sishen Iron Mine [35]. .............................. 13
Figure 9:                Cumulative dewatering of Sishen Iron Mine [35]. .............................. 14
Figure 10:               Representation             of     the       groundwater           levels      in the dewatering
                         compartment before and after dewatering activities [12]. .................. 15
Figure 11:               Sishen Mine Compartments and future simulated impact zones - 2032
                         (Itasca, 2016 as cited by Exigo [17]). ................................................. 16
Figure 12:               Kolomela Mine with pit locations (Leeuwfontein (LF), Klipbankfontein
                         (KB), Kapstevel North (KSN), and Kapstevel South (KSS) [57]......... 17
Figure 13:               Pumping rate for the dewatering boreholes at Kolomela Mine [57]. .. 18

                                                               vii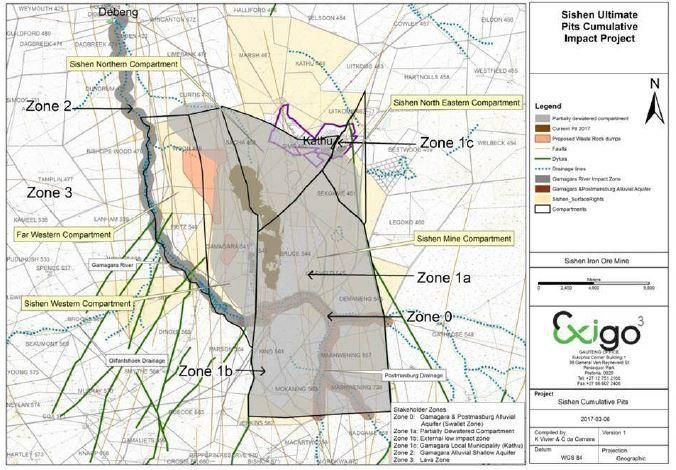
Figure 14:    Predicted drawdown for Kolomela mine up to 2030 [57]. .................. 19
Figure 15:    Change in areal extent of 10-m and 50-m contour lines over time [57].
              ............................................................................................................ 20
Figure 16:    Positions of active iron ore mines relative to the proposed three Coza
              Project areas [65–67] ......................................................................... 21
Figure 17:    Most probable decant position for the Driehoekspan Pit [66]. ........... 22
Figure 18:    Example hydrograph in the Sishen and Postmasburg area (NGA
              database). .......................................................................................... 25
Figure 19:    Piezometric Map of the D41J and D73A quaternary catchments based
              on the 2013 groundwater level elevations [9]. ................................... 28
Figure 20:    Local map showing the land cover with comparison between a dry
              (2013) and a wet (1990) year [76]. ..................................................... 29
Figure 21:    D41J monthly rainfall 1920-2009 (WR2012) [76]. .............................. 31
Figure 22:    D73A monthly rainfall 1920-2009 (WR2012) [76]. ............................. 32
Figure 23:    Water level vs rainfall in boreholes outside the July 2010 dewatering
              zone [12]. ............................................................................................ 33
Figure 24:    Cumulative           groundwater             abstraction           compared            to     cumulative
              groundwater [15]. ............................................................................... 34
Figure 25:    Source development areas [77]. ........................................................ 35
Figure 26:    Water balance - Vaal River and Source Development (SD) sources
              [14]...................................................................................................... 35

LIST OF TABLES

Table 1:      Mines that were monitored in the 2016/2017 financial year by the
              DWS [29]. ............................................................................................. 8
Table 2:      Groundwater compartments and zones [17]. ..................................... 12
Table 3:      Groundwater levels and impacted zones [17]. ................................... 13
Table 4:      Summary of Golder detailed Reserve determination (2015) volume in
                   3
              Mm /a as cited by van Dyk [8]. ........................................................... 36
Table 5:      Solar power plants and their water requirements. ............................. 37
Table 6:      A framework for analysis of sustainability provisions [1–3]. ............... 39

LIST OF APPENDICES

Appendix 1:   Review of mine and related water reports .......................................... 48

                                                    viii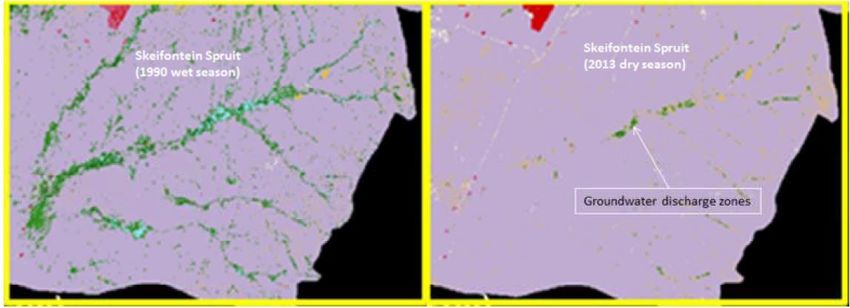
LIST OF ACRONYMS

BIF     Banded iron formations
DWS     Department of Water and Sanitation
GMUs    Groundwater Management Units
KMF     Kalahari Manganese Fields
IWaSP   International Water Stewardship
m³/a    Cubic metres per annum
 3
m /hr   Cubic metres per hour
3-D     Three dimensional

                                          ix
1. INTRODUCTION
The Northern Cape Province has significant mineral deposits of iron ore and manganese
1
associated with the Transvaal Supergroup which are preserved in the Griqualand West
Basin. The Griqualand West Basin consists of a basal carbonate platform sequence,
which is conformably overlain by the banded iron formation (BIF), and in turn is overlain
by chemical and clastic sediments that are succeeded by Makganyene Formation
diamictite and Ongeluk Formation basalt and basaltic andesite [4]. Currently, the bulk of
South Africa’s iron ore production comes from four mines (Figure 1) on the Maremane
2
Dome in Griqualand West, namely the Sishen and Khumani Mines along the northern
margin of the dome, and the Beeshoek and Kolomela Mines in the south [5]. Limestone is
also mined locally at places such as Lime Acres. The Kalahari Manganese Fields (KMF),
located in the Hotazel Formation of the Postmasburg Group, is the largest single
manganese depository in the world and accommodates for all of the country’s
manganese mines [6]. The iron and manganese mine require dewatering as part of their
mining operations. The consequences of water table depression due to mine dewatering
include [7]:
(a) Decreased flows in streams and wetlands that are in hydraulic contact with the
affected groundwater body;
(b) Lowering of the water table in the vicinity of water supply/irrigation boreholes,
leading to an increase in the pumping head (and therefore in pumping costs), if
not to the complete drying up of boreholes;
(c) Collapse of voids in karstic terrains as buoyant support is withdrawn; and
(d) Surface water and/or groundwater pollution, if the pumped mine water is of poor
quality and is discharged to the natural environment without prior treatment.
1
The late Archaean to early Proterozoic Transvaal Group is preserved within three structural basins on the
Kaapvaal Craton of Southern Africa: the Transvaal and Griqualand West Basins in South Africa and the Kanye
Basin in Botswana [123].
2
Dolomite and limestone deposits of the Campbell Rand Subgroup.
1Figure 1: Regional geological map of the Maremane Dome region in the Northern Cape Province indicating
the location of the Sishen, Khumani, Beeshoek and Sishen South iron ore deposits (modified after
Van Schalkwyk and Beukes, 1986 as cited by Smith and Beukes [5]).
2Figure 2: (a) Regional map of the Transvaal Supergroup in Griqualand West showing the distribution of the
Kalahari Manganese Field and Black Ridge thrust fault. (b) Schematic diagram indicating lateral
interfingering of the Hotazel and Mooidraai formations of the KMF on the Kaapvaal Craton to the
east, in the footwall of the Black Ridge thrust fault with the Beaumont Formation to the west off the
craton in the hangingwall of the thrust (from Cairncross and Beukes, 2013 as cited by Beukes et al
[6]).
Since the 1930s there have been numerous investigations to better understand the
hydrogeology of the Postmasburg and Sishen areas in the Northern Cape. There have
been concerns about the dewatering operations of the Sishen Iron Mine but there has
been limited consideration in the studies of the cumulative dewatering impact of all water
users: agriculture, mining, (proposed) solar power generation facilities and water supply,
in the region – so called cumulative management. This has led to concerns about the
sustainability of groundwater abstractions in the region [8,9].
3Agri Northern Cape approached Dr Kevin Pietersen to conduct a desk top review of mine
water reports made available by Agri Northern Cape to understand to which extent the
following issues are addressed in the reports:
(a) Aquifer characteristics;
(b) Groundwater levels and flow,
(c) Recharge;
(d) existing groundwater use and interference (including cumulative impacts); and
(e) Reserve.
The brief was not to review the technical correctness of the reports provided but to gain
an understanding to what extent the reports made available by Agri Northern Cape
address the above-mentioned issues and what the gaps in knowledge are for the region.
The extent of the dewatering zones of the Sishen Iron Ore and Kolomela Mines have
been investigated extensively and made available, whilst for the other mines in the region
there were no such detailed investigations publically accessible or made available. The
reports outcomes were summarised in the appendix of the main report but the content
thereof where relevant was analysed in the main report. This study is a desk-top review
of groundwater literature with the aim to understand the issues in more detail:
Sources of water for mine dewatering;
Recharge and discharge areas;
Existing groundwater use and interference (including cumulative impacts); and
Sustainability of the resource.
42. SITE DESCRIPTION AND REGULATORY CONTEXT
2.1. Site description
The study area predominantly falls within the D4 and D7 secondary catchments of the
Vaal Water Management Area (Figure 3). The ephemeral Gamagara River drains the
area and flows westward to join the Kuruman River further downstream. Possibly 97% of
the time the [Gamagara] River is dry, but during heavy downpours, as sometimes
happens during the summer rainfall season, strong flows occur [10,11]. Smaller flows are
attenuated rapidly in the dry soils while the larger flows travel further and these flows last
at most for a few days before the water disappears into the [Gamagara] River bed along
the length of the river [10,11]. Transmission losses in the Gamagara River increased in
association with the mining dewatering activities in the dewatering zone, as well as due to
the swallets [12,13].
Figure 3: Location map of
area under investigation
showing rivers, mines,
population centres and
proposed renewable power
generation stations.
53
The Vaal Gamagara Water Supply Scheme from Delportshoop to beyond Hotazel is the
main bulk regional water infrastructure but has exceeded its lifespan [14]. The Vaal River
water is augmented with groundwater sourced from dewatering activities at Kolomela and
Sishen Iron Ore Mines. Current demands from the Vaal Gamagara Water Supply Scheme
3
are about 20 million cubic metres per annum (m /a) (Figure 4). Plans have already been
put in place by the Department of Sanitation (DWS) to upgrade the Vaal Gamagara
Water Supply Scheme to meet the projected 2030 demand of 35 - 40 million m³/a. The
local municipalities requiring water supply are: Dikgatlong, Tsantsabane, Gamagara, and
Joe Morolong. The region relies on mining for economic prosperity and mining is the
major water user in the region. The other users include agriculture (mainly stock watering
along the scheme and agricultural and domestic use), government water supply (Lohatla
Military Base, Koopmansfontein Experimental Farm and others) and also potential solar
power projects [14]. Agriculture water use requirements for 2030 are estimated at 0.1
3
million m /a representing less than 1% of the demand.
25
Millions
Water use and demand projectsions m3/a
20
15
10
5
2015
0 2030
Local municipalities
Agriculture
Kalahari East
Mining and Industry
Government and Parastatals
Botswana
Figure 4: Water use by sector in 2015 and 2030 from the Vaal Gamagara Water Supply Scheme [14]. The
2015 water use figures for Kalahari East include agriculture water use.
3
The Vaal Gamagara Water Supply Scheme was completed in the late sixties with the purpose to supply Vaal
River water to the arid areas of the Gamagara valley near Postmasburg and north thereof [14]. This was done to
enable large scale diamond mining at Lime Acres and the mining of iron ore and manganese at Beeshoek,
Sishen, Mamatwan, Hotazel and Blackrock [14]. Several local authorities receive water from the scheme of
which the towns of Delportshoop, Postmasburg, Kathu and Hotazel are the largest [14]. The Kalahari East
scheme was completed in 1992 to supply domestic and stock water to an area of approximately 1 412 000
hectares that includes more than 250 farms [14].
64
Two major aquifer systems have been identified in the region [15] (Figure 5). The deeper
secondary aquifers are present in the dolomite and BIF. These aquifers are associated
with fracturing and weathering of the formations and are compartmentalised with dykes
5
and other aquitards , such as the Dwyka Group (tillite) and some formations of the
Kalahari Group [11,16,17]. The groundwater flow is controlled by the regional dykes and
faults [18]. A shallow aquifer is developed within the Kalahari sediments, mainly within the
calcrete beds [11,19]. Shallow aquifers is also associated with the Gamagara River and
6
Groenwaterspruit alluvial deposits [16,17,20]. The shallow aquifers can be separated
from the deep aquifers by lower permeability dykes or clayey layers [16]. There is
reference to a confined fractured Dwyka aquifer by SLR [21,22] that overlies older
lithologies of the Ongeluk Andesite and Asbestos Hills formations.
Vv Joints and fractures in the quartzites that dominate the Volop Group (Vv) can be targeted for
groundwater development. Yields up to 2l/s can be obtained. Better quality groundwater is
associated with higher yielding areas.
Vo Weathered zones and occasional joints and fractures in the andesitic lavas and infrequent
interbeds of chert and jasper, as well as basal (Makganyene Formation) diamictite, all of the
Postmasburg Group (Vo) can be recommended for development. Yields generally not exceeding
2l/s and electrical conductivities (EC) of less than 300mS/m can be anticipated.
T-Qk Glacial valleys formed during Dwyka Group (C-Pd) times and filled with tillite and subsequently
with Kalahari Group (T-Qk) sediments offer usable groundwater with yields of up to 2l/s and ECs
averaging less 300mS/m.
Va The groundwater potential of the BIF of the Ghaap Group (Va) is limited but yields of up to 2l/s can
be obtained in joints and fractures associated with faults and diabase dykes.
Va Dolomite of the Ghaap Group (Va) generally has good groundwater potential and yields more than
2l/s are common. Groundwater can be developed from fractures, joints and solution cavities
commonly associated with faults and diabase dykes, as well as from fractured, subordinate
carbonaceous shale beds. Faults and dykes can be easily targeted due to the occurrence of
calcrete mounds and trees along these structures. Solid structureless dolomite, however, should
be avoided when siting boreholes.
Figure 5: Generalized hydrogeological framework of the study area [15].
4
Rock or sediment in a formation, group of formations, or part of formation that is saturated and sufficiently
permeable to transmit economic quantities of water [124].
5
A low-permeability unit that can store groundwater and also transmit it slowly from one aquifer to another
[124].
6
Sediments deposited by rivers.
72.2. Regulatory context
The National Water Act [23] provides the legal framework for water regulation in South
Africa. Water authorisation is regulated through water use licenses. To achieve the
reforms as guided by the principles of equity and sustainability, the National Water Act
must authorise water use with conditions in order to regulate the use, flow and control of
all water in the country [23,24]. The weak administration of water use licenses and
enforcement of water use license conditions has resulted in water users operating
illegally, with frequent transgressions and non-compliance with water use conditions [25–
27].
Inspections and investigations indicated that a number of mines [in the region] are
operating without the required water use authorisations [28]. There are 37 water users
listed, consisting of 30 mines, 1 domestic supplier and 6 industries generating solar
power (Figure 3). Thirteen of the water users are authorised with the remaining
unauthorised or in the process of application or application being processed [28]. Table 1
lists the mines in the Northern Cape that were monitored in the 2016/2017 financial year
by the DWS. Out of 111 mines that were monitored countrywide during the 2016/2017
financial year, 55 mines were found to be significantly in breach of the conditions of the
water use license of which 25 mines were referred for enforcement actions [29]. The
other 30 mines were requested to provide action plans to address non-compliance [29].
Table 1: Mines that were monitored in the 2016/2017 financial year by the DWS [29].
Mine Name Finding/Motivation
Kalagadi Manganese Mine Good but at risk 50-74%
PMG Not acceptable 0-24%
Hotazel Manganese Mine: Hotazel site Not acceptable 0-24%
Hotazel Manganese Mine: Wessels Mine Not acceptable 0-24%
Hotazel Manganese Mine: Middleplaats Not acceptable 0-24%
Hotazel Manganese Mine: Mamatwan mine Not acceptable 0-24%
Schmidtsdrift Mine Not acceptable 25-49%
Assmang: Black Rock Not acceptable 0-24%
Huatian Manganese Good but at risk 50-74%
Rooipoort Mine Not acceptable 25-49%
Mr M Mdlulane Acceptable 75-100%
MN Mbonose Acceptable 75-100%
Sishen Iron Ore Not acceptable 25-49%
Scarlet Sun Mine Not acceptable 25-49%
De Beer Micro Diamonds Good but at risk 50-74%
Mr OA Witkoei Acceptable 75-100%
HE Louw Acceptable 75-100%
Mrs FE Mali Acceptable 75-100%
BM Marman Acceptable 75-100%
Crown Resources Not acceptable 25-49%
83. APPROACH TO THE ASSIGNMENT
The analysis in this report is based on numerous sources of information provided by the
Client which were compiled, reviewed and mined using a framework analysis approach.
The decision-making framework developed by Seyler et al. [1] together with groundwater
7
governance frameworks developed by Pietersen et al. [2,3] was used as a basis for
8
analysis of the sustainability of the resource. The framework method is an excellent tool
for supporting thematic (qualitative content) analysis because it provides a systematic
model for managing and mapping the data. The conclusions of the mine reports reviewed
are given as a compendium in Appendix 1.
7
A working definition for groundwater governance [125] “the overarching framework of groundwater use laws,
regulations, and customs, as well as the processes of engaging the public sector, the private sector, and civil
society.
8
Gleeson et al. [126] consider groundwater sustainability a value- driven process of intra- and intergenerational
equity that balances the environment, society, and economy. This
94. RESULTS
4.1. Scale of mine dewatering
Dewatering is required for safe operations of mine workings both to ensure access to the
mineral reserves and to ensure safety of personnel and protection of equipment. Mine
dewatering is normally achieved by lowering the water table and disposal of the pumped
water. The abstraction of groundwater will eventually be matched by some combination of
the following three responses [7]:
(a) Decrease in the volume of groundwater in natural storage;
(b) Increase in the rate of groundwater recharge; and
(c) Decrease in the rate of natural groundwater discharge.
Current dewatering and groundwater abstraction activities are dominated by Sishen Iron
Ore Mine and Kolomela Iron Ore Mine as shown in Figure 6. The National Water Act lists
a number of water uses, which includes section 21(a) taking water from a water source
and section 21(j) removing, discharging or disposing of water found underground if it is
necessary for the efficient continuation of an activity or for the safety of people [23].
40
Millions
35
30
25
20
15
10
5
0
Beeshoek
Direleton Minerals and Energy
Finch Mine
Kolomela
PPC Lime Acres
PMG Bishop Mine
Sedibeng Iron Ore mine
Sishen Iron Ore Mine
West End Diamond Mine
Section 21(a) Section 21(j)
Figure 6: Current licenced abstraction (section 21(a)) and dewatering volumes (section 21(j)) (m3/a) as per
water use license authorisations.
10The dewatering of the mines has a negative impact on groundwater users and certain
sections of the Gamagara River [12]. There has been loss of aquifer pressure [12,30–32]
and consequential leakage from aquifers and river systems [12,30–33].
4.1.1. Sishen Iron Ore Mine
The groundwater systems at Sishen Iron Ore Mine have been compartmentalised by
numerous subvertical to vertical dykes as shown in Figure 7. This has resulted in a
complex hydrogeological setting. The groundwater compartments and zones are
described in Table 2. The impact of dewatering at the Sishen pit is mainly on the
fractured and brecciated banded ironstone and chert formations as well as the fractured
and karstified basement dolomite [30,17]. Groundwater dewatering at Sishen Iron Ore
Mine began in the 1960s [34]. Figure 8 shows the amount of water that has been
abstracted to dewater the Sishen Iron Ore Mine since the late 1960s as compiled by
Meyer [35] from mine and other records. The cumulative dewatering volumes are given in
Figure 9. The consequence of the dewatering has been a decline in groundwater levels in
the in the groundwater compartments and impacted zones as illustrated in (Figure 7) and
discussed in Table 2.
Figure 7: Groundwater compartments and impacted zones 2016 (Meyer (2016) as cited by Exigo [17]).
11Table 2: Groundwater compartments and zones [17].
Compartment/ Description
groundwater zone
Sishen Mine The Sishen Mine Compartment that has been dewatered. The boundaries of this
Compartment compartment are formed by an east-west dolerite dyke, two north-south diabase dykes,
a northwest- southeast diabase dyke and a northeast-southwest diabase dyke. The
latter dyke has been mined through and breached. This compartment is in constrained
hydraulic connection with some of the neighbouring compartments. Constrained
hydraulic connection means that there is no direct link across which groundwater can
flow freely. The constrained flow is called leakage. The constrained hydraulic connection
is due to the fact that some dykes are younger than others, notably the dolerite dyke is
much younger than the diabase dykes. The younger dykes cut through the older dykes.
There are also faults that are inferred to cut through some of the dykes.
Sishen North- The Sishen North-Eastern Compartment that is partially impacted by dewatering. It is
Eastern inferred that leakage takes place from this compartment across the diabase dyke/s to
Compartment the Sishen Mine Compartment. This compartment’s western boundary is formed by the
northeast-southwest diabase dyke and the northwest-southeast diabase dyke.
Sishen Northern The Sishen Northern Compartment is partially dewatered. The southern boundary of this
Compartment compartment is formed by the two diabase dykes (northeast-southwest and northwest-
southeast dykes). The northern boundary of this compartment is formed by the Dwyka
Tillite Aquitard.
Sishen Western The Sishen Western Compartment is partially impacted by dewatering. This
Compartment compartments eastern boundary is formed by the north-south trending diabase dyke that
forms the western boundary of the Sishen Mine Compartment. Leakage takes place
across constrained hydraulic connections from the Western Compartment to the Sishen
Compartment. The western boundary of this compartment is formed by an inferred dyke
across which groundwater levels vary by 20-50 m (Meyer, personal communication).
This inferred dyke has to date been intersected in one borehole but has not been yet
been geophysically traced. A weak geophysical (magnetic) signature is expected due to
the thick Kalahari Group cover.
Sishen Far Western Groundwater conditions have not been impacted in the Sishen Far Western
Compartment Compartment. This compartment is to the west of the Sishen Western Compartment and
extends towards the Gamagara River and beyond. The exact western extent of this
compartment and groundwater head elevations is uncertain as it is far from the Sishen
Mine Compartment.
Shallow upper The shallow upper calcrete and Kalahari Aquifer/s is formed by recent geological
calcrete and deposits and overlies the deep aquifers. It is not constrained by the dyke boundaries of
Kalahari Aquifer the deep aquifers. The shallow aquifers are separated from the deep aquifers by a thick
[zone] clay aquiclude9. The clay aquiclude is continuous in the central and northern sections
but are discontinuous to the south. Groundwater in the shallow aquifer seeps towards
the mine within an impacted zone, which is limited to a 500 m zone from the pit
boundary. The seepage does not contribute materially to the dewatering rates of the
mine, as most evaporates at the pit face. A characteristic of the shallow aquifer is its low
groundwater potential. Groundwater seeps to the Gamagara River Alluvial Aquifer
where it contributes to hyporheic flow10.
Gamagara River The Gamagara River Alluvial Aquifer forms a groundwater zone along the Gamagara
Alluvial Aquifer River. This aquifer has mainly hyporheic flow below the alluvium. The vertical thickness
[zone] of this aquifer varies between 10 m to ±75 m [36]. It has three sub zones. The first is the
zone upstream of the Sishen Mine Compartment where the weathered/fractured
aquifers (mainly BIF and dolomite) feed hyporheic flow into the Gamagara Alluvial
Aquifer. The upstream zone is inferred to have a minor impact due to leakage across
and above the eastern diabase dyke boundary to the Sishen Compartment. The
Gamagara Alluvial Aquifer overlies the diabase dykes as it is younger. The zone of the
Gamagara Alluvial Aquifer in the Sishen Mine Compartment is dewatered and does not
exist in this area anymore, except during and after flood events when it can have a
temporary existence. The downstream zone receives hyporheic flow from the shallow
calcrete aquifer, and is not impacted directly by the dewatered Sishen Mine
Compartment. The upstream zone is still recharged by Gamagara River surface flows
which occurs every 5-8 years and during rainfall events. The downstream zone does not
frequently receive surface flows from the upstream zone as these mainly drain into the
Sishen Mine Compartment via swallet zones [36]. It is impacted in that recharge due to
flood events does not reach the downstream environment, except during big flood
events. The downstream impacted area in this zone has been delineated to Dibeng [37].
The downstream zone does receive surface flows from the environment downstream
from the Sishen Compartment and for example from the Olifantsloop tributary. It does
receive recharge from direct rainfall in between flood events.
9
A low permeability unit that forms either the upper or lower boundary of a groundwater flow system [124].
10
Hyporheic flow is the transport of surface water through sediments in flow paths that return to surface water
[127].
1230
25
Dewatering volumes million m3/a
20
15
10
5
0
1967
1970
1973
1976
1979
1982
1985
1988
1991
1994
1997
2000
2003
2006
2009
2012
2015
Figure 8: Dewatering volumes from Sishen Iron Mine [35].
Table 3: Groundwater levels and impacted zones [17].
Groundwater levels and Description
impacted zones
Zone 0 - Gamagara River This area is impacted on due to the partial dewatering of the Sishen
Alluvial Aquifer zone compartment.
Zone 1a - Partially dewatered It covers an area of 26 300 ha and is the partially dewatered Sishen Mine
Sishen Main Compartment compartment where the abstraction takes place. Groundwater levels range
from depths of ±280 m in the deepest part of the mine to ±120 m on the edges
of the compartment dyke boundaries.
Zone 1b - Partial Impacted It covers an additional area of 28 000 ha (i.e. total area of impacted zone is 54
Groundwater Zone: 600 ha) and is the external zone beyond the Sishen Compartment from where
groundwater leaks through to the compartment zone. This area is partially
impacted with groundwater levels that range between 30 m and 2.5 m
drawdown. The baseline groundwater levels are inferred to be variable but
range between600
Cumulative dewatering volumes million m3/a
500
400
300
200
100
0
1967
1969
1971
1973
1975
1977
1979
1981
1983
1985
1987
1989
1991
1993
1995
1997
1999
2001
2003
2005
2007
2009
2011
2013
2015
2017
Figure 9: Cumulative dewatering of Sishen Iron Mine [35].
There have been numerous complaints by farmers about the impact of dewatering
activities by Sishen Iron Ore Mine and these were investigated by Meyer [38–53]. The
conclusions from most of the investigations were that:
Water levels measured were in the same ranges as before the 1973/74,
1974/76 and 1988/91 high rainfall periods and before large scale groundwater
abstraction occurred at Sishen Iron Ore Mine. As a result, groundwater
resources have not been and are currently not impacted by the large scale
groundwater abstraction performed by Sishen Iron Ore Mine in areas identified
as outside the dewatering zone.
In some cases the collapse of boreholes has reduced the water inflow area
significantly, and together with carbonate incrustation, is believed to be the main
cause of declining borehole yields. In some of the boreholes incorrect borehole
construction and incorrect pumps prevented optimal abstraction.
On the farm Curtis 470, the long-term groundwater level records as measured
in the two deep boreholes CS01 and CS02 which represent the conditions in
the deep aquifer below the Kalahari Group geological succession, indicate that
the deep aquifer at both these locations was being impacted by recent
increased mine dewatering activities associated with the northward expansion
of mining activities. This conclusion confirms the observation reported in
October 2013 at the meeting with the farming community that the impacted area
14is believed to be expanding towards the farm Curtis and needs to be monitored
closely [51].
There have been transmission losses in the Gamagara River as a result of the effects of
the mining dewatering activities in the dewatering zone (Figure 10), as well as due to the
swallets [12].
Figure 10: Representation of the groundwater levels in the dewatering compartment before and after
dewatering activities [12].
Exigo [17] evaluated the potential cumulative impacts on groundwater focussing on
expansion of the life of the mine pit and partial dewatering with consequent post-
operational water supply or re-watering and pit flooding scenarios. The following
conclusions were drawn [17]:
The dewatering is expected to increase as the mine is planning to deepen the
pit by 140 m to an elevation of 800 metres above mean sea level (440 m
maximum depth).
The simulated groundwater inflow rate into the mine workings would be in the
3
order of 20 million m /a or a 20% increase. The simulated zone of influence
would cover an area of 40 200 ha or a 30% increase (Figure 11). The external
impacted zone is expected to shift to the west as the Doornvlei and Vliegveld
West open pits would mine through the western Sishen Compartment Dyke
boundary.
Increased capture of flood events. The Gamagara River has the potential to
3 3
infiltrate 7 million m /d of which almost 2.5 million m /d (40%) is expected via
swallet zones.
15Figure 11: Sishen Mine Compartments and future simulated impact zones - 2032 (Itasca, 2016 as cited by
Exigo [17]).
4.1.2. Kolomela Mine
The Kolomela Mine, previously called the Sishen South Mine, is located approximately 12
km south east of Postmasburg (Figure 3). Dewatering is required for mining to take place
at Kolomela [54–56]. Itasca [57] updated the three-dimensional (3-D) groundwater flow
model for the Kolomela Mine to predict the potential required dewatering rates for the four
pits in the Kolomela Mine area as well as the drawdown of the groundwater table that
occurs over time after the cessation of mining. The Mine consists of four open pits:
Leeuwfontein, Klipbankfontein, Kapstevel North, and Kapstevel South (Figure 12). The
3 3
total dewatering rate at the Mine, as of October 2016 , is 1,784 m /hr (15.6 million m /a)
3 3 3
of which 1,477 m /hr (12.9 million m /a) is from the Leeuwfontein pit, 276 m /hr (2.4
3 3 3
million m /a) is from the Kapstevel North pit, and 30 m /hr (0.3 million m /a) is from the
Klipbankfontein pit [57]. As a result of active dewatering, the measured groundwater level
around the Leeuwfontein pit perimeter is approximately 100 m lower than the pre-mining
groundwater level whilst the measured groundwater around the Kapstevel South pit
perimeter is approximately is approximately 70 m lower than the simulated pre-mining
groundwater level [57]. Artificial recharge of the excess water into the Groenwaterspruit
aquifer is undertaken as follows [20,58–60].
16 Leeuwfontein Area: The injection boreholes are drilled to a depth of 10 - 20 m
into the less than 5 m thick gravel aquifer layer. It is projected that the 11
3
boreholes can recharge about 30 l/s (2,592 m /day) into the targeted aquifer;
and
Kappieskareeboom Area: The injection boreholes are drilled to a depth of 10 -
20 m into the less than 5 m thick gravel aquifer layer. It is projected that the
3
eight (8) boreholes can recharge about 18 l/s (1,555 m /day) into the targeted
aquifer.
Figure 12: Kolomela Mine with pit locations (Leeuwfontein (LF), Klipbankfontein (KB), Kapstevel North (KSN),
and Kapstevel South (KSS) [57].
17Figure 13: Pumping rate for the dewatering boreholes at Kolomela Mine [57].
Itasca [57] simulated pit-lake water levels at all four pits by the end of Year 2134 (which is
100 years after the cessation of mining) due to the high evaporation rate in the region, the
water levels of the pit lakes will not recover to the pre-mining groundwater-table levels by
the end of Year 2134. The differences between the pre-mining groundwater table and the
pit-lake water levels in Year 2134 are 23, 27, 45, and 67 m for the Leeuwfontein,
Klipbankfontein, Kapstevel South, and Kapstevel North pits, respectively [57]. The rise of
pit-lake water levels in the Kapstevel South and Kapstevel pits is slower than the rise in
the Leeuwfontein and Klipbankfontein pits because there are fewer faults in the Kapstevel
South and Kapstevel North pits. The predicted drawdown from 2017 to 2030 is presented
in Figure 14. Itasca [57] presented predicted drawdown at 5-year intervals from 2017 to
2035 and 10-year intervals from 2035 to 2070. The changes in the predicted 10-m and
50-m drawdown-contour lines over time are presented in Figure 15. The Kolomela
property and farm boundaries are also presented in the figures. Based on the drawdown
contours from these figures, the following observations have been made [57]:
(a) The drawdown extends north and south due to the presence of permeable
north–south faults.
(b) As the pit-lake water levels recover, the simulated drawdown in the mining area
continues to decrease over time.
18(c) As of 2070, the pit lakes will continue to act as groundwater sinks due to
evaporation; therefore, predicted drawdown continues to exist within the model
domain.
(d) As shown in Figure 15, as the pit lake continues to recover, the areal extent and
the magnitude of the drawdown will decrease. By the end of 2070, the
drawdown in the Mine vicinity will be less than 50 m, and the areal extent of the
10-m drawdown-contour line will continue to reduce from the end of mining until
2070.
Figure 14: Predicted drawdown for Kolomela mine up to 2030 [57].
19Figure 15: Change in areal extent of 10-m and 50-m contour lines over time [57].
4.1.3. Beeshoek Mine
Dewatering operations at Beeshoek Mine already impact on the groundwater levels in the
region [54,61,62]. A lowering in water levels can be seen on the farms Kalkfontein,
Kapstewel, Putjie, Aarkop, Doornfontein, the Beeshoek Game Camp and Ploegfontein
[61]. However, a regional rise in groundwater level can also be observed to the west and
east of the mining area and could be attributed to cessation or decrease of
depressurisation and abstraction in these areas and also due to water leakages [61].
The hydraulic properties of the Khumani Iron Ore Mine area are characterised by shallow
dolomitic aquifers with high transmissivities [63]. The upper, semi-confined aquifer in the
calcrete or at the contact between the calcrete and underlying Kalahari clay formation is
poorly developed in the study area and only sustains livestock and domestic water supply
[63]. The lithologies above the dolomites are characterised by interbedded chert,
ironstones, chert breccias, quartzites, conglomerates and shales which would be
indicative of secondary aquifers [63]. The groundwater is compartmentalised. A north–
south striking structure running through the Khumani Mine property forms a barrier, and
the differences in water levels on either side of the structure are notable [64]. No
20dewatering activities are undertaken by the mine, due to ongoing dewatering activities in
the surrounding area [63].
4.1.4. COZA Mine
Water for mining activities at the COZA Iron Ore Mine will be sourced from pit dewatering
activities at the mine and will be undertaken by means of dewatering boreholes [65]. It is
3 3
estimated that approximately 220 m /day [80,300 m /annum] of water will be extracted
from the dewatering boreholes located at Doornpan 445 (Figure 16). The water will be
abstracted from the Kalahari Group sediments and Ghaap Group dolomites. It is
expected that the maximum groundwater level drawdown will be ± 53 meters and that the
cone of depression will not exceed a maximum distance of ± 500 meters from the pit with
11
expected recovery of groundwater levels to take 110 years at the Doornpan Farm [65].
Figure 16: Positions of active iron ore mines relative to the proposed three Coza Project areas [65–67]
11
The farm Doornpan is next to the old Kapstevel Mine of which the pit flooded so fast after the pumps stopped
that essential equipment were lost.. The current studies show that the Leeuwfontein pit at Kapstevel will recover
within 50 years - this pit will be close to 400m deep (Jaco Lambrechts Pers. Communication).
21The proposed pit on the farm Driehoekspan 435 is planned to be ± 50 mbgl (Figure 16).
Dewatering of the aquifer system will only begin once the pit floor elevation decreases
below the local groundwater elevation, which is planned to occur only during year 5 and 6
of mining [66]. The most probable decant elevation of the proposed Driehoekspan Pit is
approximately 1,415 mamsl and the decant position is indicated below in Figure 17 [66].
The most probable time it will take the backfilled void to fill with water to the decant
elevation was calculated to be in the order of 140 years after active mining has ceased
3
[66]. The evaporation rate of approximately 237,570 m /y calculated to occur from the
3
surface of the backfilled pit far exceeds the expected recharge volume of ± 4,220 m /y,
which in actual fact means that the water level within the backfilled opencast pit is unlikely
to reach the surface and decanting should not occur [66].
Figure 17: Most probable decant position for the Driehoekspan Pit [66].
The volumes of groundwater expected to discharge into the active mine workings of the
Jenkins pit (Figure 16) were simulated with the numerical flow model [67]. A groundwater
level drawdown of approximately 20 meters was simulated for the seventh year of active
mining and the maximum groundwater level impacts are expected to occur during the
22You can also read