In Vivo Imaging of Blood-Brain Barrier Disruption in a Multiple Sclerosis Animal - Model
←
→
Page content transcription
If your browser does not render page correctly, please read the page content below
In Vivo Imaging of Blood-Brain Barrier
Disruption in a Multiple Sclerosis Animal
                 Model

                   Mémoire

                Emilie Chamma

           Maîtrise en biophotonique
            Maître ès sciences (M.Sc.)

                Québec, Canada

             © Emilie Chamma, 2013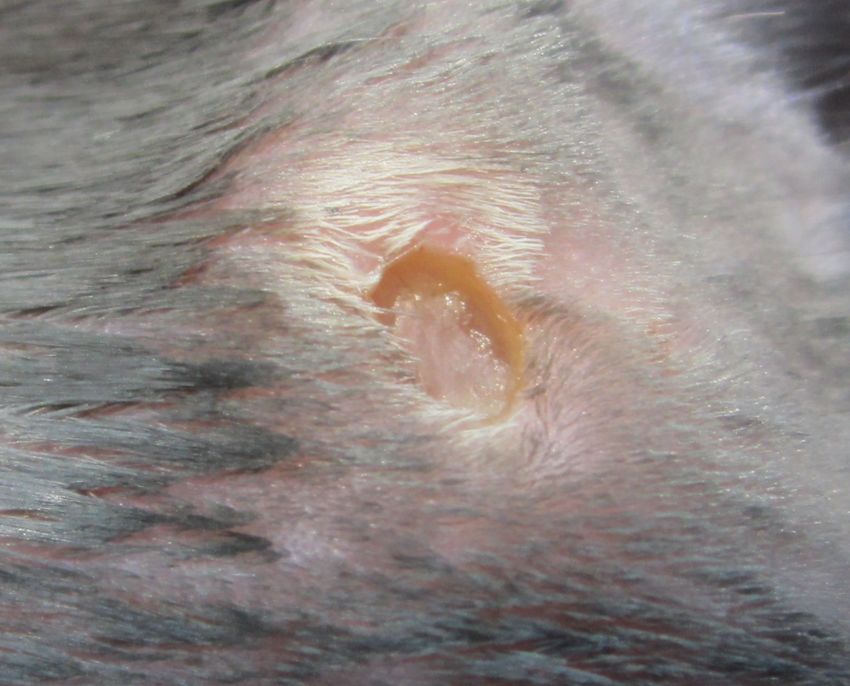
Résumé

La sclérose en plaques est une maladie inflammatoire du système nerveux central qui touche
beaucoup de jeunes adultes dans le monde entier. Malgré les efforts de recherche, la cause
demeure inconnue. Afin de développer de meilleurs traitements et de trouver un remède, les
modèles animaux sont utilisés pour identifier des biomarqueurs cellulaires. La caractérisation
de ces modèles est essentielle afin de bien transposer les résultats à la maladie humaine et de
tester de nouveaux médicaments.

Cette thèse est le résultat d’un projet de maîtrise au Centre de recherche de l’Institut univer-
sitaire en santé mentale de Québec (CRIUSMQ) qui visait à étudier la barrière hémato-
encéphalique en tant que biomarqueur possible chez un modèle animal de la sclérose en
plaques. Le chapitre 1 présente les différents thèmes abordés dans ce projet. Les chapitres 2,
3 et 4 se concentrent sur les méthodes choisies, tandis que le chapitre 5 présente les résultats
obtenus.

                                                                                              iii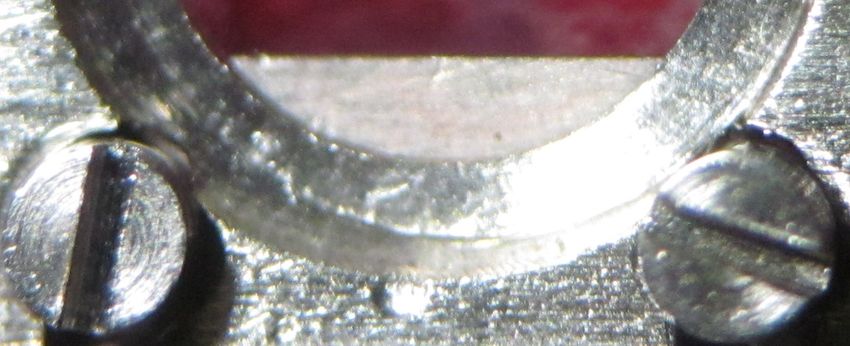
Abstract

Multiple sclerosis is an inflammatory disease of the central nervous system that affects many
young adults worldwide. Despite research efforts, the cause of the disease remains unknown.
In order to develop better therapies and ultimately find a cure, animal models are used to
identify cellular biomarkers. Characterizing these models is essential in order to properly
relate findings to the human disease and test possible medications.

This thesis is the result of a three-year Master’s project at Centre de recherche de l’Institut
universitaire en santé mentale de Québec (CRIUSMQ) that aimed to study the blood-brain
barrier as a possible biomarker of disease pathology in a multiple sclerosis animal model.
Chapter 1 introduces the different themes addressed in this project. Chapters 2, 3 and 4
focus on the materials and methods chosen, while chapter 5 presents the results obtained.
These findings are discussed in chapter 6.

                                                                                             v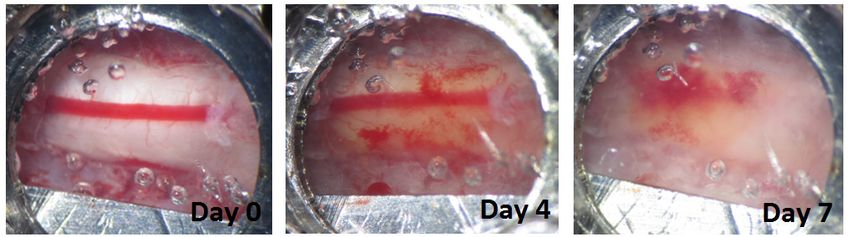
Contents

Résumé                                                                                                             iii

Abstract                                                                                                            v

List of Figures                                                                                                   viii

List of Acronyms                                                                                                   xi

Acknowledgements                                                                                                  xv

1 Introduction                                                                                                      1
  1.1 Objectives of This Project . . . . . . . . . . . . . . . . . . . . .    .   .   .   .   .   .   .   .   .     1
  1.2 Multiple Sclerosis and the Blood-Brain Barrier . . . . . . . . .        .   .   .   .   .   .   .   .   .     2
       1.2.1 Multiple Sclerosis . . . . . . . . . . . . . . . . . . . . . .   .   .   .   .   .   .   .   .   .     2
       1.2.2 The Blood-Brain Barrier . . . . . . . . . . . . . . . . . .      .   .   .   .   .   .   .   .   .     3
             Structure of the Blood-Brain Barrier . . . . . . . . . . .       .   .   .   .   .   .   .   .   .     3
             Transport Across the Blood-Brain Barrier . . . . . . . .         .   .   .   .   .   .   .   .   .     5
             Blood-Brain Barrier Disruption and Cellular Infiltration         .   .   .   .   .   .   .   .   .     6
  1.3 EAE Model . . . . . . . . . . . . . . . . . . . . . . . . . . . . .     .   .   .   .   .   .   .   .   .     8
       1.3.1 Induction and Progression of EAE . . . . . . . . . . . .         .   .   .   .   .   .   .   .   .     8
       1.3.2 Vascular Permeability in EAE . . . . . . . . . . . . . . .       .   .   .   .   .   .   .   .   .     9
       1.3.3 Limitations of Ex Vivo Studies in MS and EAE . . . . .           .   .   .   .   .   .   .   .   .    11
  1.4 Fluorescence Microscopy . . . . . . . . . . . . . . . . . . . . . .     .   .   .   .   .   .   .   .   .    12
       1.4.1 Principles of Fluorescence . . . . . . . . . . . . . . . . .     .   .   .   .   .   .   .   .   .    12
       1.4.2 Principles of Microscopy . . . . . . . . . . . . . . . . . .     .   .   .   .   .   .   .   .   .    14
       1.4.3 Confocal Microscopy . . . . . . . . . . . . . . . . . . . .      .   .   .   .   .   .   .   .   .    16
       1.4.4 Two-Photon Microscopy . . . . . . . . . . . . . . . . . .        .   .   .   .   .   .   .   .   .    16

2 Access to the Spinal Cord                                                                 19
  2.1 Anatomy of the Mouse Spinal Cord . . . . . . . . . . . . . . . . . . . . . . . . . 19
  2.2 Terminal Access . . . . . . . . . . . . . . . . . . . . . . . . . . . . . . . . . . . 22
  2.3 Longitudinal Access . . . . . . . . . . . . . . . . . . . . . . . . . . . . . . . . . 23

3 Fluorescent Permeability Markers                                                           25
  3.1 Evans Blue . . . . . . . . . . . . . . . . . . . . . . . . . . . . . . . . . . . . . . 25
  3.2 Sodium Fluorescein . . . . . . . . . . . . . . . . . . . . . . . . . . . . . . . . . . 26
  3.3 Fluorescent Conjugated Dextrans . . . . . . . . . . . . . . . . . . . . . . . . . . 27

vi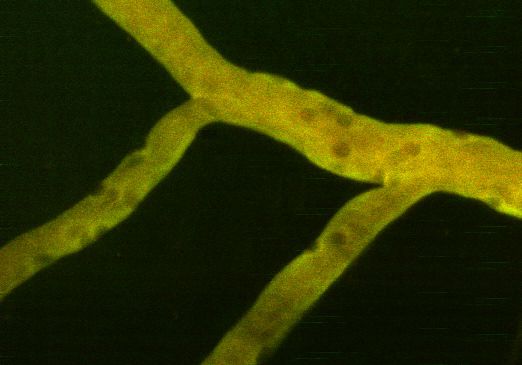
3.4   Routes for Permeability Markers . . . . . . . . . . . . . . . . . . . . . . . . . . 28

4 Materials and Methods                                                                                                              31
  4.1 Animals and Spinal Cord Access . . . . . . .       .   .   .   .   .   .   .   .   .   .   .   .   .   .   .   .   .   .   .   31
  4.2 Choice of Permeability Markers . . . . . . . .     .   .   .   .   .   .   .   .   .   .   .   .   .   .   .   .   .   .   .   31
  4.3 I.V. Injection of Permeability Markers . . . .     .   .   .   .   .   .   .   .   .   .   .   .   .   .   .   .   .   .   .   32
  4.4 Two-Photon Scanning Video-Rate Microscope          .   .   .   .   .   .   .   .   .   .   .   .   .   .   .   .   .   .   .   33
  4.5 Sequential Imaging . . . . . . . . . . . . . . .   .   .   .   .   .   .   .   .   .   .   .   .   .   .   .   .   .   .   .   35
  4.6 Analysis and Error . . . . . . . . . . . . . . .   .   .   .   .   .   .   .   .   .   .   .   .   .   .   .   .   .   .   .   37

5 Results                                                                                                                          41
  5.1 Fluorescence Microscopy . . . . . . . . . . . . . . . . . . . . . . . . . . . . . .                                        . 41
  5.2 Vascular Permeability is Temporarily Increased in Control Animals Following
      Immunization . . . . . . . . . . . . . . . . . . . . . . . . . . . . . . . . . . . .                                       . 42
  5.3 Vascular Permeability Might Precede Clinical Symptoms . . . . . . . . . . . .                                              . 42
  5.4 Vascular Permeability Depends on Day Post-Onset . . . . . . . . . . . . . . .                                              . 43
  5.5 Vascular Permeability Does Not Depend Strongly on Clinical Score or Day
      Post-Immunization . . . . . . . . . . . . . . . . . . . . . . . . . . . . . . . . .                                        . 45
  5.6 Vascular Permeability Does Not Depend on Blood Vessel Type and Diameter                                                    . 46
  5.7 Incidence of Permeability to Both Markers Changes With Day Post-Onset . .                                                  . 48

6 Discussion                                                                                                                         49
  6.1 Timecourse of Vascular Permeability . . . . . . . . . . . . . . . .                            . . . . . .             .   .   49
  6.2 Terminal Access to the Spinal Cord . . . . . . . . . . . . . . . . .                           . . . . . .             .   .   51
  6.3 Quantification of Vascular Permeability . . . . . . . . . . . . . .                            . . . . . .             .   .   51
  6.4 Differences in Permeability to Sodium Fluorescein and Texas Red                                Dextrans                .   .   53
  6.5 Results Versus Other Studies . . . . . . . . . . . . . . . . . . . .                           . . . . . .             .   .   54

7 Conclusion                                                                                                                         57

Bibliography                                                                                                                         59

A EAE Induction                                                                                                                      71

B Laminectomy                                                                                                                        75

C Recipies                                                                                                                           79

                                                                                                                                     vii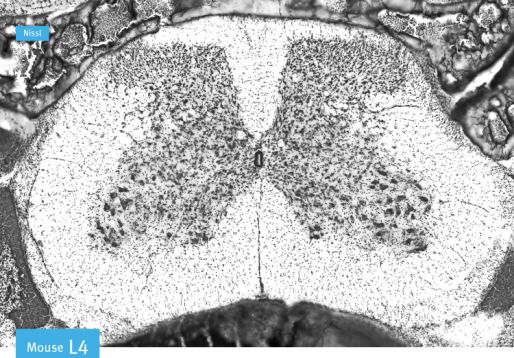
List of Figures

1.1    The Structure of the Blood-Brain Barrier . . . . . . . .                         .   .   .   .   .   .   .   .   .   .   .   .   .   .   .    4
1.2    Proteins of the Tight Junctions . . . . . . . . . . . . . .                      .   .   .   .   .   .   .   .   .   .   .   .   .   .   .    4
1.3    The Different Pathways Across the Blood-Brain Barrier                            .   .   .   .   .   .   .   .   .   .   .   .   .   .   .    6
1.4    Steps to Cellular Infiltration . . . . . . . . . . . . . . . .                   .   .   .   .   .   .   .   .   .   .   .   .   .   .   .    8
1.1    Clinical Scores Scale . . . . . . . . . . . . . . . . . . . .                    .   .   .   .   .   .   .   .   .   .   .   .   .   .   .   10
1.5    Jablonski Diagram for OPEF, TPEF and Stokes Shift .                              .   .   .   .   .   .   .   .   .   .   .   .   .   .   .   13
1.6    One-Photon Excitation Versus Two-Photon Excitation .                             .   .   .   .   .   .   .   .   .   .   .   .   .   .   .   14
1.7    Widefield Microscope . . . . . . . . . . . . . . . . . . .                       .   .   .   .   .   .   .   .   .   .   .   .   .   .   .   15
1.8    Confocal Microscope and the Scanning Unit . . . . . . .                          .   .   .   .   .   .   .   .   .   .   .   .   .   .   .   17
1.9    Two-Photon Microscope . . . . . . . . . . . . . . . . . .                        .   .   .   .   .   .   .   .   .   .   .   .   .   .   .   18

2.1    Anatomy of the Spinal Cord . . . . . . .     .   .   .   .   .   .   .   .   .   .   .   .   .   .   .   .   .   .   .   .   .   .   .   .   20
2.2    Blood Vessels of the Spinal Cord . . . .     .   .   .   .   .   .   .   .   .   .   .   .   .   .   .   .   .   .   .   .   .   .   .   .   21
2.3    Terminal Access to the Spinal Cord . .       .   .   .   .   .   .   .   .   .   .   .   .   .   .   .   .   .   .   .   .   .   .   .   .   22
2.4    Longitudinal Access to the Spinal Cord       .   .   .   .   .   .   .   .   .   .   .   .   .   .   .   .   .   .   .   .   .   .   .   .   24

3.1    Properties of Evans Blue . . . . . . . . . . . . .           .   .   .   .   .   .   .   .   .   .   .   .   .   .   .   .   .   .   .   .   26
3.2    Properties of Sodium Fluorescein . . . . . . . .             .   .   .   .   .   .   .   .   .   .   .   .   .   .   .   .   .   .   .   .   27
3.3    Properties of Fluorescent Conjugated Dextrans                .   .   .   .   .   .   .   .   .   .   .   .   .   .   .   .   .   .   .   .   28
3.4    Routes for Permeability Markers . . . . . . . .              .   .   .   .   .   .   .   .   .   .   .   .   .   .   .   .   .   .   .   .   29

4.1  Emission Spectra of Texas Red and Fluorescein . . . . . . . . . . . . . .                                              . . . . .           . 32
4.2  Assesment of Paracellular and Transcellular Pathway Permeability with                                                  Fluores-
     cent Markers . . . . . . . . . . . . . . . . . . . . . . . . . . . . . . . . .                                         . . . . .           .   33
4.3 Two-Photon Scanning Video-Rate Microscope . . . . . . . . . . . . . . .                                                 . . . . .           .   34
4.4 Large-Scale Imaging of the Spinal Cord . . . . . . . . . . . . . . . . . .                                              . . . . .           .   35
4.5 Image Processing . . . . . . . . . . . . . . . . . . . . . . . . . . . . . . .                                          . . . . .           .   36
4.6 Sequential Imaging . . . . . . . . . . . . . . . . . . . . . . . . . . . . . .                                          . . . . .           .   36
4.7 Method of Analysis . . . . . . . . . . . . . . . . . . . . . . . . . . . . . .                                          . . . . .           .   37
4.8 Error in Mesurement Due to Manual Quantification . . . . . . . . . . .                                                  . . . . .           .   38
4.9 Error in Measurements Due to Analyzing Only 5-25 Minutes Timepoint                                                      . . . . .           .   39
4.10 Complications Associated With Later Timepoints . . . . . . . . . . . . .                                               . . . . .           .   40

5.1    Examples of Extravasation . . . . . . . . . .            .   .   .   .   .   .   .   .   .   .   .   .   .   .   .   .   .   .   .   .   .   41
5.2    Vascular Permeability in Control Animals . .             .   .   .   .   .   .   .   .   .   .   .   .   .   .   .   .   .   .   .   .   .   42
5.3    Vascular Permeability in Score 0 Animals . .             .   .   .   .   .   .   .   .   .   .   .   .   .   .   .   .   .   .   .   .   .   43
5.4    Vascular Permeability Versus Day Post-Onset              .   .   .   .   .   .   .   .   .   .   .   .   .   .   .   .   .   .   .   .   .   44

viii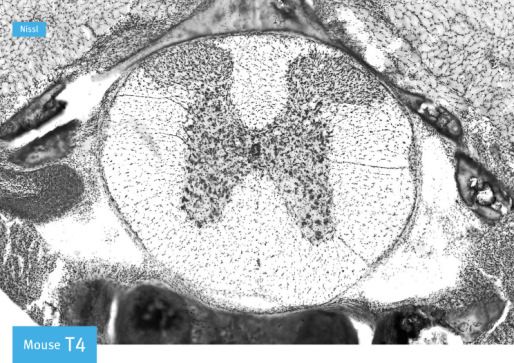
5.5 Vascular Permeability on Day Post-Onset 0 Versus Clinical Score . . . . . . . . . . 44
5.6 Vascular Permeability Versus Clinical Score . . . . . . . . . . . . . . . . . . . . . . 45
5.7 Vascular Permeability Within a Clinical Score Versus Day Post-Onset . . . . . . . 46
5.8 Vascular Permeability Versus Day Post-Immunization . . . . . . . . . . . . . . . . 46
5.9 Vascular Permeability Versus Blood Vessel Type . . . . . . . . . . . . . . . . . . . 47
5.10 Vascular Permeability Versus Blood Vessel Diameter . . . . . . . . . . . . . . . . . 47
5.11 Incidence of Permeability to Both Markers Versus Day Post-Onset . . . . . . . . . 48
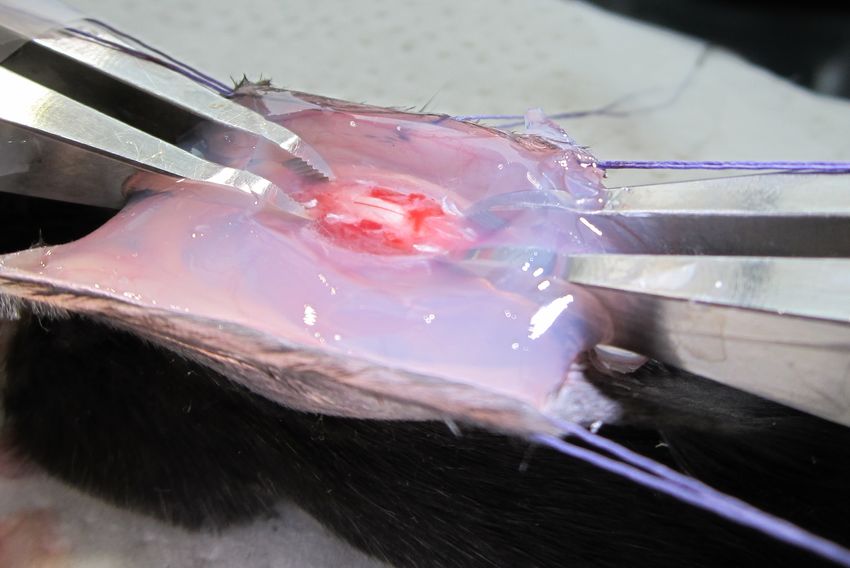
A.1 Wound at Injection Site . . . . . . . . . . . . . . . . . . . . . . . . . . . . . . . . . 73
B.1 Material Needed to Perform a Laminectomy . . . . . . . . . . . . . . . . . . . . . . 76
B.2 Steps to Perform a Laminectomy . . . . . . . . . . . . . . . . . . . . . . . . . . . . 78
ix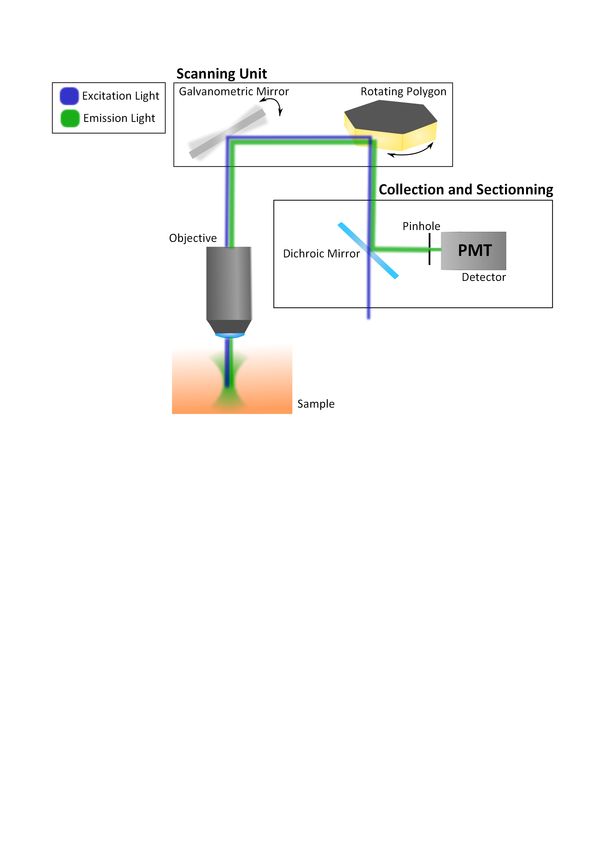
List of Acronyms

ACSF Artificial cerebrospinal fluid

APD Avalanche photodiode

BBB Blood-brain barrier

BCSF Blood cerebrospinal fluid

BM Basement membrane

CAM Cell adhesion molecule

CARS Coherent anti-Stokes Raman scattering

CCD Charge-coupled device

CFA Complete Freund’s adjuvant

CNS Central nervous system

DPI Day post-immunization

DPO Day post-onset

EAE Experimental autoimmune encephalomyelitis

EC Endothelial cell

Gd Gadolinium

GFP Green fluorescent protein

HRP Horseradish peroxidase

I.V. Intravenously

JAM Juntional adhesion molecule

                                                xi
MOG Myelin oligodendrocyte glycoprotein MRI Magnetic resonance imaging MS Multiple sclerosis MW Molecular weight NA Numerical aperture NaFl Sodium Fluorescein OPEF One-photon excitation fluorescence PBS Phosphate buffered solution PECAM Platelet endothelial cell adhesion molecule PFA Paraformaldehyde PMT Photomultiplier tube PP-MS Primary progressive multiple sclerosis PTX Pertussis toxin ROS Reactive oxygen species RR-MS Relapsing-remitting multiple sclerosis S.C. Subcutaneously SHG Second-harmonic generation SP-MS Secondary progressive multiple sclerosis TEER Transendothelial electrical resistance TPEF Two-photon excitation fluorescence TJ Tight junction TNF Tumor necrosis factor TR Texas Red VEGF Vascular endothelial growth factor xii
You don’t go to the science
museum and get handed a
pamphlet on electricity. You go
to the science museum and put
your hand on a metal ball, your
hair sticks up straight... and you
know science.

        Michael Scott, The Office

                               xiii
Acknowledgements
This three-year research project in biophotonics was made possible with the help of many pas-
sionate people. First, I want to thank my supervisor Prof. Daniel Côté for trusting me with
a very challenging project, for many opportunities to excel and for showing me how exciting
science can be. Special thanks to my co-supervisor Prof. Yves De Koninck for teaching me
about biological research and for the many meetings where I would leave feeling unstoppable.
Secondly, I am grateful to all my colleagues, especially Benoit Aubé and Amy Daradich, for
their help and numerous discussions. Having you in the lab somehow made it fun to align
lasers!
Most importantly, I want to thank my parents for their constant support during all these
school years. Your love and encouragement gave me strength and confidence throughout this
journey. Finally, thank you Jean-Patrick Boudreault for your daily dose of optimism and
unconditional love.
The author was supported by post-graduate awards from Le Fonds de recherche du Québec
- Nature et technologies (FRQNT) and from the Multiple Sclerosis Society of Canada.
xvChapter 1
Introduction
Research in the field of neuroscience has greatly evolved during the past century and has
helped us to better understand the vast number of mechanisms involved in the central ner-
vous system (CNS). However, many diseases affecting the CNS are still not well understood
(e.g. Alzheimer’s disease, Parkinson’s disease and multiple sclerosis). The cellular events
involved in these diseases need to be thoroughly studied in order to identify their causes and
develop cures.
Light is a powerful tool to image events at the molecular level. Optical microscopy was de-
veloped centuries ago, but gained greater significance over the past 50 years. Indeed, the
use of light to investigate biological systems has become more important with advances in
new optical technologies, such as fluorescence imaging. The field of research that combines
the use of light and biological studies is called biophotonics. Optical microscopy and fluo-
rescence labelling have now become essential to surveying the CNS at the molecular level.
Questions that were left unanswered with conventional techniques may now be addressed with
biophotonics.
1.1 Objectives of This Project
This project is part of a collective effort to identify the early signs and hallmarks of multiple
sclerosis. Specifically, its main goal is to better understand blood-brain barrier permeability
in a multiple sclerosis animal model using biophotonics and in vivo techniques. In doing so,
many aspects of vascular permeability will be examined: onset of permeability, its spatial
and temporal evolution and how permeability is affected by blood vessels. Knowledge of
neurobiology and microscopy was first attained in order to design experimental protocols.
The author planned and conducted the experiments herself, from the monitoring of diseased
animals to imaging and data analysis.
11.2 Multiple Sclerosis and the Blood-Brain Barrier 1.2.1 Multiple Sclerosis Multiple sclerosis (MS) is an autoimmune disease of the central nervous system (CNS), i.e. the brain and spinal cord, that leads to impairment of sensory and motor functions. It primarily affects young adults, especially in women (2:1), and its prevalence is higher in Europe and North America [1]. Many symptoms of CNS degeneration are associated with MS: sensory disturbances, troubled vision, limb weakness, incontinence, etc. Prognosis among patients varies greatly depending on the disease progression. Most patients (85%) are affected by relapsing-remitting MS (RR-MS), a form of the disease with symptoms present over a short period of time followed by recovery [2]. With time, recovery is less effective and disease pro- gression is faster, which leads to another form known as secondary progressive MS (SP-MS). The other prominent form is primary progressive MS (PP-MS), with patients presenting a steady progression of the disease over time. The causes of MS are still largely unknown, but risk factors have been identified, such as genetics, environment and infections. Genetic factors can contribute to the development of MS, but the disease is not considered strictly hereditary according to studies with identical twins [3]. Environmental factors such as sun exposure (vitamin D) could explain the higher prevalence in nordic regions [4]. Microbes and viruses as well as hygiene have also been studied as potential triggers [5, 6]. Specialists agree that a combination of these factors might be necessary in order to develop MS. Diagnosis of MS in patients can be difficult since many of its symptoms can be associated with others diseases. Magnetic resonance imaging (MRI) using the tracer Gadolinium-DTPA (Gd-DTPA) is necessary in order to diagnose MS [7, 8]. This marker measures a loss of integrity in the blood-brain barrier, i.e. vascular permeability, associated with active MS lesions [9, 10]. No cure is known for MS, but symptoms and progression can be controlled and slowed down with medication (e.g. corticosteroids, interferons). At the molecular level, MS is characterized by inflammation, demyelination, axonal damage, cellular infiltration and vascular permeability. Inflammation of the CNS results in permeable blood vessels (loss of blood-brain barrier integrity) and entry of immune cells (leukocytes) via a cascade of signaling factors. These cells cause localized damage (lesions) to the myelin in the brain and spinal cord. Myelin forms the lipid sheaths surrounding some axons of the CNS and is responsible for the correct transmission of electrical signals along them. Its degeneration can result in signal weakening, thereby causing the many symptoms of MS. Ultimately, axonal damage occurs, and signal transmission is no longer possible. The underlying causes of this attack by the immune system are still not fully understood. Indeed, it is still not known if the disease is inside-out or outside-in: does inflammation occur in the CNS first, or is it the result of a peripheric disorder ? [11, 12] The presence of immune cells in the CNS is necessary for 2
the pathology to develop, but their origin is still hotly debated. In order to answer questions
related to the origins of MS, the earliest signs need to be thoroughly studied. This has made
the loss of blood-brain barrier integrity an ideal and popular candidate for study.

1.2.2   The Blood-Brain Barrier

The CNS is very sensitive to ion fluctuations and needs to be protected from pathogens [13].
Therefore, it possesses a specific barrier that regulates exchanges of ions and molecules at the
blood vessels: the blood-brain barrier (BBB). Its existence was discovered in the late 19th
century by Paul Ehrlich. As part of an experiment, he injected dyes intravenously (i.v.) in
rodents and noticed all organs except the CNS were stained. Its unique phenotype comes
from its structure and highly-regulated transport mechanisms. It is now known to play an
important role in the maintenance of the CNS as well as in many pathologies, such as MS.

Structure of the Blood-Brain Barrier

The blood-brain barrier is present in almost all blood vessels of the CNS. It is to be dis-
tinguished from another barrier present in the CNS, the blood cerebropsinal fluid (BCSF)
barrier, found in the choroid plexus. BBB functions are numerous: regulate ionic and fluid
movements, provide nutrients, clear waste products and protect from infectious agents. The
BBB is composed of specialized endothelial cells, a basement membrane, astrocyte end-feet
and pericytes (Figure 1.1). In order for the BBB to be functional, all these components must
be present.

Blood vessels in the CNS are formed by endothelial cells (ECs) that differ from those found
in other organs: there is an absence of fenestrations, i.e. space, between them [15, 16]. This
phenotype comes from tight junctions (TJs) present at the intercellular level. TJs are struc-
tures composed of many different proteins expressed on ECs (Figure 1.2): claudins, occludins,
junctional adhesion molecules (JAMs), platelet endothelial cell adhesion molecule (PECAM),
ZO-1, ZO-2, ZO-3, etc. These proteins are expressed on adjacent ECs and interact with
each other, creating the junctions. TJs serve as a structural barrier to paracellular transport,
preventing the passage of hydrophilic substances such as ions (e.g. Na+ , Ca+ ), solute (e.g.
sucrose) and macromolecules (e.g. insulin) between ECs. Tight junctions are also essential
for the maintenance of the polarized properties of the endothelium. Since ions do not dif-
fuse freely, a transendothelial electrical resistance (TEER) of ∼ 1500Ωcm2 is present between
the apical (or luminal; faces blood) and basolateral (or abluminal, faces CNS) membranes
[14, 17]. This polarization plays an important role in the transport and expression of pro-
tein within an EC by differentiating the apical side from the basolateral side. Downregulation
or misplacement of TJ proteins compromises the integrity of the BBB, leading to permeability.

                                                                                              3
Figure 1.1: The structure of the blood-brain barrier is composed of specialized endothelial cells, tight junctions, a basement membrane, astrocyte end-feet and pericytes. Modified from [14]. Figure 1.2: Proteins of the tight junctions. Many different proteins are necessary for the integrity of TJs, as illustrated. Modified from [14]. 4
The TEER is enhanced by the presence of another structure called glycocalyx. The apical sur-
face of the endothelium is covered by this anionic layer that limits the interaction of molecules
and other cells with the endothelium [18]. It is formed by glycoproteins, proteoglycans, and
glycosaminoglycans bound to the ECs membrane. It is known to play a role in vascular
permeability, as it restricts the passage of molecules based on size and electrical charge [19].
A loss of the glycocalyx negative charge increases permeability to different markers [20, 21, 22].

The basement membrane (BM) is a specialized layer of the extracellular matrix found on
the basolateral side of the endothelium. It is formed by two lamina in which pericytes are
embedded. Pericytes provide structural support as well as vasodynamic capacity to the blood
vessels. The dominant proteins in the basal lamina are laminins, glycoproteins and collagen
[23, 24]. Another important sturcture of the BBB are the astrocyte end-feet. Astocytes are
glial cells that have both structural and signaling roles in the maintenance of the BBB. The
end-feet of astrocytes surround the blood vessels by touching the BM and provide mechanical
support. Astrocytes also produce numerous signaling factors that regulate the BBB proper-
ties through expression of proteins in endothelial cells [14, 25].

The circumventricular organs of the brain (pineal gland, area postrema, subfornical organ,
etc) lack a BBB. In these regions, vesicular activity is increased, blood vessels are fenestrated
and there is no pericyte or astrocyte coverage. The function of these organs is to sample the
blood content for hormone levels, fluid balance, toxic substances and more [26].

Transport Across the Blood-Brain Barrier

Tight junctions restrict the passage of molecules between ECs (i.e. paracellular transport),
but it is possible to cross the BBB through ECs (i.e. transcellular transport). The traffic
of molecules via transcellular transport is highly regulated and many mechanisms are involved.

The pathway used to cross the BBB is molecule-dependent (Figure 1.3) [27, 28]. Ions are
transferred by pumps (e.g. sodium ATP-dependent pump) or transporters (e.g. sodium,
potassium, 2-chloride (Na-K-2Cl) cotransporter) located at the apical and basolateral mem-
branes [29]. These pumps regulate ion influx from the blood to the brain and vice versa. Ion
concentrations need to be stable since they highly influence the behavior of neurons. Lipophilic
agents, such as O2 and CO2 , can diffuse passively through the cell membrane. Some molecules
(e.g. amino acids, glucose) are transported using specific receptors. Finally, transcytosis is
the transport of macromolecules across a cell by vesicles. Receptor-mediated transcytosis is

                                                                                                5
Figure 1.3: The different pathways accross the BBB are illustrated. The paracellular pathway is normally blocked by the tight junctions. The transcellular pathway can be regulated by receptors, or can be non-specific using diffusion (lipophilic molecules) and adsorptive vesicles. The electrical resistance across the barrier makes it easier for positively charged molecules to cross the BBB. Modified from [14]. specific to a given endogenous macromolecule, while adsorptive transcytosis is non-specific. Under normal physiological conditions, adsorptive vesicles rarely occur [30, 31]. Due to the presence of a TEER and a glycocalyx layer, positively-charged and neutral molecules will be more likely to cross the BBB using transcytosis than negatively-charged molecules [32, 33]. This particular phenomenon will be important when selecting permeability markers (section 4.2). Blood-Brain Barrier Disruption and Cellular Infiltration The loss of BBB integrity is observed in many pathologies: stroke, epilepsy, Alzheimer’s dis- ease, multiple sclerosis and others. BBB permeability can be beneficial, allowing the entry of immune cells to fight an infection and clear debris; however it often becomes damaging, caus- ing neuronal dysfunction and degeneration. Many mechanisms are involved in the opening of the BBB: increase in the number of vesicles, loss of tight junctions integrity, formation of transendothelial channels and activation of the endothelium. 6
Transcytosis by non-specific vesicles is greatly upregulated in different pathologies [34, 35,
36, 37]. An upregulation of vesicles at the apical membrane of ECs increases transport of
macromolecules to the brain. In order to demonstrate this phenomenon, electron microscopy
and the marker horseradish peroxidase (HRP) are used [38, 39]. Quantitative studies showed
a 2 to 16-fold increase in vesicles, depending on the pathology studied. Vesicle diameter has
been measured and ranges from 50 to 100nm [40, 41]. This phenomenon therefore permits
non-specific trancytosis of macromolecules during BBB disruption.

BBB permeability can also be caused by a loss of TJ integrity [42]. The downregulation,
bad assembly or misplacement of proteins can cause the TJs to become less restrictive to
molecules. In order to evaluate their integrity, immunohistochemistry can be used. With
antibodies directed against a protein of interest (claudin, ZO-1, etc), it is possible to evaluate
its alterated expression and localization [43, 44]. The loss of TJ integrity can also lead to
a decrease in the electrical resistance across the apical and basolateral membranes. The net
negative charge of the apical membrane is essential to the integrity of the barrier [45, 46].
When TJs are greatly altered, ions and molecules can diffuse freely between ECs.

Transendothelial channels form transiently by the fusion of two or more vesicles, but do not
occur under normal physiological conditions. These channels provide a direct passage for
molecules. [47, 48]. Their existence is difficult to demonstrate due to their transient nature.
Some studies using electron microscopy have succeeded in imaging these channels in different
pathologies [49, 50]. Transendothelial channels thus represent a fast and transient opening of
the BBB.

Another aspect of BBB permeability is the increase of the number of immune cells, such as
leukocytes, entering the CNS. Under normal physiological conditions, cellular infiltration is
low [51], but when inflammation occurs, as in MS, leukocytes cross the BBB more easily
through different mechanisms. Cytokines, small signaling molecules, are secreted during in-
flammation by numerous subtypes of immune cells (e.g. B cells, macrophages). Their role
is to enhance affinity between immune cells and ECs by increasing cell adhesion molecule
(CAM) expression on the luminal surface of the endothelium. CAMs are ligands for integrins
expressed on immune cells. Many different CAMs (e.g. VCAM, ICAM) and their integrins
(VLA-4, LFA-1) play important roles in the interaction between leukocytes and ECs. This
interaction is necessary for cellular infiltration [52]. Leukocytes go through five steps to
enter the CNS: capture-rolling, activation, adhesion, crawling and diapedesis (Figure 1.4)
[53, 54, 55, 56]. These processes are widely studied in order to prevent cellular infiltration in
different pathologies.

                                                                                                7
Figure 1.4: Steps to cellular infiltration. Leukocytes go through five steps to enter the CNS: capture-rolling, activation, adhesion, crawling and diapedesis. Expression of CAMs is neces- sary for these steps to take place. Modified from [55]. Different molecules have been identified as key players in pathological disruption of the BBB: vasoactive proteins (e.g. VEGF), inflammatory cytokines (interleukins, tumor necrosis factor (TNF − α), interferon-gamma (IFN − γ)) and reactive oxygen species (ROS). VEGF regulates angiogenesis, but has been linked to increased vascular permeability in brain tumors and when administered intraveneously [57, 58]. Cytokines increase the affinity of immune cells to the endothelium, allowing for entry into the CNS. ROS such as superoxide O− can react to form powerful oxidants able to modify protein function. Some of them have been shown to affect the BBB by reducing expression of TJ proteins [59]. 1.3 EAE Model Animal models are essential in order to better understand a disease and develop therapies. The most commonly used animal model for MS is experimental autoimmune encephalomyelitis (EAE). It was developped following Louis Pasteur’s trials for rabies vaccine, which contained spinal cord and brain tissue. Following the injections, patients developed an immune response toward their own myelin, causing encephalitis [60]. EAE was then refined and reproduced in rodents and is now a suitable model for studying cellular infiltration, demyelination and vascular permeability [61]. 1.3.1 Induction and Progression of EAE Unlike MS, EAE is not spontaneous: it has to be induced by injecting a mix of different compounds (an emulsion) that stimulate the immune system (see Appendix A for complete protocol). EAE can be induced in rats, mice, guinea pigs and rabbits, but the course of the disease will differ from one species to another. In mice, different strains respond differently 8
depending on the gender and have various disease progressions [62].

To induce EAE, many compounds are necessary. First, an antigen, myelin oligodendrocyte
glycoprotein (MOG), is injected to sensitize the immune system in order to produce activated
T-cells. Many different sequences of the MOG antigen can be used, but the most common
one is MOG35−55 . Two other agents are injected to amplify this immune response : complete
Freund’s adjuvant (CFA) and pertussis toxin (PTX) [63]. CFA contains mycobacterium tu-
berculosis while PTX is a toxin produced by the bacterium Bordetella pertussis. To assess
the effects of CFA and PTX, control animals receiving an antigen-free emulsion should be
included in all protocols.

Following the injections, mice will develop clinical symptoms similar to MS. Indeed, pro-
gressive paralysis will occur, starting approximately on day 10 after immunization. These
symptoms are due to demyelination in random regions of the CNS. With time, more lesions
appear and contribute to signal weakening, thus worsening paralysis. The day of onset can
vary by a few days depending on the animal and protocol. Mice are monitored daily and
given a score in order to quantify the progression of the disease. A scale of 0 to 5 is used
to score the animals (Table 1.1). These scores are based on a visual examination of motor
deficits. This scale can be applied slightly differently by various scorers. Many efforts are
spent to find alternative and objective scoring methods [64]. Not all animals injected will
develop the disease. Many factors can affect the success rate: strain, age and gender of the
mice, emulsion preparation and injection, antigen quality, seasonal changes, etc. Great care
is taken to reproduce the same conditions for all experiments to minimize variability.

1.3.2    Vascular Permeability in EAE
Vascular permeability in EAE has been largely studied, however litterature on the subject
provides two opposite conclusions: some papers conclude that (1) vascular permeability peaks
at onset of the disease, while others believe that (2) vascular permeability increases with dis-
ease severity. The onset of BBB permeability is also a subject of much debate.

The first conclusion, "vascular permeability peaks at onset of the disease", was demonstrated
in one ex vivo experiment [65] and more recently in two in vivo experiments [66, 67]. These
investigations were conducted in mice and rats, and the brain or spinal cord was examined.
Their results show that BBB permeability in animals with initial signs of EAE is significantly
higher than animals at the peak of the disease or in controls. The second conclusion, "vascular
permeability increases with disease severity", was demonstrated in both recent and prior in-

                                                                                              9
Table 1.1: Clinical scoring of mice with EAE. Motor deficits are scored using this scale to
quantify the progression of the disease. Modified from [62].
Score Clinical Sign Observations
Hind legs are extended; tail extends up
0 No clinical signs and moves; tail wraps around cylindri-
cal object, normal gait
Hind legs are extended; tip of tail
0.5 Partially limp tail droops and/or does not wrap around
cylindrical object; normal gait
Hind legs are extended; tails droops
1 Paralyzed tail and does not wrap around cylindri-
cal object; normal gait
Hind legs are extended; tails droops
1.5 Loss in coordinated movement and does not wrap around cylindrical
object; uncoordinated gait
Hind legs contract when held at the
base of tail; mouse walks with unco-
2 Hind limb paresis
ordinated movement; hind limbs reflex
when toes are pinched; limp tail
Mouse drags one hind limb; one hind
2.5 One hind limb paralyzed limp does not respond to pinch; limp
tail
Mouse drags both hind limbs; both
3 Both hind limbs paralyzed hind limbs do not respond to toe pinch;
limp tail
Mouse drags both hind limbs but has
difficulty using forelimbs to pull body;
3.5 Hind limbs paralyzed; forelimbs weakness
forelimbs respond to toe pinch; limp
tail
Mouse cannot move; forelimbs do not
4 Forelimbs paralyzed
respond to toe pinch; limp tail
No movement; cold to the touch; al-
5 Moribund
tered breathing
vestigations, and were performed ex vivo [68, 69, 70, 71, 72]. Both mice and rats were used for
these experiments, and the brain or spinal cord was examined. BBB disruption was present
with early signs of EAE, but increased with severity.
Divergence in the BBB litterature concerning the peak of permeability is due to many factors.
First, different protocols are used, which makes it difficult to compare results. Indeed, many
different techniques (routes of injections, doses and MOG sequences) and animals (guinea
pig, rabbit, rat, mice) can be used when inducing EAE. Differences in permeability tracers
can also account for divergent conclusions (gadolinium (Gd), horseradish peroxidase (HRP),
10radioactively-labelled or fluorescent markers). Studies using Gd are done in vivo and have
a much lower resolution due to the imaging technique used, i.e. magnetic resonance imag-
ing (MRI). HRP is detectable ex vivo with electron microscopy, and is thus used for high-
resolution studies. Radioactive markers are used for ex vivo experiments and are detected by
fluorimetry. Fluorimetry requires the sample to be homogenized in order to measure the level
of radiocactivity per gram of tissue. Fluorescent markers are used both in vivo and ex vivo
and are detected with regular fluorescence microscopy or fluorimetry. However, experiments
using the same tracers can still present contradictive conclusions. Another important factor
is the different regions of the CNS studied. Investigations of vascular permeability in EAE are
mostly done in the brain, but some look at the spinal cord. The spinal cord can be studied as
a whole, or as three separate segments (cervical, thoracic, lumbar). All these regions can show
different levels of vascular permeability while the disease progresses. Hence, these factors can
cause results regarding the onset and peak of permeability to be conflicting. A closer look at
the protocols and conclusions is imperative when examining the litterature.
Most papers agree that vascular permeabilty precedes clinical symptoms [68, 69, 72, 73, 74, 75,
76], while others first detect it at onset of the disease [67, 77]. Since EAE is not spontaneous,
an immune response from the induction should precede disease onset. Still, some studies did
not find evidence of BBB permeability in pre-clinical animals. An important element is the
definition of the term "pre-clinical" and the problems associated with selecting pre-clinical
animals. Knowing the course of the disease gives an appoximate day of onset. However, in
some animals, it can occur 2 to 3 days before or after the average onset day. Thus, when
assessing pre-clinical permeability, measurements can be done a few hours to days before on-
set. If vascular permeability changes are fast to happen, some studies might have missed them.
1.3.3 Limitations of Ex Vivo Studies in MS and EAE
Ex vivo studies are widely used to study MS and EAE. However, these studies come with
constraints: the available neural tissue and methods used can bias the results. In MS, biopsy
is impossible, since it would require removal of nerve tissue. Therefore, MS brains are col-
lected at the death of patients, likely at an advanced stage of the disease. This makes it
difficult to study the early signs and causes of the disease. It is possible to quantify the level
of immune cells and cytokines via blood, urine and cerebro-spinal fluid samples [78]. However,
examination of demyelination and nerve damage requires extraction of the tissue. Thefore,
some transient key factors at early stages of the disease can go unnoticed when examining
brains at advanced stages of MS.
In EAE ex vivo experiments, fixation and extraction of the neural tissue can affect the out-
11come of the study. In order to obtain the brain and spinal cord, perfusion of the animal is necessary. It consists of flushing the blood using a saline solution pumped into the blood vessels intracardially. The saline solution is followed by a fixative, paraformaldehyde (PFA). This process allows for the conservation of tissue, immunohistochemistry and slicing. How- ever, the use of solutions can affect the imaging of permeability markers that were injected in vivo. Indeed, the perfusion process can cause the marker to diffuse or be completely washed- out [79]. Slicing of the tissue can also produce cutting artifacts that become apparent when looking at structures using electron microscopy [80]. Furthermore, ex vivo experiments do not allow for the study of dynamic processes, such as diffusion of permeability markers over time, cellular infiltration, or longitudinal imaging. For these reasons, in vivo experiments using animal models are privileged over ex vivo studies. 1.4 Fluorescence Microscopy Optical microscopy is the perfect tool for imaging at the molecular level due to its submicron resolution. Fluorescence contrast is largely used in biological studies because of its versatility and many labelling methods. 1.4.1 Principles of Fluorescence Fluorescence is a form of luminescence whereby a molecule (fluorophore) excited by light reemits light of lower energy (higher wavelength). Light is an electromagnetic radiation that can also be described as individual particles, namely photons. Photons contain energy that can excite molecules to different energy states. In the case of one-photon excitation fluores- cence (OPEF), a single photon gives its energy to a valence electron of a fluorescent molecule. The electron will then reemit another photon of lower energy. This loss of energy is due to conversion to vibrational energy of the molecule. This can be simply explained with a Jablonski diagram: when excitation occurs, the energy state of the molecule transits from the ground level S1 to a higher energy level S2 (Figure 1.5 (a)). Relaxation to the ground level of S2 follows, through emission of vibrational energy. The molecule will then transit back to S1 by emiting a photon at λemission . The difference in energy between the maximum excitation wavelentgh (λexcitation ) and maximum emission wavelength (λemission ) is called the Stokes shift (λexcitation < λemission ) (Figure 1.5 (b)). The process of excitation-emission happens at the nanosecond scale, making it highly repeatable in a short period of time. Another state called the triplet state (T1 ) can be implicated in the process. Transition to the triplet state is called intersystem crossing and causes molecules to become non-fluorescent temporarily. Indeed, the lifetime of the T1 state is short and transition to the ground state is usually non-radiative. When radiation occurs, it is called phosphorescence. OPEF is a linear process, because the excitation is proportional to the intensity. 12
Figure 1.5: Jablonski diagram for OPEF and TPEF and Stokes shift. a) OPEF occurs when
a molecule is excited by a photon to a level of higher energy S2 , relaxes to the ground state
and emits a photon of lower energy. Phosphorescence is present when intersystem crossing
occurs. b) The Stokes shift represented with the excitation and emission spectra of GFP
c) TPEF requires an electron to absorb two photons simultaneously. The absorbed photons
have lower energy than the emitted fluorescent photons.

In opposite to OPEF, where all illuminated planes can produce fluorescence, two-photon ex-
citation fluorescence (TPEF) occurs when the density of excitation photons is high enough
so that the probability of a molecule absorbing two photons at the same time is significant
(irradiance, order of 109 W/cm2 ) (Figure 1.6). For TPEF to occur, two photons have to be
absorbed by a molecule. Scattered photons can not participate in TPEF since their phase is
changed and are therefore no longer coherent with other photons. Thus, a high number of
photons is necessary when imaging in tissue and depth penetration is limited. The excitation
wavelength in TPEF is approximately two times the excitation wavelength in OPEF, so that
the energy transfered to the molecule is the same (Figure 1.5 (c)). In this case, the λemission
is lower than the λexcitation . TPEF is a non-linear process since the excitation is propor-
tional to the square of the intensity.

                                                                                            13
Figure 1.6: One-photon excitation versus two-photon excitation. a) One-photon excitation, with focused excitation light in blue. Emitted fluorescent light in green comes from all planes illuminated b) Two-photon excitation, with focused excitation light in red. Emitted fluo- rescent light in green comes from the focal point only, where the density of photon is high enough. Two main factors determine the fluorescence efficacy of a fluorophore at a given wavelength. First, the molar absorptivity coefficient (ε) is a measure of how efficiently a molecule absorbs light (M−1 cm−1 ). Secondly, the quantum yield (η) is the fraction of absorbed light that is re-emitted as fluorescence (%). A good fluorophore has both a high ε and η. Photobleaching occurs when a fluorophore loses its fluorescent properties. It is caused by photochemical reactions of the fluorophore with oxygen in its excited state, creating free radicals. Once the molecule is photobleached, it no longer emits light. Photobleaching can also cause phototoxicity in live samples. To reduce photobleaching, it is important to limit the excitation duration and power. 1.4.2 Principles of Microscopy The first optical microscopes used to image fluorophores were widefield microscopes (Fig- ure 1.7). In these microscopes, illumination comes from an incoherent white light source, generally a mercury or xenon lamp, and is uniform over the field of view. The fluorescent signal is generated in the sample by OPEF. An image of the entire field of view is formed on the detector, a CCD camera, with the help of mirrors, dichroic filters and lenses. A dichroic mirror is needed to separate the incident light from the emitted light while lenses are used for magnification. Filters in the optical path enable the selection of specific excitation and emission wavelengths. 14
Figure 1.7: Widefield microscope. In a widefield microscope, the whole field of view is illumi-
nated and a camera is used to collect the light.

The lateral resolution of a microscope, i.e. the ability to resolve two adjacent points in an
image, depends on the Rayleigh criterion and the components of the system. The Rayleigh
criterion is the minimal distance between two distinguishable points in an image. Under
this distance, the two points are unresolved, i.e. are perceived as one bigger structure. The
Rayleigh criterion is defined as follows:

                                                        λ
                                            R = 0.61                                      (1.1)
                                                       NA

where λ is the wavelength of the collected light and NA is the numerical aperture of the
objective. Aberrations from the lens and mirrors can diminish the resolution by focusing the
light at different focal points. When these effects are not present, the system is said to be
diffraction-limited, and its lateral resolution is given by the Rayleigh criterion. Resolution
can be measured experimentally by imaging the point spread function of the system using an
extremely small object, usually nanobeads.

                                                                                            15
In widefield microscopy, fluorescent light is emitted from all planes illuminated, i.e. from the focal and out-of-focus planes (no sectioning). The depth penetration of the excitation light is limited mainly by the scattering coefficient of the sample and by absorption. Signal coming from scattered photons and above/below planes blurs the image. To avoid this effect, samples are cut in thin slices (a few µm thick). However, it is not always possible to do so: another option is to use confocal microscopy. 1.4.3 Confocal Microscopy Confocal microscopy is an imaging technique that provides good lateral resolution and sec- tioning of the plane of interest. As in widefield microscopy, one-photon excitation generates the signal. However, the excitation light is focused in one point at the sample. The field of view is scanned point-by-point (Figure 1.8) and the signal is collected by a detector such as a photomultiplier tube (PMT) or avalanche photodiode (APD). The image is reconstructed from the scanning pattern. In order for this technique to be efficient, coherent light sources compatible with fluorophores and fast scanning are necessary. Many wavelengths are now available with lasers and new scanning strategies have been developed to increase the scan- ning rate, such as galvanometric mirrors [81], rotating polygons [82], spinning disks [83] and acousto-optic modulators [84]. To achieve sectioning using confocal microscopy, an aperture, the pinhole, is placed in front of the detector so that signal from out-of-focus planes is blocked (Figure ??). This requires the detector to be before the scanning unit. However, the pinhole also blocks scattered emitted photons that originated from the focal point, thus losing an important part of the signal. 1.4.4 Two-Photon Microscopy Two-photon excitation fluorescence (TPEF) microscopy revolutionized the field of imaging by offering a new way to section a place of interest. It was first used as an imaging technique in 1990 by Denk, Strickler and Webb [85]. Instead of blocking the signal from out-of-focus planes with a pinhole, excitation by simultaneous absorption of two photons is made possible at the focal point only, where the density of photons is high enough for TPEF to occur. To achieve such conditions, pulsed lasers are necessary. Without the use of a pinhole, scattered photons generated at the focal point can be collected, increasing the signal. The field of view is scanned as in confocal microscopy, but the detector is placed close to the objective in order to collect as much light as possible (Figure 1.9). Another great advantage of TPEF microscopy is the deeper penetration depth of excitation light. Indeed, longer wavelengths (infrared) have a lower scattering coefficient in tissue, thus increasing the probability of TPEF deeper in the sample [86, 87]. Furthermore, photobleaching is reduced by only exciting the 16
Figure 1.8: Confocal microscope and the scanning unit. Simplified confocal microscope show-
ing the scanning unit, the detector and the pinhole. The galvanometric mirror and spinning
polygon scan the field of view in x and y.

fluorophores at the focal point. Cell viability is also improved using infrared light instead
of ultraviolet light [88]. Indeed, TPEF requires less energetic photons. However, to achieve
the peak intensity needed for TPEF at the focal point, expensive pulsed lasers are needed.
Nonetheless, TPEF microscopy is now favoured over other sectioning techniques.

                                                                                          17
Figure 1.9: Two-photon microscope. Simplified two-photon microscope showing the scanning unit, optical sectioning at excitation and the detector. 18
Chapter 2

Access to the Spinal Cord

The CNS is composed of the brain and the spinal cord and has a pivotal role in receiving,
sending and processing signals to and from the peripheral nervous system. The brain and
spinal cord are morphologically distinct, however both contain blood vessels protected by the
BBB. Since EAE lesions are known to first develop in the spinal cord, this part of the CNS
was studied in this project.

2.1    Anatomy of the Mouse Spinal Cord
The spinal cord is the continuation of the brain and is formed by a bundle of nerve tissue. It
starts at the base of the brain stem and ends in the lower back. It is protected by vertebrae
that provide support and mobility. It is also protected by the meninges, a structure consist-
ing of three membranes: the dura mater, the arachnoid and pia mater. Cerebrospinal fluid
circulates in the subarachnoid space (between the arachnoid and pia mater) and can prevent
damage in case of injury.

The mouse spinal cord has four segments: cervical C1-C8, thoracic T1-T13, lumbar L1-L6
and sacral (S1-S4) (Figure 2.1 (a))[89]. These segments vary in size and shape, making them
easily distinguishable in a transverse view (see figure 2.1 (c)). We define rostral as the ante-
rior end (towards the brain) and caudal as the posterior end (towards the tail). Two different
types of matter form the spinal cord: the gray matter and white matter. The gray matter,
found in the center of the spinal cord, contains neuronal cell bodies that send their axons
to the periphery. These axons can conduct electrical signals towards the periphery (efferent,
motor neurons) or towards the CNS (afferent, sensory neurons). The white matter found on
the edges of the cord is mostly composed of myelinated axons, as well as glial cells. In a
transverse view of the spinal cord, the two components are easily identified (Figure 2.1 (b)).

                                                                                             19
a) Brain
Cervical Thoracic Lumbar Sacral
Rostral Caudal
b) c)
Figure 2.1: Anatomy of the spinal cord. (a) Brain and four segments of the spinal cord:
cervical, thoracic, lumbar and sacral. Modified from Steve Lacroix. (b) Transverse view of
the spinal cord showing the location of the grey and white matter. Modified from molec-
ularsynthetics.com. (c) Transverse view of cervical, thoracic and lumbar segments. From
[89].
20a)
Posterior vein
Posterior artery
Posterolateral vein
Anterior artery
and vein
b)
Figure 2.2: Blood vessels of the spinal cord. (a) Main vessels of the spinal cord. From [93] (b)
Definition of artery, vein, arteriole, venule and capillary. Venules and arterioles are directly
connected to the vein and artery, while post-capillary vessels form the network attached to
the arterioles and venules. From DK Pocket Eye Witness; Human Body.
The blood vessels that irrigate the spinal cord are numerous (Figure 2.2 (a)). The main ar-
teries (posterior and anterior) along with arterioles and capillaries supply oxygenated blood.
Arterial vessels are highly contractile and have thick walls. The veins (posterior, postero-
lateral and anterior) are connected to venules and post-capillary venules ascending from the
tissue (Figure 2.2 (b)). Venular vessels transport deoxygenated blood, have thin walls and
do not pulsate. Unlike arteries, veins possess valves to control the direction of blood flow.
The veins and arteries are the biggest blood vessels of the spinal cord with a diameter of
∼ 250µm. Venules and arterioles measure 20 − 30µm in diameter, while post-capillary vessels
measure 5 − 15µm (from experimental data). Post-capillary venules are thought to be an
immunologically privileged site, one that is relevant to cellular infiltration [90, 91, 92].
21Figure 2.3: Terminal access to the spinal cord. The spinal cord is exposed at segment L4 and stabilized using clamps. 2.2 Terminal Access The spinal cord can be studied in vivo using a terminal approach, i.e. with sacrifice of the animal at the end of the experiment. To do so, a laminectomy is performed at the lumbar segment in an anesthetized mouse (Appendix B for a step-by-step guide). A laminectomy is the surgical removal of one or more vertebra(e) to expose the spinal cord. Cervical and thoracic segments of the spinal cord are not accessible for in vivo experiments due to the anatomy of the mouse. Indeed, these segments are too deep to be exposed in vivo. After removing vertebrae, the dorsal region of the spinal cord, i.e. the white matter as well as the posterior vein, venules and post-capillary venules, are accessible for imaging. In vivo imaging of the spinal cord can be difficult due to movement of the animal. Indeed, heartbeat and breathing movements are significant in the lumbar region and need to be mini- mized. Following a laminectomy, the spinal cord can be stabilized using a custom-made stage and clamps (Figure 2.3). By suspending the mouse and firmly clamping adjacent vertebrae, the movement is greatly reduced. This technique allows for an imaging session of approximately 2 to 4 hours maximum, followed by sacrifice of the animal. 22
2.3     Longitudinal Access
To study the spinal cord in vivo over a long period of time, a spinal window chamber is nec-
essary. Many designs have been developed [94, 95, 96, 97]. As in the case of terminal access,
a laminectomy is performed at the lumbar segment. However, the spinal cord is protected
by a coverglass to allow imaging and survival of the animal (Figure 2.4 (a), (b)). Using this
technique, investigation of a long-term process can be monitored in the same animal over
time. Many advantages arise from this technique: less animals are necessary, each animal is
its own control and evolution of the phenomenon is monitored over time in a single animal,
thus reducing variability issues.

However, there are many technical challenges to overcome when using a longitudinal tech-
nique. Imaging over a long period of time (weeks) requires an optically clear window chamber.
The growth of tissue over the spinal cord is a common problem among all designs (Figure 2.4
(c)). This process is due to the immunological response following the surgery. Administration
of immunosuppressants (e.g. dexamethasone) helps to minimize this response. The spinal
cord can also be greatly perturbed due to the surgery and many drugs administered. Re-
moval of one vertebra should not affect a mouse’s normal activities, but the exposed spinal
cord needs to be correctly protected. To prevent infections, medication is used, which can
interfere with experimental protocols. The morphology and physiology of cells or tissue stud-
ied can also be modified due to inflammation, such as in blood vessels (Figure 2.4 (d)). It is
important to first assess the impact of spinal window implementation before proceeding with
experiments: if done correctly, it will not affect the outcome of the study.

                                                                                           23
a) b)
c)
d)
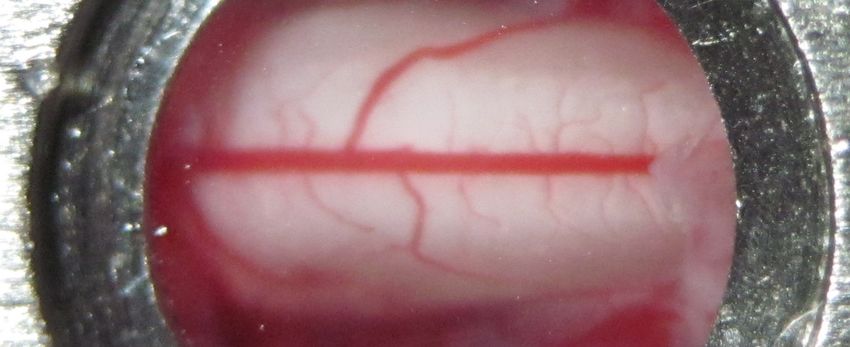
Figure 2.4: Longitudinal access to the spinal cord. (a) Schematic representation of Farrar et
al. window [96]. The spinal cord is exposed at the segment L4 and protected by a coverglass.
From Benoit Aubé. (b) Picture of Farrar’s spinal window, performed at CRIUSMQ, Université
Laval, by the author and Benoit Aubé. (c) Tissue growth on top on the spinal cord following
the implementation of the spinal window. (d) Morphology and physiology of blood vessels
(in green) is different at day 4 post-implementation without the use of immunosuppressants.
Vessels are irregular and permeable to the permeability marker (sodium fluorescein).
24Chapter 3
Fluorescent Permeability Markers
Assessment of blood-brain barrier integrity can be done using many different exogenous tracers
injected intravenously (i.v.) [98]. A suitable marker does not cross the BBB under normal
physiological conditions, but does once the integrity of the barrier is compromised. The
most commonly used markers are gadolinium, horseradish peroxidase, fluorescent probes and
radioactively-labelled molecules and proteins. Fluorescent markers offer great advantages
compared to others. Indeed, they are inexpensive, safe, can be easily used with a regular
fluorescence microscope and permit the study of other structures with fluorescence or other
modalities (e.g. coherent anti-Stokes Raman scattering (CARS), second-harmonic generation
(SHG)). However, extravasation of different tracers may differ depending on their nature
(molecular weight (MW), chemical properties) and the dynamics of the BBB damage [99].
3.1 Evans Blue
Evans Blue is a dye with a MW of 961 Da. It was one of the first fluorescent markers used to
study the blood-brain barrier and is still widely used . Its dark blue colour makes it visible to
the human eye, facilitating experiments at the macroscopic level. In vivo, it binds to serum
albumin with a high affinity. Albumin is a 67 000 Da protein found in blood. Evans Blue
becomes fluorescent once it is bound to albumin (λexcitation = 620nm, λemission = 680nm),
forming a ∼ 69000 Da MW complex. Thus, Evans Blue is used to study vascular albumin
leakage. Research in the fields of brain tumor [100], ischemia [101] and EAE [65, 68] use this
tracer.
Evans Blue can be visualized using fluorescence microscopy, fluorimetry or macroscopic ex-
aminations (Figure 3.1). Microscopy is often used when a high resolution is needed to locate
extravasation at the molecular level [102]. Fluorimetry requires homogenized tissue in order
to obtain a fluorescence level per mass of tissue [65]. Macroscopic examinations are used when
25You can also read