Working Paper 207 COVID-19: Emergence, spread and its impact on the Indian economy and migrant workers - Zentrum für Entwicklungsforschung
←
→
Page content transcription
If your browser does not render page correctly, please read the page content below
Working Paper 207
Ashok Gulati, Shyma Jose, B.B. Singh

COVID-19: Emergence, spread and its impact on the Indian
economy and migrant workers

ISSN 1864-6638    Bonn, April 2021

ZEF Working Paper Series, ISSN 1864-6638
Center for Development Research, University of Bonn
Editors: Christian Borgemeister, Joachim von Braun, Manfred Denich, Till Stellmacher
and Eva Youkhana

Authors’ addresses

Ashok Gulati
Indian Council for Research on International Economic Relations (ICRIER)
agulati115@gmail.com, agulati@icrier.res.in

Shyma Jose
Indian Council for Research on International Economic Relations (ICRIER)
iamshyma@yahoo.co.in

B.B. Singh
Inferential Survey Statistics and Research Foundation (ISSRF)
drbbsingh@hotmail.com
COVID-19: Emergence, spread and its impact on
  the Indian economy and migrant workers
            Ashok Gulati, Shyma Jose and B.B. Singh
Abstract
This study examines the impact of the Covid-19 pandemic and the related nationwide lockdown on
the Indian economy, particularly on food systems. It also takes up an important issue of millions of
migrant workers in India who seem to have suffered the most during this period. The loss of their
livelihood, incomes, and food insecurity are captured through a survey of 2917 migrant workers in six
different states of India. At the end, the study gives recommendations on how to broaden the support
for migrant workers nationwide.
Due to the pandemic-induced lockdown, the Indian economy contracted 24 percent in the first quarter
of the financial year (FY) 2020-21 (April-June). The worst affected sectors were construction, trade
and hotel and other services, and manufacturing. Consequently, the unemployment rate surged to
23.5 percent in April 2020. Given the easing of lockdown and measures taken by the government in
the wake of the first wave of the pandemic, the economic growth revived to -7.5 percent in the second
quarter of FY 2020-21. The food processing industry particularly manufacture of grain milling products,
dairy products and animal and vegetable oil, were resilient during the lockdown. However, the
pandemic adversely impacted the processing and preservation of meat, fruits and vegetables. Notably,
the agricultural sector is the only sector that recorded a positive growth rate of 3.4 percent during the
first two quarters of FY 2020-21. Nevertheless, the disruption of the agri-food supply chain,
particularly during the initial period of the lockdown, pushed food inflation from 8.8 percent in March
2020 to 11.7 percent in April 2020, but it came down to 3.4 percent by the end of the third quarter
(December) of FY 2020-21.
The unprecedented migrant crisis was one of the major catastrophes that emerged during the
pandemic. The sudden imposition of the lockdown had a severe impact not only on employment but
consequently on the earnings and savings of the migrants once they reached their villages. At their
native place, with no proper employment opportunities, the household income of migrants fell by 85
percent during June-August 2020, as per the survey findings. With the revival of economic activities
post-lockdown, we found that 63.5 percent of migrants have returned to the destination areas by
February 2021, while 36.5 percent were still in their villages at their native places. Although the
migrant’s household income has increased after remigration, there is still a contraction of 7.7 percent
relative to the pre-lockdown level. The household income of the migrants who are still at their native
place post-lockdown contracted more than 82 percent compared to pre-lockdown.
To revive the economy and provide support to vulnerable populations, the central government
announced a series of packages. These included an additional quantity of subsidised food-grains under
the Public Distribution System (PDS), cash transfers through Jan Dhan Yojana, free gas supply under
the Ujjwala scheme, an ex-gratia to widow/senior citizen as well as income transfer to farmers under
PM-Kisan. Overall, our survey showed 84.7 percent of the migrants had access to subsidised cereals
under PDS, while the percentage receiving pulses was much lower at 12 percent during November-
December 2020. Moreover, only 7.7 percent of migrants in their native place reported being engaged
in Mahatma Gandhi National Rural Employment Guarantee Act (MGNREGA) or any other public work.
The demand-driven skill training under GKRY reached only 1.4 percent of migrants at their native place
in our survey. Many workers reported a fall in the quality of food consumed during the lockdown and
post-lockdown compared to the pre-lockdown level. With no access to relief measures and
entitlements, a quick recovery of the migrant workers seems grim.
Keywords: Covid-19, lockdown, food system, migrants, India
JEL codes: H55, I15, I18, J61
1Executive summary
The outbreak of Covid-19, starting with Wuhan in China in late 2019, intensified and spread
worldwide. It has impacted several economies badly, including advanced economies such as the USA
and many European countries. India recorded the highest single day Covid cases (315,925) in the
world, surpassing Brazil and the US (as of April 21st, 2021). However, in terms of per million population,
the country recorded one of the lowest infection (8436 confirmed cases per million) and fatality rates
(118 deaths per million) (as of March 9th, 2021).
This study examines the impact of the Covid-19 pandemic and consequent nationwide lockdown on
the Indian economy, particularly on food systems. More specifically, it attempts to empirically capture
the effect of Covid-19 on overall economic growth, agriculture, food industry, food inflation, etc., since
the nationwide lockdown started on March 24, 2020. Besides this, it also takes up an important issue
of millions of migrant workers in India who seem to have suffered the most during this period of
lockdown. The loss of their livelihood, incomes, and food insecurity are captured through a survey of
2917 migrant workers in six states of India. These states are - Uttar Pradesh, Bihar, Jharkhand, Odisha,
Chhattisgarh, and West Bengal, which generally contribute to about two-thirds of the migrant labour
force in the country. And finally, there is an essential question about what role the government played
in alleviating the distress of the most vulnerable sections of the population in ensuring their livelihoods
and food security? These are some of the questions addressed in this study.
Indian government declared a stringent lockdown on March 24th, 2020, at a notice of just four hours,
to control the pandemic. The cessation of economic activities disrupted the supply chains and
production networks, resulting in an overall decline in output growth, a significant increase in
unemployment and reduced earnings and savings, which threatened the food and livelihood security
of millions of workers in the country.
Due to the pandemic-induced lockdown, the Indian economy contracted 24 percent, the lowest
quarterly growth, during the first quarter of the financial year (FY) 2020-21 (April-June). (FY in India
runs from April 1st to March 31st). The worst affected sectors were construction, trade and hotel and
other services, and manufacturing. The Index of Industrial Production (IIP) also experienced a sizable
contraction of 55.5 percent in the first half of FY 2020-21 (April – September), reaching its historical
low with most of the industries being closed down. Consequently, the unemployment rate surged to
23.5 percent in India in April 2020 (CMIE, 2020).
Given the easing of lockdown and measures taken by the government in the wake of the first wave of
the pandemic, the economic growth revived to -7.5 percent in the second quarter of FY 2020-21 (July-
September), registering a V-shaped recovery. Within the manufacturing sector, the examination of IIP
for manufacturing food products reflects that the food processing industry particularly manufacture
of grain milling products, dairy products and animal and vegetable oil, were resilient during the
lockdown. However, the pandemic adversely impacted the processing and preservation of meat and
fruits and vegetables during the lockdown.
Notably, the agricultural sector is the only sector that recorded a positive growth rate of 3.4 percent
during the first two quarters of FY 2020-21, providing a cushion to keep the rural economy afloat
during the Covid-19 pandemic. A bumper food-grain production of 303.3 million tonnes in 2020-21,
remarkable procurement operation (39 million tonnes of wheat in rabi marketing season (RMS) 2020-
21 and 46 million tonnes of rice in the ensuing kharif marketing season (KMS) 2020-21 coupled with
favourable monsoon contributed significantly to agricultural growth. Similarly, a steep increase in
tractor sales (17.35 percent) and farm exports (9.8 percent) between April-December FY 2020-2021
over the same period of FY 2019-2020 also helped revive the agricultural sector and the rural
economy. However, the disruption of the agri-food supply chain, particularly during the initial period
of the lockdown, pushed food inflation (measured by consumer price index (CPI)) from 8.8 percent in
2March 2020 to 11.7 percent in April 2020, but it came down to 3.4 percent by the end of the third
quarter (December) of FY 2020-21.
The unprecedented migrant crisis was one of the major catastrophes that emerged during the
pandemic. The government was caught unaware as it did not have accurate information on the
number of migrants who needed support. Although the government stated that the number of reverse
migrants stood at 10.4 million in September 2020, it seems underestimated, according to various
studies. The sudden imposition of the lockdown had a severe impact not only on employment but
consequently on the earnings and savings of these migrants once they reached their villages. At their
native place, with no proper employment opportunities, the household income of migrants fell by 85
percent during June-August 2020, as per the survey findings.
With the revival of economic activities post-lockdown, we found that 63.5 percent of migrants have
returned to the destination areas by February 2021 (Phase 3 survey), while 36.5 percent were still in
their villages at their native places. Notably, Bihar recorded the highest percentage of migrants
returning to the destination post-lockdown at 92.5 percent. In comparison, the migrants from West
Bengal (40.3 percent) and Jharkhand (31.2 percent) were hesitant to return to the destination area
post-lockdown. Although the migrant’s household income has increased after remigration, there is
still a contraction of 7.7 percent relative to the pre-lockdown level. The household income of the
migrants who are still at their native place post-lockdown contracted more than 82 percent compared
to pre-lockdown.
To revive the economy and provide support to the vulnerable population, the central government
announced a series of packages. These included an additional quantity of subsidised food-grains under
the Public Distribution System (PDS), cash transfers through Jan Dhan Yojana, free gas supply under the
Ujjwala scheme, an ex-gratia to widow/senior citizen as well as income transfer to farmers under PM-
Kisan. Notably, the central government also launched Garib Kalyan Rozgar Yojana (GKRY) to generate
employment opportunity in rural areas in six states with a high concentration of reverse migrants.
Did the schemes reach the targeted population, and how effective were these schemes to mitigate
the pandemic's negative impact? Overall our survey showed 84.7 percent of the migrants had access
to subsidised cereals under PDS, while the percentage receiving pulses was much lower at 12.2
percent during November-December 2020. Moreover, only 7.7 percent of migrants in their native
place reported being engaged in Mahatma Gandhi National Rural Employment Guarantee Act
(MGNREGA) or any other public work. It may be that the migrant workers were not ready to work in
MGNREGA schemes where wages were as low as about 40 percent of what they used to get at their
place of work, or it may be that MGNREGA did not have its total reach. The demand-driven skill training
under GKRY reached only 1.4 percent of migrants at their native place in our survey. Many workers
reported a fall in the quality of food consumed during the lockdown and post-lockdown compared to
the pre-lockdown level. With no access to relief measures and entitlements, a quick recovery of the
migrant workers seems grim.
The study recommends a) scale of permissible work under MGNREGA could be broadened to absorb
the wide range of skilled and unskilled migrants, b) skill mapping of the migrants could be conducted
at Gram Panchayat or block levels to provide employment on a demand-driven basis under GKRY, c)
create a local platform at the Gram Panchayat level to register and connect these workers and
employers so that they get the opportunity to work closer to their home, d) eastern states in India
require a massive reconstruction programme - like Roosevelt’s New Deal, to build infrastructure,
agricultural markets and rural housing and in the long run, alleviate distress
migration e) implementation of ‘One nation, one ration card’ with an option to receive cash or grain
in kind, needs to be fastened for the portability of PDS entitlements at the destination f) a universal
social protection programme is crucial to provide cushion to the vulnerable section against uncertainty
and, g) lastly, a periodic database on migrant workers, say every five years, must be carried out, for
any meaningful policies based on this data.
3Preface
Covid-19 has caused unprecedented health and economic shock across the world. To control the
spread of the pandemic, many countries imposed partial or complete lockdowns during the first wave
of Covid-19. India also declared a stringent nationwide lockdown on March 24th, 2020. Given that the
country took early lockdown measures, India was able to delay the peak of its first wave of Covid-19
infections (98,000 daily new cases) until mid-September 2020. Infection rates declined to less than
9,000 new cases only during the first week of February 2021 (MoFHW, 2021).
But this resulted in a heavy economic loss. The disruption of economic activities and supply-chains
caused a considerable decline in GDP growth (down by almost 24 percent in first quarter (April-June)
of FY 2020-21), and a significant increase in unemployment, threatening livelihood security of millions
of workers in the country. Migrant workers were the worst-hit.
With the easing of the lockdown and prompt measures by the government to address supply-side
shocks, the economy and other major sectors started to recover by the second quarter of the FY 2020-
21. The approval of the Covid-19 vaccines and the inoculation drive in India had raised hopes to not
only control the outbreak of the virus, but also increase the momentum of economic revival.
However, the general public and the government were again caught unaware by the sudden surge in
new Covid-19 cases during March 2021. With the single-day spike reaching 315,925 on April 21th, 2021,
India’s second wave of Covid-19 seems much stronger and more intense than the first one. Notably,
the spike in the daily Covid-19 cases is now three times that of the highest daily cases recorded during
the first wave. The emergence of a double mutant in Maharashtra, and lowering of guards against
Covid-19 by the public as well as by the government led to a frightening spike, almost like a tsunami,
of new cases, so much so that the health system came to a brink of collapse. Mumbai and Delhi had
to announce weekly lockdowns to control the situation, and many other states may follow soon. The
fear of a full lockdown has again triggered an exodus of migrant workers from industrial centres and
cities to their native villages.
The present study offers important policy lessons for the administration of the ongoing second wave
based on the examination of the first wave of Covid-19 infections. Specifically, this study examines the
effect of Covid-19 on overall economic growth, agriculture, food industry, food inflation, etc. during
the first wave. The paper also discusses the impact of the pandemic on migrant workers using a survey
of 2917 migrants in six states, namely Bihar, Chhattisgarh, Jharkhand, Odisha, Uttar Pradesh and West
Bengal. These six states accounted for two-third of the reverse migrants during the first lockdown.
The survey was conducted in three phases: Phase-1 between June and August 2020; Phase-2 between
November and December 2020; and Phase-3 during the last week of February 2021, to capture the
varying degrees of vulnerabilities among the migrants prior to, during, and after the first lockdown.
The three rounds of the survey were conducted in collaboration with the Inferential Survey Statistics
and Research Foundation (ISSRF).
The potential impact of the second wave of Covid-19 infections is not studied here. It will take another
3-4 months before things get clear on that front. But lessons from the first wave may come in handy
when dealing with the second wave.
4Acknowledgments
This study was developed in the context of the Program of Accompanying Research on Agricultural
Innovation (PARI), supported by the Federal German Ministry for Economic Cooperation and
Development (BMZ). The authors would like to express their appreciation for the support and active
engagement of a number of members of the Inferential Survey Statistics and Research Foundation
(ISSRF). We would like to acknowledge the contribution made by Shri Amitabha Panda (Project Lead
and West Bengal In-charge), Shri Srikara Naik (Odisha In-charge), Dr A. K. Choubey (Bihar In-charge),
Shri Harish Chandra (Jharkhand In-charge) and Dr B. B. Singh (Uttar Pradesh and Chhattisgarh In-
charge) and Shri Rakesh Kr. Singh (IT Expert) for providing us with valuable data and insights on
migrant workers. We are grateful to all the state-level principal investigators and their teams who
worked methodically and conducted the telephonic survey across six states.
5Table of contents
ABSTRACT 1
EXECUTIVE SUMMARY 2
PREFACE 4
ACKNOWLEDGMENTS 5
TABLE OF CONTENTS 6
LIST OF FIGURES AND TABLES 7
1 INTRODUCTION 8
1.1 The Covid-19: Emergence and global spread 8
1.2 Spread of the pandemic in India 10
2 NATION-WIDE LOCKDOWN AND ITS IMPACT ON THE ECONOMY 11
2.1 Impact on the agricultural sector 12
2.1.1 Impact on agri-food supply chain and food inflation 14
2.2 Impact of the pandemic on the industrial output 14
2.2.1 Impact of the pandemic on the food processing industry 15
2.3 Unprecedented migrant crisis: Scale and intensity 17
3 GOVERNMENT RESPONSE: RELIEF AND STIMULUS PACKAGES 18
3.1 Measures for migrants: Relief and rehabilitation 19
4 FINDINGS OF THE MIGRANT SURVEY 22
4.1 Demographic and economic characteristics of the migrants 23
4.2 Remigration post lockdown 23
4.3 Impact of the pandemic on the occupational status 25
4.4 Income and consumption shock due to pandemic 27
4.5 Accessibility to social safety nets and relief measures 30
5 CONCLUSION AND POLICY RECOMMENDATIONS 34
REFERENCES 36
APPENDIX 40
6List of figures and tables
Figure 1: COVID -19 infection waves across selected countries ............................................................. 9
Figure 2: Spatial trend of Covid-19 incidence in India .......................................................................... 10
Figure 3: Ramped-up Covid-19 testing ................................................................................................. 10
Figure 4: Quarterly estimates of the growth rate of GDP at constant 2011-12 prices......................... 12
Figure 5: Production of food-grains and procurements of rice and wheat over the last five years..... 13
Figure 6: General and food inflation during the pandemic .................................................................. 14
Figure 7: Index of Industrial Production during the pandemic ............................................................. 15
Figure 8: Impact of the pandemic on the food processing industry ..................................................... 16
Figure 9: Migrants returned, as of September 2020 (in thousands) .................................................... 20
Figure 10: Average earning member and dependent at the destination area ..................................... 25
Figure 11: Occupational status prior to and post lockdown among the migrants who have returned to
their destination areas .......................................................................................................................... 26
Figure 12: Occupational status among the migrants at the native place during Phase-1 & Phase 2
survey .................................................................................................................................................... 27
Figure 13: Distribution of migrants across the household income at destination and native place .... 28
Figure 14: Migrant’s household income at destination and the native place post-lockdown ............. 29
Figure 15: Consumption shock on the migrant’s household ................................................................ 30
Figure 16: Access to social safety nets and bank accounts................................................................... 31
Figure 17: Percentage of migrants receiving any government assistance at source state .................. 32
Figure 18: Percentage of migrants receiving formal skill training at source states .............................. 32
Table 1: Sample number of migrant home returnees surveyed in Phase-1, Phase-2 and Phase 3 ...... 23
Table 2: Extent of remigration among the return migrants (%) ........................................................... 24
71 Introduction
Novel Coronavirus (Covid-19) has caused an unprecedented health crisis and economic shock across
the world. Many governments imposed complete or partial lockdowns to control the outbreak, which
resulted in economic recessions with a surge in unemployment, disruption of the supply chains and
food systems. According to the International Monetary Fund's (IMF) World Economic Outlook (January
2021), the global economy is estimated to have contracted 3.5 percent during 2020. Notably, the
pandemic has increased the vulnerabilities of millions of workers with a decline of 10.7 percent
(equivalent to US$ 3.5 trillion) in the global labour income during the first three quarters of 2020, as
compared to the same period in 2019 (International Labour Organisation (ILO), 2020). Further, the
pandemic induced employment and income loss has transcended into food and livelihood insecurities.
At the macro level, the nationwide lockdown in India resulted in the complete halting of economic
activities, affecting the supply chains and production networks with an overall decline in output
growth. Consequently, on the demand side, there was a significant increase in unemployment,
reduced earnings and savings, which increased the large-scale vulnerabilities of millions of workers
(Sahoo, 2020, Dev, 2020, Debuquet et al., 2020).
Against this backdrop, we try to assess the impact of the Covid-19 pandemic on the Indian economy.
While our main objective is to study the potential effects of the lockdown on the major sector of the
Indian economy, particularly on the food systems, including food supply chains, food production and
procurement and food industry, we have also discussed the government responses for these sectors
in the wake of the first wave of pandemic. One of the most inhumane crises that emerged in India
during the lockdown has been the unprecedented reverse migration. This impacted the income and
consumption of one of the most vulnerable sections of society. Therefore, we also discuss in detail the
migrant crisis as well as evaluate measures taken by the centre and various state governments to
minimise the negative impact of the pandemic on this vulnerable population.
The pandemic is still coming back with second and third waves, and available real-time information
on the migrants is incomplete. Thus, the present study tries to study the impact of the pandemic on
migrant workers using a telephonic survey of migrants across six states: Bihar, Chhattisgarh,
Jharkhand, Odisha, Uttar Pradesh, and West Bengal. The survey was conducted in three phases
between 30th June and 15th August 2020, 7th November and 30th December 2020 and the last week
of February 2021. The three rounds of the survey, conducted in collaboration with the Inferential
Survey Statistics and Research Foundation (ISSRF), captures the varying degrees of vulnerabilities
among the migrants prior to, during, and after the lockdown.
Based on the present study's findings, we present some policy lessons for India and other developing
countries for future administration of such a pandemic.
The paper is divided into five sections. Section 1 briefly introduces the study's objectives and focuses
on the emergence and spread of the Covid-19 pandemic in the global context and India. Section 2
analyses how the nationwide lockdown impacted the overall economy and broad sectors, and
specifically on the food production, procurement and processing industry. Section 3 highlights the
centre’s and selected state government’s responses and policies to mitigate the pandemic's negative
impact. Section 4 examines the implication of the pandemic on labour migration using the findings of
the survey, and in Section 5, we put forward some policy recommendations to deal with such a
pandemic in future.
1.1 The Covid-19: Emergence and global spread
The emergence of Covid-19 and its spread created severe health and economic shocks across the
globe. Covid-19 first emerged in Wuhan, China, in late 2019. Since then, the pandemic has intensified
8and spread through different trajectories across 220 countries in terms of confirmed cases, fatality
and recovery rates (Economic Survey 2020-21). The outbreak of Covid-19 to the rest of the world
prompted the World Health Organization (WHO) to declare it a pandemic on March 11, 2020.
Figure 1 shows the global spread of Covid-19 cases and fatality across selected countries. Since the
first outbreak of Covid-19 in China, the country experienced its first wave of Covid infections and death
during February 2020. However, since then, China has controlled the spread of the disease, if their
data is to be believed. The advanced economies such as the USA, UK, Germany and France have been
impacted disproportionately, with the USA and UK experiencing their third waves, both in Covid cases
and deaths.
Figure 1: COVID -19 infection waves across selected countries
Confirmed new Covid-19 cases
8 80
7 70
New cases (in million )
New cases China (000)
Lockdown in india
6 60
5 India's peak in Sept 50
4 40
3 30
2 20
1 10
0 0
Dec-19 Jan-20 Feb-20 Mar-20May-20 Jun-20 Jul-20 Sep-20 Oct-20 Nov-20 Jan-21 Feb-21 Mar-2
USA UK Germany France India Brazil China
Confirmed new Covid-19 deaths
120 30
Lockdown in India
100 25 New deaths China (00)
New deaths (000)
80 20
60 India's peak in Sept 15
40 10
20 5
0 0
Dec-19 Jan-20 Feb-20Mar-20May-20Jun-20 Jul-20 Sep-20 Oct-20Nov-20 Jan-21 Feb-21Mar-2
USA UK Germany France India Brazil China
Source: WHO Covid-19 Global Data (as of March 31st, 2021)
On the other hand, India experienced its first wave and peak during mid-September with 98 thousand
new cases (on September 17th, 2020) since its first Covid case on January 30, 2020. Despite an early
and stringent lockdown, India has the second-highest number of Covid-19 cases in the world after the
United States, crossing 15.6 million, as of April 21th, 2021 (WHO Covid-19 Global Data, 2021).
However, the examination of per capita infection and fatality rates reflects that India recorded one of
the lowest Covid cases (8436 confirmed case per million) and fatality rates per million population (118
9death per million) on March 9th 2021. Not just that, the fatality rate in India is lower than the world
average of 332 per million population. On the other hand, advanced countries such as the United
States and the United Kingdom as well as Brazil recorded an alarmingly high infection rate and death
rate per million population.
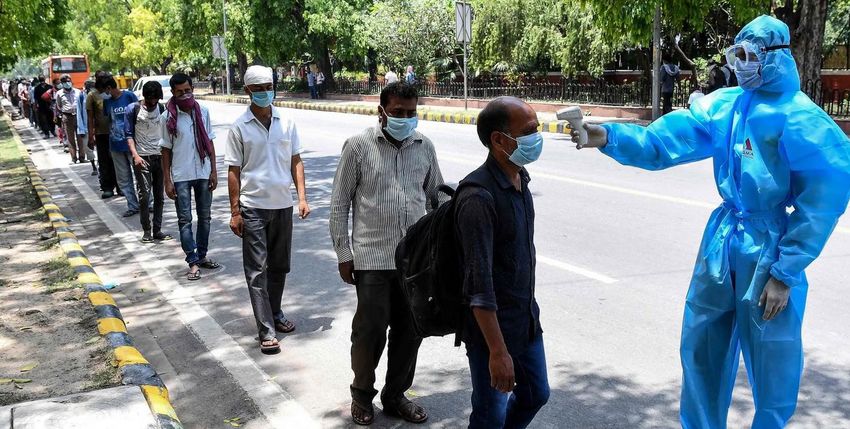
An important measure to tackle the Covid-19 spread is conducting the test on a completely unbiased
and random national sample. In India, albeit the initial strategy adopted was reactive testing, i.e.,
testing the patients with symptoms, the approach has been amended towards comprehensive
surveillance. As of Oct 5th, 2020, India exceeded the 140 tests per day per million populations, as
advised by the World Health Organization (WHO) (ToI, 2020). Although India has ramped up its testing
rate, it is still lagging compared to the advanced countries like the USA, UK, Germany, and Brazil and
South Africa (see Appendix A1). With a relatively low testing rate, India may be undercounting the
actual cases and needs a comprehensive testing strategy to control the spread.
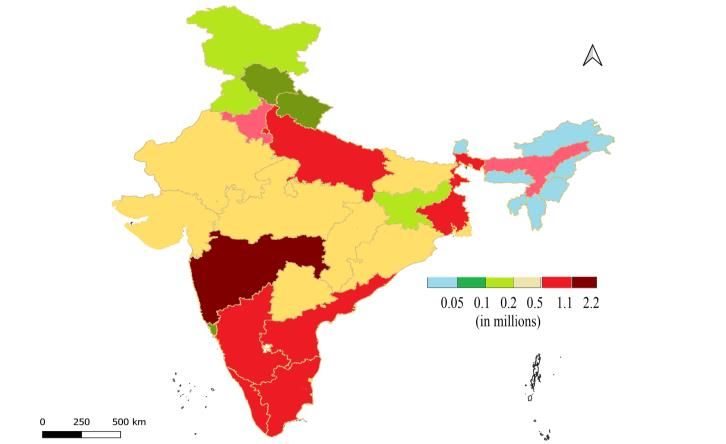
1.2 Spread of the pandemic in India
The spatial trend of Covid-19 cases across Indian states and territories (as of March 9th, 2021) is
illustrated in Figure 2. During the initial stages of the pandemic, the outbreak of the Covid-19 mainly
concentrated in the western and northern parts of the country (Economic survey 2020-21). Notably,
Maharashtra has been one of the worst affected states, with the highest number of Covid infections
and death in India (Figure 2). However, Goa has the highest Covid cases per capita. At the same time,
Odisha1, Uttar Pradesh, Rajasthan and Kerala recorded lower fatality rates per capita (see Appendix
A2). To effectively control the pandemic's spread, India has ramped up its testing strategy with 0.17
million tests per million of population. Across states, testing per capita is better in Delhi, followed by
Goa, Kerala, Karnataka and Andhra Pradesh (see Figure 3).
Figure 2: Spatial trend of Covid-19 incidence in Figure 3: Ramped-up Covid-19 testing
India 40000
Goa
National average 0.17
35000 Delhi
KL
30000
25000
Cases per million
Andhra
MH
20000 Pradesh
Karnataka
15000 TN
Arun. P
Chattisgarh
HR
SKManipur
UK J&K
HP
OdishaTL
10000
NagaWB Punjab
Tripura
Megha
RJ
MP UPMizoramAssam
5000
Gujarat National average 8436
0 Jhark
0.1
Biha
0,20 0.3 0.4 0.5 0.6 0.7
Test per million
Source: https://www.Covid19india.org/ (as on March 9th, 2021)
1The state of Odisha has managed to remarkably contain their fatality rates from Covid-19 through incentivizing quarantine
scheme which offers Rs 15000 to the people who complete the stipulated quarantine (Ray and Subramanian 2020).
102 Nation-wide lockdown and its impact on the economy
Before examining the pandemic’s, macroeconomic implications and discussing the economic policies
adopted to mitigate the economic shock, we discuss the lockdown strategy adopted to flatten the
epidemiological curve.
Many countries declared full or partial lockdown to control coronavirus spread and prevent their
health systems from being overwhelmed. India also adopted a scenario-based approach to assess and
minimise the impact of Covid-19. On March 24th, 2020, at a notice of about four hours, the Indian
Government declared a stringent nationwide lockdown. The lockdown was announced when the
number of cumulative Covid-19 cases2 and deaths were around 519 and 9, respectively (WHO Covid-
19 Global Data, 2020). The rationale for an early nationwide lockdown was primarily to ramp up
testing facilities, set up quarantine centres, treatment facilities, isolate the confirmed patients and
reduce the Covid-19's spread.
The stringent nationwide lock-down in India was imposed in four phases. In the first phase (25th
March-14thApril 2020), the government had shut down the entire economy - all non-essential services,
the agricultural and non-agricultural sector, educational institutions, along with all means of transport.
In the second phase (15th April – 3rd May), economic activities were permitted in agricultural and allied
sectors, manufacturing units of pharmaceuticals, medical devices and construction of medical facilities
and work under Mahatma Gandhi National Rural Employment Guarantee Act (MGNREGA). On May 1,
2020, the Centre issued guidelines permitting the inter-state movement of migrant labour and
stranded persons by special trains. In the third (4th-17th May) and fourth phase (18th-31st May), several
activities had resumed and the lockdown was restricted to only Red zones districts3 and containment
zones, respectively.
After 68 days, on May 31st, 2020, the government announced Unlock 1.0 for the phased reopening of
the economy, except in the containment zones. Subsequently, the lockdown was relaxed in a phased
manner, and measured relaxation was allowed in regions outside the containment zone. The non-
essential establishments and activities, including hotels, restaurants, hospitality services, metro rail,
domestic flights, and shopping malls, have resumed following the easing of lockdown restrictions.
The sudden imposition of the lockdown in India had a drastic impact on the economic front, leading
to a total collapse of the economy, rendering millions jobless. Due to the pandemic induced lockdown,
the Indian economy is estimated to have contracted 8 percent during the FY 2020-21 (April-March),
according to the World Economic Outlook (January 2021). The quarterly growth rate of overall GDP
and broad sectors till the second quarter of FY 2020 is shown in Figure 4. The Indian economy was
already experiencing a decelerating GDP growth, a significant decrease in industrial output, a decline
in private investment and a fall in tax revenues much before the pandemic's emergence (Kishore,
2020). The quarterly growth of GDP’s has been falling continuously since the fourth quarter (Q4) of
the FY 2017-18.
The April-June quarter of 2020-21 recorded the lowest-ever economic growth, with the GDP
contracting by 23.9 percent and plunging into a technical recession. This staggering decline in GDP’s
growth rate reflected the closure of all the economic activities owing to the nationwide lockdown. The
pandemic's overall impact on the economy depended on the government’s measures and the extent
to which intermittent lockdowns were required in the country's different regions (Dev and Sengupta,
2020). In the second quarter of FY 2020 (July to September), GDP’s growth contracted 7.5 percent,
with the lockdown restrictions being eased. Although opening up the economy led to a partial
recovery, the full revival would depend on this recovery's momentum. Given the measures taken by
2 The first Covid-19 case was confirmed in India on January 30, 2020.
3 The districts in India were divided into three zones- Red, Orange and Green, based on the concentration of Covid-19 cases.
11the government in the wake of the first wave of the Covid-19 pandemic, the recovery of India’s GDP
during the first two quarters of FY 2020-21 have been sharp V-shaped.4
All the significant sectors barring agriculture, recorded negative growth in the first quarter of FY 2020-
21. The worst affected sectors were construction (contracted 50.3 percent), trade, hotel and other
services (-47 percent) and manufacturing (-39.3 percent). Like GDP, these sectors also registered a V-
shaped recovery in the second quarter of FY 2020-21. Notably, the agricultural sector is the only sector
that recorded a positive growth rate of 3.4 percent during the first two-quarters of FY 2020-21, higher
than that of 3 percent in the first quarter of FY 2019-20.
Figure 4: Quarterly estimates of the growth rate of GDP at constant 2011 -12 prices
20
QUARTERLY ESTIMATES OF GDP AT CONSTANT PRICES,
10
0
Q1 Q2 Q3 Q4 Q1 Q2 Q3 Q4 Q1 Q2 Q3 Q4 Q1 Q2 Q3 Q4 Q1 Q2 Q3 Q4 Q1 Q2 Q3 Q4 Q1 Q2
-10 2014-15 2015-16 2016-17 2017-18 2018-19 2019-20 2020-21
2011-12 SERIES
-20
-23.9
-30
-40 -39.3
Agriculture, forestry & fishing
-47.0
-50 Manufacturing
Construction -50.3
-60
Trade, hotels and other services
GDP
Source: MOSPI, GoI
2.1 Impact on the agricultural sector
With a positive growth rate of 3.4 percent during the first two-quarters of FY 2020-21, the agriculture
sector has provided a cushion to keep the rural economy afloat during the Covid-19 pandemic. Due to
the government's prompt measures to restore the disruption of the supply chain and ensure smooth
sowing operation during the pre-monsoon and monsoon period, the agriculture sector has been
resilient to the pandemic-induced lockdown. Furthermore, remarkable agricultural production,
increased tractor sale5 and fertilizer production coupled with increased acreage during Kharif season
due to favourable monsoon contributed significantly to agricultural growth (Sharma, 2020; Gupta
2020). In 2020-21, the food-grain production reached 303.3 million tonnes (according to the 2nd
Advanced Estimates), which included 120.3 million tonnes of rice and 109.2 million tonnes of wheat
(see Figure 5). In 2020-21, the production of rice and wheat has been the highest in the last fifteen
years. Even sugarcane and cotton recorded a significant increase in production from 370 million
4The revival in domestic demand is also reflected in the collection under goods and services tax (GST) which surpassed Rs 1
trillion signalling revival of revenue in the economy (see Appendix A3).
5
Tractor sales registered the highest year-on year growth of 17.35 percent in FY 2020-2021 (April to December 2020) as
compared to FY 2019-2020 (See Appendix A5).
12tonnes to 398 million tonnes and 36 million bales to 36.5 million bales, respectively, from 2019-20 to
2020-21.
Figure 5: Production of food-grains and procurements of rice and wheat over the last five
years
a. Production of food-grains b. Procurement of rice and wheat
2020-21 2020-21*
2019-20 2019-20
2018-19 2018-19
Cereals Rice
Pulses Wheat
2017-18 2017-18
2016-17
2016-17
0 20 40 60
0 100 200 300 400
Procurement (million tonnes)
Production (million tonnes)
Source: Production data from the DES, and procurement data from the website of Food Corporation of India &
DFPD.
Note: * as on 23.3.2021 for rice and as on 27.02.2021 for wheat
Likewise, unabated procurement operation, stocking up of food-grain buffers and channelizing the
supply during the initial stage of the pandemic also helped revive the agricultural sector and the rural
economy. The wheat procurement (39 million tonnes) from farmers across the country has been
highest in the rabi marketing season (RMS) 2020-21 compared to the last five years. The rice
procurement in Kharif marketing season (KMS) 2019-20 was 52 million tonnes against 44 million
tonnes the previous year. In the ensuing KMS 2020-21, around 46.0 million tonnes of rice have been
procured from farmers across the country as on March 23rd, 2021.
Another significant factor to have positively impacted the agricultural sector during FY 2020-21 was
the increase in farm exports. Between April-December 2019 and April-December 2020, the
agricultural exports rose from $26.3 billion to $28.9 billion registering an increase of nearly 9.8
percent, while farm imports contracted 5 percent from $16.4 billion to $15.7 billion during the same
period. Table A4 (in Appendix) illustrates India’s top agricultural commodities that are imported and
exported. In April-December 2020(P), marine products, rice (basmati and common), buffalo meat,
spices, and sugar were the top exported commodities, while vegetable oils, pulses, fresh fruits and
cashew were the top imported commodities.
An increase in the global prices of many agri-products helped India to push up its agri-exports,
especially non-basmati rice, cotton, sugar, oilseeds meals, wheat and maize. Also, dry weather
conditions in some major producing countries like Argentina, Brazil, Thailand and Vietnam have
helped to revive India’s farm exports (Damodaran, 2021).
132.1.1 Impact on agri-food supply chain and food inflation
The stringent lockdown imposed for two months from March 24 to May 31 severely disrupted the
agri-food supply chain, particularly during the initial period (Narayanan 2020). Albeit the government
took steps for the smooth operation of agricultural activities, however the shortage of labour, higher
transportation cost due to restrictions on vehicles' movements and intermittent closure of wholesale
mandis hindered the smooth working of the agri-food supply chain. Despite these disruptions during
the lockdown's initial phases, the agri-food system has been remarkably resilient to protect the
nation’s food security. However, the lockdown and consequent bottlenecks on the agri-food supply
chain impacted consumer prices and food prices (Figure 6). During the initial phase of the lockdown,
the gap between inflation measured using wholesale prices (WPI) and retail prices (measures using
consumer price index (CPI)) had increased drastically. The disruption in transportation and delivery of
agricultural produce and an increase in transaction costs of retail traders operating during the
lockdown have been the major contributors to widening the gap between wholesale prices and retail
prices (Narayanan and Saha, 2020).
Figure 6: General and food inflation during the pandemic
16,0
14,0
12,0
10,0
Inflation (%)
8,0
6,0
4,0
2,0
0,0
Apr-20
May-20
Dec-19
Dec-20
Mar-19
Apr-19
May-19
Aug-19
Oct-19
Mar-20
Aug-20
Jan-19
Jun-19
Jun-20
Oct-20
Nov-19
Jan-20
Nov-20
Jan-21
Feb-19
Jul-19
Sep-19
Feb-20
Jul-20
Sep-20
Feb-21
-2,0
-4,0
-6,0
Combined CPI WPI inflation CPI food inflation WPI food inflation
Source: MOSPI and Ministry of Commerce & Industry, GoI, various years
Due to the disproportional rise in onion prices during the second half of 2019, CPI food inflation was
high, shooting to almost 14.2 percent in December 2019. Since early 2020, food inflation has been
declining and reached 8.8 percent in March 2020. The sudden imposition of the lockdown in March
resulted in increasing CPI inflation to 7.2 percent and CPI food inflation to 11.7 percent by April 2020.
The increase in inflation was primarily due to the rise in the prices of pulses, oils and perishables,
including onions and tomato (Narayanan and Saha 2020). Notably, food prices have been significant
drivers of retail inflation during FY 2020-21. However, CPI food inflation fell drastically to just 3.4
percent with a decline in prices of vegetables, cereals and protein products in December 2020.
2.2 Impact of the pandemic on the industrial output
The majority of industrial activities was shut down in the wake of the nationwide lockdown to contain
the spread of the coronavirus. The shutting down of industrial production resulted in a sizable
contraction in the Index of Industrial Production (IIP)6 in the first half of FY 2020-21. In April 2020, the
6
IIP is a composite indicator that measures short term changes in the volume of production including mining, electricity and
manufacturing during a given period of time.
14IIP contracted 55.5 percent, reaching its historical low with most of the industries being closed down.
Between April to September FY 2020-21, the contraction of IIP started slowing down and improved in
October 2020 with the easing of the lockdown and resumption in industrial production (see Figure 7).
Like GDP, IIP general and IIP for manufacturing have also experienced a V-shaped recovery with
consistent movement towards the pre-pandemic level.
Figure 7: Index of Industrial Production during the pandemic
160
140
120
IIP index
100
80
60
40
20
Apr-19
Apr-20
Jan-19
Mar-19
Dec-19
Dec-20
May-19
Aug-19
Mar-20
Oct-20
May-20
Aug-20
Jun-19
Oct-19
Jun-20
Nov-19
Jan-20
Nov-20
Feb-19
Jul-19
Sep-19
Feb-20
Jul-20
Sep-20
Manufacture of Food Products Manufacturing General
Source: MOSPI, GoI, various years
Note: General indices include mining, manufacturing and electricity
2.2.1 Impact of the pandemic on the food processing industry
Manufacturing of food products, particularly the food processing industry, has enormous potential for
value addition of farm outputs, employment generation, exports promotion and domestic supply
chain strengthening. However, the processing of food products has been low in India. According to
Ghosh (2014), only 2.2 percent of fruits and vegetables, 35.0 percent of milk, 21.0 percent of meat
and 6.0 percent of poultry products are processed in India. In 2017-18, the food processing sector
accounted for 1.4 percent of total gross value added (GVA) and 7.9 percent of manufacturing GVA.
The industry also contributed to 4.5 percent of total manufacturing exports (RBI Bulletin 2020). With
the increasing importance of processed food in consumption patterns, the industry is vital for value
addition and increasing agricultural exports. Some of India's major food processing industries are
manufacturing of grain milling products, manufacturing dairy products, processing edible oils,
processing and preserving fruits and vegetables, and processing meat and fish. What has been the
pandemic's impact on the manufacturing of food products and the food processing industry?
Figure 8 illustrates the impact of Covid-19 on the selected IIP of food processing industries in India
during the pandemic compared to previous years. The major food processing industries such as the
manufacturing grain milling products, manufacturing dairy products and processing of vegetable and
animal oils and fat were not affected much due to the lockdown. However, the pandemic had a
considerable effect on the processing and preservation of meat and fruits and vegetables during the
initial period of the lockdown. Although the processing of fruits and vegetables has recovered to the
pre-pandemic level, the IIP of the meat processing industry is still lower than in the last two years.
Lack of consumer confidence in meat products' food safety, as many feared the false premise of meat
and poultry products being a potential transmitter of the coronavirus, could be a significant reason
for the decline in meat products' demand. Overall, as mentioned earlier, the food processing industry,
except the meat, fruits, and vegetable processing sector, did not suffer the pandemic's brunt like other
manufacturing sectors.
15Figure 8: Impact of the pandemic on the food processing industry
Manufacture of grain milling products, Manufacture of dairy products Manufacture of vegetable and animal oils
starches and starch products and fats
180 250
100 160
140 200
80
120
150
IIP index
60 100
80
40 100
60
20 40 50
20
0
0 0
Feb
Apr
Sep
Jan
Mar
May
Aug
Nov
Jun
Jul
Dec
Oct
Jan Feb Mar Apr May Jun Jul Aug Sep Oct Nov Dec Jan Feb Mar Apr May Jun Jul Aug Sep Oct Nov Dec
2018 2019 2020 2018 2019 2020 2018 2019 2020
Processing and preserving of meat Processing and preserving of fruit and Processing and preserving of fish,
vegetables crustaceans and molluscs
250
300 250
200
250 200
IIP index
150 200
150
100 150
100
100
50
50 50
0
0 0
Jan
Feb
Mar
Sep
Apr
May
Aug
Nov
Jul
Jun
Dec
Oct
Jan Feb Mar Apr May Jun Jul Aug Sep Oct Nov Dec Jan Feb Mar Apr May Jun Jul Aug Sep Oct Nov Dec
2018 2019 2020 2018 2019 2020 2018 2019 2020
Source: MOSPI, GoI, various years
162.3 Unprecedented migrant crisis: Scale and intensity
One of the humanitarian crises that emerged during the pandemic was the massive reverse migration.
The pandemic brought the issue of labour migration to the forefront, exposed the daily vulnerability
faced by the migrant workers ranging from dire working and living conditions, exclusion from social
protection and labour rights.
Due to the sudden lockdown on March 24th, which gave just 4 hours’ notice, migrants were caught
unaware, and so was the government about their problems. The lockdown-induced closure of
economic activities has threatened millions of workers' livelihood, access to food, shelter, and basic
necessities. With the restriction of movement and no transportation mode available during the initial
phase of lockdown, migrants started on bicycles and even on foot to go to their villages. This was a
catastrophe unfolding at a large scale that people had not seen earlier. The grim reality is that with the
lockdown, millions lost their jobs, and the unemployment rate surged to 23.5 percent in India in April
2020, according to the Centre for Monitoring the Indian Economy (CMIE)7 (see Appendix A6). Loss of
income and the fear of hunger led to the migrant’s exodus from urban metro cities to their native
places.8
The central government failed to comprehend the nature of the migrant crisis. Besides, there are no
periodic surveys to capture information about migrant workers, except the Census and NSSO.
Therefore, the central government did not have accurate figures for the migrant workers who needed
economic support.
As per the 2011 Census, there were 455.8 million migrants (450m internal and 5.8m external) in India.
Most of them had moved either since birth or marriage or some other reasons. Only 40.8 million
reported employment while 3.5 million reported business as the primary reason for migration. In 2016,
using both 2011 Census data and railway passenger data, the Economic Survey (2016-17) had
estimated that the number of inter-state migrant workers could be around 60 million, and about 80
million inter-district migrant workers, migrating within the same state. Overall, there could be thus
about 140 million (60+80) migrant workers in 2016-17, both inter-state and intra-state. However, both
these figures could be underestimates as Census data underestimates the long-term circular migrants,
whereas the short-term circular migration is not captured. These migrants have retained their links
with their native homes in rural areas and have no place to call home in the urban destination areas
(Srivastava 2020a). Using the NSS (2007-08) and Census (2001 and 2011) data on migration, Srivastava
(2020b) has projected the figures for both short duration (55 million) and long-term circular migration
(85 million) in 2017-18.
These short-term and long-term circular migrant workers with more concentrated origins, particularly
in the poorer states such as Bihar, West Bengal, Uttar Pradesh, Chhattisgarh, Jharkhand, Odisha and
Madhya Pradesh, have borne the brunt of the lockdown. Given that the circular migrants are a large
chunk of the workforce, the central government needs to recognize the scale, magnitude, and nature
of migrant labour and provide adequate economic support to address the migrant crisis. Besides, the
underestimation of migrant workers can have serious ramification, as many of these vulnerable
migrants can be excluded from various relief measures taken by the government.
7
Around 121 million lost their jobs in April 2020 and the only gain in employment during this period was registered by farmers
(5.8 million) due to the easing of lockdown for agricultural activities in the second phase (CMIE, 2020).
8 However, following this exodus of the migrants, the Centre issued stringent orders on the movement of the migrants and
directed them on road to be sent to shelter homes and quarantine.
173 Government response: Relief and stimulus packages
This section discusses the important measures and relief packages announced by the central
government for the economy and vulnerable population and their efficacy to mitigate the pandemic’s
negative impact.
The Central government announced a welfare package of Rs 1.7 trillion under the ‘Pradhan Mantri
Garib Kalyan Yojana’ (PMGKY) on March 26th, 2020. The Pradhan Mantri Garib Kalyan Ann Yojana (PM-
GKAY) offered an additional 5 kg of food grains and 1 kg of pulses per household to 800 million
individuals covered under National Food Security Act (NFSA) till July 2020. This scheme was extended
till the end of November 2020, costing Rs.900 billion (about USD 12 billion) to the central government.
The relief package also included Rs 500 per month, for three months, to an estimated 28 million
women Jan Dhan account holders; an ex-gratia payment of Rs.1000 to widows, elderly, pensioners and
disabled persons; enhanced wage rate from Rs.182 to Rs.202 under MGNREGA; free LPG cylinder for
three months to Ujjawala beneficiaries and collateral-free loans of up to Rs.2 million to female self-
help groups under Deen Dayal Upadhyay Yojana. Further, the centre also announced front-loading the
first instalment of Pradhan Mantri Kisan Samman Nidhi (PM-Kisan) to farmers (Rs. 2000 per farm
households). For the workers in the organised sector, the Government will pay for both the employer
and employee contribution to Employee Provident Fund (EPF) accounts (total 24 percent) from April-
June 2020 for establishments with up to 100 employees, where 90 percent employees are drawing less
than Rs 15,000 per month. For the construction workers registered with the Building & Construction
Workers (BoCW), the State Governments were directed to use the BoCW cess funds to aid workers in
the construction sector.
However, this relief package of Rs 2.7 trillion announced by the government accounted for less than
one percent of the GDP and was not enough to curb the negative impact of the Covid-19 pandemic.
Former RBI Governor, Raghuram Rajan, has argued that around Rs 650 billion would be required to
help the vulnerable population crippled by COVID-19 pandemic. At the same time, Abhijit Banerjee
suggested giving cash doles to the bottom 60 percent of the population to stimulate demand.
Another relief cum stimulus package of Rs.20 trillion, Atma-Nirbar Bharat or Self-Reliant India, was
announced by the centre on May 12th, 2020. It subsumed a range of monetary and fiscal stimulus to
revive the economy and businesses. Some of the essential components of the package for the
vulnerable population and farm sector were a) additional Emergency Working Capital Funding for
farmers through NABARD (Rs 300 billion), b) concessional credit boost to 25 million farmers through
Kisan Credit Cards (Rs.2 trillion), c) Agriculture Infrastructure Fund for farm-gate infrastructure for
farmers (Rs.1 trillion), d) foodgrains for migrant workers, i.e. 5 kg of grains per person and 1 kg pulses
per family per month for two months who are not covered under NFSA, e) affordable rental housing
complexes for migrant workers/urban poor under the Pradhan Mantri Awas Yojana (PMAY) for
migrant labour/urban poor, and f) additional, Rs.400 billion allocated to MGNREGA over and above
Rs.615 billion allocated in the Budget 2020-21.
Additionally, Atmanirbar Bharat also took significant steps to reform the agricultural sector to link
farmers directly to the market for barrier-free inter-state trade. The government passed the Farmers’
Produce Trade and Commerce (Promotion and Facilitation) Act, 2020; the Farmer (Empowerment and
Protection) Agreement on Price Assurance and Farm Service Act, 2020; and The Essential Commodities
Amendment Act, 2020 (ECA) in September 2020. These laws lift restrictions and potentially provide
greater choice and freedom to farmers to sell the product and to buyers to buy and store, thereby
increasing competition in agricultural marketing.
The examination of India’s relief-cum-stimulus package highlighted that these measures had neglected
the urgent need for economic support to the millions of citizens who have lost their livelihood,
particularly the migrant workers. Further, under the Atma Nirbhar Bharat Scheme, 0.8 million tonnes
18of food-grains were allocated for the stranded migrants and all those who are not covered under NFSA9
(GoI, 2020b) for a period of two months between April to June; however, the scheme was extended
till August 31, 2020. As per the details available, 0.27 million tonnes of food-grains (covering 26.7
million households) were distributed for two months under the scheme (as of September 23, 2020).
About 39 thousand tonnes of pulses was also allocated, of which 16.6 thousand tonnes of pulses
(covering 16.6 million households) were distributed till August 31, 2020. According to a Wire report
(Wire Staff 2020), around 26 states have lifted 100 percent of food grains allotted to them in
September. However, Bihar, Chhattisgarh, Nagaland and Odisha distributed all food grains allocated
to the migrants. The distribution of pulses has been rather dismal as compared to the food-grains, with
only Delhi and Manipur reporting a 100 percent distribution of pulses.
Additionally, adding up the total stimulus announced by the Indian government and Reserve Bank
amounted to Rs 29.86 trillion or 15 percent of the GDP. However, breaking down these packages shows
that the centre’s additional fiscal contribution to the stimulus would be under 2 percent of GDP in
2020-21 (Iyer, 2020), not enough to address the pandemic's negative impact on the crucial sectors.
The careful assessment of packages highlights that the government has adopted a ‘fiscal conservatism’
rather than an expansionary fiscal policy (Ghosh, 2020). Given the V-shape recovery of the economy
in the second quarter of FY 2020-21, measures could focus on building a resilient economy for the
future.
3.1 Measures for migrants: Relief and rehabilitation
Apart from the stimulus package, the central government also provided shelter and food to the
distressed and stranded migrant workers during the initial period of the nationwide lockdown.
According to the Central Government's Status Report to the Supreme Court in the first week of April,
around 0.63 million persons were provided shelter by the various state governments. Over 0.4 million
were provided shelter by Non-Governmental Organisations (NGOs). The centre and state
governments/UTs provided food to 5.4 million migrant workers while NGOs were feeding around 3.0
million. About 1.5 million stranded migrant workers were given shelter by their employers/industry.
On May 1, 2020, the Centre permitted the inter-state movement of migrant labours and stranded
persons by special trains, Shramik Special Train services. Till June 12, 2020, Indian railways had run
about 4277 Shramik Special trains carrying over 6 million passengers. The percentage share of Shramik
Special trains across destination and originating states has been shown in Appendix A7.
According to the Status Report filed by the Solicitor General to the Supreme Court on May 28, 2020,
the estimate of reverse migration was around 9.7 million, including 5 million transported by Shramik
trains and 4.1 million through inter-state bus transport. About 0.5-0.6 million migrants had gone
barefoot to their native villages as per the GoI’s March 31st Status Report submitted to the Supreme
Court. Later in September 2020, the government's revised reverse migration estimates suggested that
10.4 million migrant workers had returned (see Figure 9). However, these reverse migration figures
are much lower than the estimates provided by Chinmay Tumbe and Amitabh Kundu. Their estimates
of reverse migration since mid-March stood at 30 million and 12 million, respectively (Chishti, 2020).
9
Due to dearth of data on the magnitude of migrants/stranded migrants, “a liberal estimate of about 80 million such persons
were made by the Department of food and public distribution (10% of approx. 800 million NFSA population) a liberal
allocation of 8 LMT food-grains (Rice/Wheat) for two months – May and June 2020 was made to States/UTs to cover
maximum of migrants/stranded migrant persons under the scheme” (GoI, 2020b).
19You can also read