The US Auto Supply Chain at a Crossroads - Implications of an Industry in Transformation
←
→
Page content transcription
If your browser does not render page correctly, please read the page content below
The US Auto Supply
          Chain at a Crossroads
                Implications of an Industry in
                              Transformation

                                           Susan Helper
      with Kyoung Won Park, Jennifer Kuan, Timothy Krueger,
Alex Warofka, Joy Zhu, William Eisenmenger, and Brian Peshek
This project is a part of Driving Change,
a research consortium of the Indiana, Michigan, and Ohio Labor Market
Information offices and their strategic partners.
For more information on the Driving Change Project, visit
drivingworkforcechange.org
For more information on this study, contact
susan.helper@case.edu
This workforce solution was funded by a grant awarded by the U.S. Department of Labor’s Employment and Training Administration. The solution was created by the grantee and does not
necessarily reflect the official position of the U.S. Department of Labor. The Department of Labor makes no guarantees, warranties, or assurances of any kind, express or implied, with respect to
such information, including any information on linked sites and including, but not limited to, accuracy of the information or its completeness, timeliness, usefulness, adequacy, continued availability,
or ownership. This solution is copyrighted by the institution that created it. Internal use by an organization and/or personal use by an individual for non-commercial purposes is permissible. All other
uses require the prior authorization of the copyright owner.contents
Executive Summary 4
I. Introduction 6
1.1. Purpose of the Study and Summary of Findings 6
II. Industry Snapshot 8
2.1. Employment Trends from Public Data 11
2.2. About our Survey Respondents 11
2.3. Trends in Industry Structure 13
III. Long-term Firm Strategies: How Product, Operations, and Human-Resource Policies Interact 15
IV. Response to 2008-2009 Crisis 20
4.1. Production Response 20
4.2. Employment Response 21
4.3. Financial Response 21
4.4. Investment Response 21
4.5. Attitude Toward Crisis 22
V. Skill Availability and Human Resource Practices 24
5.1. Skilled Trades and Technicians 24
5.2. Production Workers 26
5.3. Engineering Skill 29
5.4. Managerial Skill 30
5.5. Progressive HR Practices 31
VI. Innovation, Investment and Transition to a Green Economy 32
6.1. Product Innovation 32
6.2. Process Improvement 33
6.3. Information Technology 39
6.4. Energy Efficiency 41
6.5. Environmentally Friendly Products 41
VII. Customer Relations 43
7.1. Collaboration With Customers 43
7.2. Lower Tier Customer Relations 44
7.3. Diversification 46
VIII. Location of Suppliers 48
IX. Conclusions and Policy Recommendations 50
9.1. Sources of Perceived Skill Shortage 52
9.2. Strategic Management Training Programs 52
9.3. Work-sharing 53
9.4. Access to Credit 54
Appendix A: Methodology 55
Appendix B: Employment and Establishments by NAICS 57
Appendix C: Wages by NAICS 60
Appendix D: Bankrupt Firm Case Studies 63
Acknowledgments 64
3executive summary
The automotive industry has played a critical role in the expansion of America’s middle class for nearly a century. Yet the
industry has suffered great losses in recent decades and was deeply affected by the recession of 2008-9, which saw auto
sales fall by 40%, and two of the Detroit 3 automakers enter bankruptcy. To more effectively serve the large numbers of
dislocated auto industry workers and to better understand and mitigate the negative repercussions of these trends, the
Labor Market Information Offices of Indiana, Michigan and Ohio formed the Driving Change consortium.1 This report
details the findings of the National Survey of Automotive Suppliers, conducted by researchers at Case Western Reserve
University as part of the Driving Change consortium.
Researchers at Case Western Reserve University investigated the automotive supply chain by reviewing past studies of
the topic, interviewing suppliers and conducting a nationwide survey. We believe our study makes several contributions.
First, existing studies of the auto industry focus on auto makers, or ‘OEMs’, and their direct suppliers, or ‘tier 1 suppliers’.
These firms are almost all very large, with tens of thousands of employees. In contrast, our study focused on smaller firms
(those with fewer than 500 employees). These firms typically do not supply automakers directly; that is, they are usually
"tier two" or "tier three" suppliers. These smaller firms account for 30% of employment in the auto supply chain, but are
under-studied because they are difficult to identify as auto suppliers in existing data. In contrast, by combining multiple
databases we have been able to construct a truer picture of the industry.
Second, our survey instrument is unusual in that it aims to capture a multi-faceted view of each firm. We chose this
approach due to our belief that human resource policy both affects and is affected by the product and operations
strategy of the firm; the causes and effects of workforce policies cannot be studied in isolation from other aspects of the
firm. We believe the resulting survey data and insights from field interviews inform a more textured understanding of the
situation facing supply chain firms. This information can be used by policy makers to understand specific challenges that
firms face—such as regional shortages of skilled tradespeople—but in aggregate also reveals industry-wide norms and
collective action dilemmas that illuminate why such challenges continue to exist.
Throughout our research, we find evidence of two possible futures for America’s automotive industry. One future is
characterized by collaborative relationships between firms at all tiers of the supply chain, wherein firms share cost savings
from identifying and eradicating inefficiencies that they might not have been able to address on their own. In this
scenario, firms will be more likely to collaborate when designing parts that will eventually end up in the same vehicle,
resulting in products that can sell for better prices.
On the other path, fickle relationships and fear of investment will prevent progress at each tier. In this future, instead of
developing better products, working with suppliers and customers to solve trans-tier problems and thinking critically
about how to remove inefficiencies from processes that span multiple firms, each level of the supply chain generates
profits by squeezing margins of the tier under them. This path is a recipe for industry-wide stagnation and declining
relevance.
Our study finds that large segments of the automotive supply chain are characterized by each of these two scenarios,
demonstrating certain elements of both. There is some evidence that relationships are becoming more collaborative, as
many firms report that their main customers are more likely now to work with them to reduce costs than they were in
2007 before the recession. One large first tier supplier described how the recession made them realize the importance of
1 The Consortium was led by the Labor Market Information Offices of Indiana, Michigan and Ohio (Indiana’s Department of Workforce Development –
Research & Analysis (Managing Partner); Michigan’s Department of Technology, Management, and Budget – Bureau of Labor Market Information and Strategic
Initiatives; and Ohio’s Department of Jobs and Family Services – Labor Market Information Bureau). in collaboration with research institutions in each state: the
Center for Automotive Research (Michigan), Case Western Reserve University (Ohio) and the Indiana Business Research Center at Indiana University's Kelley
School of Business. The research was generously funded by an American Recovery and Reinvestment Act grant through the Department of Labor's Employment
and Training Administration. For more information on the other studies undertaken by this project, please see http://drivingworkforcechange.org/.
4keeping their own suppliers in better financial condition and reports that they now take more interest in the health of their
suppliers and try to let many of them capture more profits. Yet other evidence suggests that some parts of the supply
chain are focusing more on short-term cost-cutting, as recession-induced investment phobias run wild throughout large
parts of the supply chain and many first tier firms continue to protect their profit margins by cutting the margins of their
suppliers, rather than by trying to build positive-sum relationships. One representative of a first tier supplier, when asked
about the relative importance of building long term relationships with lower tier suppliers, responded that “At [this
company], everything is short term. Today is everything. That mentality drives the behavior: Get it now, and don’t worry
about the out years... Focus on today; worry about tomorrow tomorrow.”
Inside the supplier firm, we find that certain practices are frequently adopted together. One such grouping is “ high road”
practices, which includes high wages, worker training and investment, and empowerment at all job levels. Among firms
that engage in high-volume production (about 93 percent of the industry), firms that exhibit the above characteristics
experienced 10.9 percent less sales loss during the crisis than the group of firms that least exhibits these “high road”
characteristics. We identified two forms of such “high road” strategies: those that are “distinctive” and those that are
“systematic.” Distinctive firms develop novel products that are hard to imitate, whereas systematic production focuses on
data collection to identify and eliminate sources of waste. Our cluster analysis finds that while combining these strategies
is particularly effective, firms usually do not use both.
Despite evidence that these strategies (adopted separately or together) are correlated with improved performance, we
find that many employers do not pursue such strategies. We find preliminary support for two main reasons why:
1) Customer purchasing strategies in many cases do not allow suppliers the financial or organizational resources
they would need to implement such practices, and
2) Public policies do not do enough to “pave the high road” (which has benefits that spill over to workers and
communities) and block the low road (which has costs that spill over to others).
We explored the possibility that these policies are not applicable to all firms; that they pay off only in certain industries or
with certain managers and all firms who would profit from the policies have already adopted them. Clearly some policies
work better in some cases than in others, but we doubt that this is the whole story. Our visits over several years to the
same firms before and after their adoption of such policies showed real performance improvement with the same
personnel. This view is consistent with a variety of other studies as well.
We also found that firms demonstrated different responses to the recent manufacturing crisis; we believe these different
responses will continue to affect firm competitiveness for years to come. About two-thirds of firms surveyed chose to
postpone investment in equipment, but those who continued to invest are faring better in the wake of the recession.
Firms that demonstrate commitment to process improvement techniques like quality circles and preventative
maintenance also fared better during the recession, posting modest sales growth on average while firms that did not
engage in these two practices reported significant sales losses. Firms in Michigan, Indiana and Ohio are significantly more
likely to have quality circles compared to firms in the other 47 states.
Michigan, Indiana and Ohio firms in our sample also differentiate themselves from the rest of the country by paying
average wages in production facilities about 10% higher than firms in other states. This is likely attributable to an array of
factors, but we specifically find that workers in these three states are more likely to belong to a union (unionization rates
at sample firms in these three states are 3.5 times higher than rates among the rest of our sample) and about 6 percent
more likely to have graduated from high school. In addition, Michigan (and to some extent Ohio) has far more R&D and
technical center workers than do other states. We believe this bodes well for these three states, as firms that pay higher
wages for better skills and more well-educated workforces will have the best chances of remaining competitive in the 21st
century.
5introduction
The automotive industry has played a critical role in the expansion of America’s middle class for nearly a century.
Automotive manufacturing firms have been drivers of innovation, bastions of engineering skill and places where workers
could develop valuable skills over time. According to our analysis of data from the Quarterly Census of Employment and
Wages (see Section II below), the automotive parts industry is currently comprised of over 13,000 establishments in at
least 46 states, employing more than 750,000 workers. Yet the industry has suffered great losses in recent decades and
was deeply affected by the onset of the recession in 2008. When large automakers such as Ford, General Motors and
Chrysler cut production in late 2008, work shortages rippled through the network of manufacturing suppliers that
accounts for about 70 percent of auto industry employment. The combined effects of the financial crisis and decades of
auto-industry globalization have transformed the automotive industry in ways that are not yet fully understood by either
policymakers or industry insiders.
Funded by an American Recovery and Reinvestment Act grant through the Department of Labor's Employment and
Training Administration, researchers in Michigan, Indiana and Ohio conducted a detailed study of the automotive
industry's transformation. Teams of researchers studied the greening of the automotive industry, career pathways for
dislocated workers and the supply chain. Specific areas of focus included workforce skills, supply chain relations, firm
health, technology, supplier diversification into other manufacturing industries and many other topics. This report details
the findings of the National Survey of Automotive Suppliers, conducted by researchers at Case Western Reserve
University.
Between July 2010 and June 2011, the CWRU Automotive Supply Research Group used a comprehensive three-phase
process to study the US automotive supply chain. For this report, we focused our analysis on firms with fewer than 500
employees. These are the firms that researchers know the least about, but together they account for about 30% of all
automotive employment, more than the automakers themselves. These firms are under-studied because they are difficult
to identify as auto suppliers in existing data, such as the Census of Manufacturers.
This report is structured as follows. The rest of Section I outlines the main questions we have sought to answer. Section II
draws on both publicly available data and our survey data to describe trends that have shaped the automotive parts
industry in recent decades, including trends in employment and in industry structure. Section III reports the results of our
cluster analysis and describes the nature of the four groups of practices commonly used in the automotive supply chain.
Section IV describes our survey data on how firms responded to the recent manufacturing crisis with changes to
production, investment, employment and finance and discusses preliminary observations about the continuing effects of
these various responses. Section V catalogues findings about human resources practices and skills availability for different
job categories. Section VI includes findings on innovation and investment, including investments in process improvement,
energy efficiency and transition to manufacturing greener products. Section VII discusses customer relations, including
differences in supply chain relationships between the upper and lower tiers of the automotive supply chain, as well as
firms’ efforts to diversify to non-automotive customers. Section VIII explores changes in the extent to which firms source
their inputs locally. Section IX includes general analysis of our findings and their policy implications.
1.1. Purpose of the Study and Summary of Findings
Three major questions have driven this study. First, we seek to understand how the automotive supply chain has been
transformed both by long-term economic forces and the recent manufacturing crisis. Next, we investigate the various
paths to survival and profitability that different firms have pursued, and their implications for workers. Finally, we seek to
understand how government, industry leaders, unions, workforce development professionals, trade associations and other
relevant actors can most effectively strengthen the US manufacturing base.
6The long-term economic forces that have driven the automotive industry’s transformation include technology, decisions
to globalize and off-shore many elements of production, the rise of competition from automakers based in Europe and
Asia. While some individual firms have done well, overall these changes have gradually eroded America’s base of good
manufacturing jobs and the skilled workers who fill them. Collectively, many of these long-term changes can therefore be
described as a slow, simmering crisis. Conversely, the financial crisis of 2008 bred immediate consequences for US
manufacturing. A 40% decline in auto sales in late 2008 sent painful ripple effects through much of the automotive
supply chain.
In order to answer the second question about survival strategies and implications for workers, we collected data on firms’
approaches to their product markets and operations, as well as their human-resource policies. Our view is that HR policies
and outcomes both constrain and and are constrained by the skills and incentives of workers. Our study finds that firms
have charted out four basic paths to success. Based on our interviews and on cluster analysis of our survey data, we find
that firms generally can be categorized into one of four groups:
1. “Engineering-intensive” firms that employ high percentages of engineers and profit from a focus on R&D work
and/or non-repetitive processes such as machine-building;
2. “Craft skill” firms that pay competitive wages for highly-skilled workers, often participate in the tooling industry,
and demonstrate below-average rates of formal process improvement initiatives;
3. “Clever cost-cutter” firms that pay lower wages for high percentages of low- or semi-skilled labor, are likely to
avoid investment in workers and equipment, and often describe practical or creative solutions that help them
avoid spending money; and finally
4. “Kaizen”2 firms that pay moderate wages and are most likely to pursue Toyota-style management philosophies
with the goals of flexible production, participation in various markets, inclusion of all workers in firm strategy, and
institutionalization of continuous improvement practices.
This report describes these findings in greater detail in section III.
Finally, as noted above, this study aims to understand how individuals, companies and agencies can address the problems
our study highlights in ways that produce good outcomes for firms, employees and the US manufacturing industry. This
report discusses policy recommendations in the final section.
2 “Kaizen” is a Japanese word meaning “continuous improvement,” a term commonly used in these firms.
7industry snapshot
Before 1980, the Detroit Three automakers (Ford, GM, and Chrysler)—who at the time accounted for 90% of the
nation’s auto sales—produced and designed many of their own parts in-house. Since that time, they have shifted much of
this work to supply chains of financially independent firms that now design and produce about 70% of the industry’s parts.
The major automakers share these supply chains, creating a “free-rider” situation in which automakers lack the incentives
to invest adequately in their supply bases. That is, if an automaker helps its supplier develop a new technology, the
supplier’s other customers—typically the first automaker’s rivals—will enjoy the same improvements without having
contributed. As a result, automakers and large suppliers don’t have an incentive to make such investments. Rather, they
shift costs down the supply chain to weaker suppliers. These practices improve the larger firms’ financial performance in
the short run, but in the longer run rob the entire supply chain of incentives to invest. Automakers in other countries such
as Japan and Germany have avoided this collective problem by developing institutions that govern supply chains. 3
US auto suppliers have experienced a reduction in both the number of plants (“establishments”) and in total employment.
Figure 1 shows the overall trend from Q1 2001 through Q3 2010 for plants and employment in industry classifications
commonly associated with automotive parts manufacturing.4 The clear downward trend in establishments started at least
a decade ago, and continued steadily through the financial crisis. At the same time, employment dropped sharply when
the crisis hit and is only slowly beginning to recover near the end of the period for which data is available.
Figure 1: Employment and establishments in industries associated with automotive parts manufacturing
Source: Quarterly Census of Employment and Wages
To more closely examine the effects of the crisis on Michigan, Indiana and Ohio, we compare trends in employment and
establishments between the tri-state region and other states. As illustrated in Figure 2, we observe a general shift away
from concentration in the tri-state area; the region contained 41 percent of total US auto parts employment in 2001, but
its share had fallen to just 34 percent in 2009. Between 2001 and 2009, employment fell by more than half in the tri-state
region, but by just 34 percent in the other 47 states. This trend was reinforced by the crisis, with a 33.6 percent reduction
in employment within Michigan, Indiana and Ohio but only a 22.9 percent decrease in other regions.
3 See Susan Helper, Challenge and opportunity in the US auto industry: the key role of suppliers. Journal of Industrial and Business Economics, 2, 2011, 51-68. For
a more popular treatment, see http://www.thedailybeast.com/articles/2009/06/07/can-price-hikes-save-gm.html.
4 Data reported in Figure 1 is derived from the Quarterly Census of Employment and Wages and based upon the following NAICS classifications: 3363 (motor
vehicle parts manufacturing), 336211 (motor vehicle body manufacturing), 326220 (rubber and plastics hose and belting manufacturing) and 326199 (all other
plastics product manufacturing). A 2010 publication by the Center for Automotive Research, “Contribution of the Automotive Industry to the Economies of All
Fifty States and the United States,” helped us determine the NAICS codes most likely to contain establishments that supply the auto industry.
8Figure 2: Automotive parts industry employment trends in the tri-state region versus other regions
Source: Quarterly Census of Employment and Wages
Between 2007 and 2009, the number of establishments in these three states fell 3.8 percent, compared with 1.7 percent in
other regions. Furthermore, Michigan, Indiana and Ohio were home to only 23 percent of all establishments in 2001 and
22 percent in 2009, suggesting that establishments in these states were generally larger and thus better able to survive
employment shocks through workforce reduction. Appendix B presents detailed descriptions of employment and
establishments by NAICS classification.
Figure 3: Automotive parts industry establishment trends in the tri-state region versus other regions
Source: Quarterly Census of Employment and Wages
In contrast to the continuous downward trend evident in both employment and establishments, mean annual pay per
employee actually increased moderately at the beginning of the decade before beginning to fall from 2003 onward.
Changes in wages were more pronounced in the tri-state region than in other states; during the crisis, for instance, wages
in Michigan, Indiana and Ohio declined by an average of 6.1 percent but fell by just 0.4 percent in other states.
Firms in the tri-state region pay significantly higher wages than in other states. We believe that this is driven primarily by
the comparatively high density of skilled workers participating in the motor vehicle parts manufacturing (NACIS 3363)
9industry in Michigan; the greater prevalence of unionized establishments in the tri-state area is an additional factor. The
extent of this wage differential by NAICS is explored in Appendix C. The reasons for the wage differential are explored
in section 3.
Figure 4: Mean annual pay per employee in industries associated with automotive manufacturing
Source: Quarterly Census of Employment and Wages
Table 1 presents our employment projections for the four principal segments of the US auto supply chain in 2018. In
aggregate, we project that nationwide auto supplier employment in 2018 will fall to 13.6 percent below 2008 levels; in
Michigan, Indiana and Ohio, employment will decline by 13.5 percent, 14 percent and 25.3 percent, respectively.5
Table 1: Employment Projection 2008-2018
Motor vehicle parts Motor vehicle body Rubber and plastics All other plastics
manufacturing manufacturing hose and belting product
(3363) (336211) manufacturing manufacturing
(326220) (326199)
National 2008 541.1 61.5 26 298.8
Employment Employment
Change (%) -18.6% -7.8% -15.5% -5.7%
Projected 2018 440.5 56.7 22 281.8
Michigan 2008 110.8 6.5 1.3 21
Employment
Change (%) -15.3% -8% -6.4% -6.4%
Projected 2018 93.8 6 1.2 19.7
Indiana 2008 59.4 4.4 0.6 19.4
Employment
Change (%) -18.6% -7.8% -15.5% -5.7%
Projected 2018 48.4 4.1 0.5 18.3
Ohio 2008 72.3 3.9 3.8 21.0
Employment
5 Table 1 projections are based upon Bureau of Labor Statistics 2008-2018 industry employment projections combined with state-level data. Because BLS data is
available only at the level of four-digit NAICS codes, we extend these broader projections to six-digit NACIS classifications when applicable. 2008 QCEW
employment data is used for base year figures. Available Michigan data did not include 2008-2018 projections for NAICS classifications 3363 and 336211, so
2006-2016 projections were used to compute an implied percentage change for 2018. Additionally, Michigan projections do not differentiate between NAICS
3261 and 3262, so the same percentage change was used in calculating projections for both industries. Finally, because 2008 Ohio employment figures for NAICS
326199 are unavailable in the QCEW, we use 2009 employment figures as a proxy. State level data for Michigan was retrieved from http://bit.ly/jMoj0C; for
Indiana from http://bit.ly/knUaS2; and for Ohio from http://bit.ly/iZOCw9.
10Change (%) -28.9% -24.3% -24.7% -14%
Projected 2018 51.4 3 2.9 18.1
Source: Quarterly Census of Employment and Wages
2.1. Employment trends among survey respondents6
The experience of our survey respondents reflects this overall trend, as re-hiring has been careful and conservative during
the economic recovery. Although many firms saw sales begin to recover in 2010, employers appear to be concerned
about the strength of the rebound and hesitate to re-hire for many recently eliminated positions. For example, our survey
shows that about 70 percent of plant managers expect an increase in sales of more than 5 percent in the next 12 months,
yet less than half (45.9 percent) expect an increase in employment of equivalent magnitude. Figure 5 shows graphically
how hiring lags sales.
Figure 5: Expected sales growth and planned hiring over the next 12 months
2.2. About our Sampling Frame and Survey Respondents
A problem that has plagued research on the auto supply chain is that publicly available data does not provide a good
picture of which establishments are currently in the auto supply chain. As we discuss below (and more thoroughly in
Appendix A), many firms that supply the auto industry are not found in NAICS 3363 (auto parts) or the 3 related NAICS
we looked at above. Conversely, many firms than are in NAICS 3363 no longer supply the auto industry. (Managers of
establishments are responsible for classifying themselves into NAICS codes, and typically do not update these codes very
often.)
Thus, in order to survey the automotive supply chain, we first had to do a great deal of work to determine which firms we
should survey. As Appendix A describes, we first assembled a list of candidate firms and establishments from a variety of
sources. We then called each of these, and asked if they currently supplied the auto industry. We defined the supply chain
to include not just establishments producing parts (e.g. steering wheels or fuel injectors), but also establishments that
produce equipment (production machines, tools, and dies). In addition, we had access to a directory of establishments
performing automotive R&D in Michigan, so we included those firms as well. Both equipment producers and R&D
establishments have higher skill and pay higher wages; we thought it particularly important to include these in a study of
the future skill needs of the auto supply chain. Importantly, establishments performing R&D are classified in a separate
NAICS code, even if the output is used primarily by the auto industry. A conservative count of establishments in the
Michigan Automotive R&D directory yields are 25,000 employees of suppliers performing automotive R&D in this state
6 See section 2.2 for more information on the population of survey respondents.
11alone. 7 Thus, traditional (NAICS-based) analyses of the auto supply chain significantly understate the employment,
wages, and skill level of automotive production.
Table 2 gives the proportion of our sampling frame in each NAICS. Note that NAICS 3363 (“Motor vehicle parts
manufacturing”) accounts for only 37 % of the sample. In addition, a significant proportion (more than half ) of
establishments that listed themselves as being in NAICS 3363 said when called that they no longer supplied the auto
industry.
Table 2: Proportion of sample frame by NAICS
NAICS Percent
Motor vehicle parts manufacturing (3363) 37.1%
Special die and tool, die set, jig, and fixture manufacturing (333514) 14.3%
All other plastics product manufacturing (326199) 12.8%
Metal stamping (332116) 1.4%
Machine shops (332710) 1.1%
Rubber and plastics hose and belting manufacturing (326220) 0.9%
Motor vehicle body manufacturing (336211) 0.2%
Other industries 32.3%
Total 100.0%
To assess how our sample of respondents represents the universe of all plants in the auto supply chain, we map
geographical locations of all plants (green) and respondent plants (red) on Map 1, below. The greatest concentration of
auto supply chain firms is in Michigan, Ohio and Indiana; similarly, nearly two-thirds of our respondents are from this tri-
state region.
Map 1: Location of automotive suppliers and survey respondents
7 This figure does not include employees at technical centers owned by automakers.
12While our survey was distributed to all the firms that we identified in the automotive supply chain, the rest of this report
focuses in particular on small suppliers. Much attention has been paid to mega-suppliers such as Visteon, Delphi, Magna,
Lear, and Johnson Controls. These firms have many many billions of dollars in annual sales. Almost all of these sales
come from direct dealings with automakers. Thus, these firms are “first-tier” suppliers, who purchase from “second-tier”
suppliers who in turn purchase from “third-tier” suppliers. We estimate (based on our sampling frame as described in
Appendix A) that about 30 percent of the automotive supply chain consists of firms with fewer than 500 employees.
Most of these smaller firms do not supply
directly to automakers; Tier-1 suppliers (those Figure 6: Survey respondents by number of employees
who do directly supply automakers) comprise
just under 25 percent of our sample. Because
relatively little is known by researchers and
policy makers about these smaller firms, we
targeted small and medium sized firms for our
interviews. In addition, we interviewed
purchasing managers at 7 very large tier-1
suppliers, in conjunction with Bernard Swiecki of
the Center for Automotive Research.
On average, firms surveyed were founded 32
years ago. Figure 6 shows the distribution of
respondents’ plant sizes; on average, these
plants had about 100 regular and 12 temporary
employees, though the range of workforce size
was between 1 and 1,480. Only 7.8 percent of
the sample is unionized.
During the 2008-2009 crisis, most of the firms in our sample cut their workforces; 41.6 percent reduced employment
more than 20 percent and another 13.4 percent cut between 0 and 20 percent. For workers, the impact of such layoffs can
be substantial depending on their ability to find new employment. Most workers at firms surveyed (90 percent) have at
least a high school education and are middle-aged
(average 40.4 years old). Figure 7: Number of competitors and potential competitors in 2007 vs. 2011
Among firms providing information on the number
of plants they operate, nearly two-thirds (65.7
percent) indicated that they had only a single
facility. About half of the firms surveyed (51.6
percent) are family-owned and 20.8 percent are also
family-run. Private equity groups control 14.6
percent of responding firms, while just 5.2 percent
are publicly traded.
Most firms do not depend on the auto industry as
their main source of business. Almost 30 percent of
firms do less than 10 percent of their business in the
automotive industry, while less than half rely on the
auto industry for more than two-thirds of their
sales.8
8 Because sales of autos fell so much more sharply than did sales in other industries, this degree of auto dependence is significantly less than it was in 2007.
132.2. Trends in industry structure
The decline in establishments over the past decade has also resulted in greater concentration within the auto supply
chain. This trend was not entirely offset by a rise in global competition; our survey respondents reported a decline in the
number of competitors between 2007 and 2011. We asked firms about the number of competitors also supplying their
key product to the same customer as well as the number of firms potentially able to supply a similar product without
major investment. Figure 7 shows a reduction over the period 2007 to 2011 from 8.2 current competitors to 6.3 and from
13.5 potential competitors to 11.8. Consolidation has benefited the remaining firms in the market, as we might expect,
with many firms reporting better customer relations (discussed later in this report). Their customers, on the other hand,
are mixed in their reaction to consolidation. In interviews with tier-1 suppliers, some express concern about higher prices
set by the few firms left.9 On the other hand, other firms feel that healthy suppliers are important to their own long-term
health.10
9 Firms 24 and 25
10 Firms 23 and 26
14long-term firm strategies
how product, operations, and human resource policies interact
To analyze the strategies of firms in our sample, we employed the technique of cluster analysis. Cluster analysis is a
systematic approach to identifying groups of similar observations; the goal of the analysis is to construct groups with
minimal variation in practices within the group and maximal variation between the groups.11 Using information on firms’
operational and human resource management strategies, we discern four groups of firms. Table 3 presents components
used for and the final clusters from cluster analysis.
We characterize the first group of firms as “engineering-intensive.” These firms employ a large number of engineers and a
lower number of skilled trades workers. They are typically R&D facilities or machine builders, performing engineering-
intensive non-repetitive tasks. These firms pay higher wages than firms in the other groups because of the level of skill
employed. These firms are also more likely than average to implement quality circles12, as well as have a greater degree of
formal training in continuous improvement. Interestingly, the number of suggestions per employee is relatively small at
these firms.
Engineering-intensive firms also engage in somewhat more thorough employee selection compared with other firms.
That is, they report that they screen new employees a bit more than average to ensure that they have knowledge of
specific equipment, fit with firm culture and overall aptitude. Conversely, these firms do not tend to develop a system of
succession planning or career counselling that facilitates employees advancing internally, perhaps because engineers
expect to advance by moving to a new company.
We characterize the second group of firms (about 30% of our respondents) as “craft skill.” These firms have the largest
proportion of skilled trades workers. Many of these firms make tooling; these are complex implements that form a
product in a press. Many of these shops are quite versatile; they can make tools that allow automakers to produce both a
door panel (a large part whose surface is seen by customers) and a bracket (a small part that customers may never see,
making surface finish not so important). Despite their level of skill, these firms engage less than average in most formal
improvement activities (such as quality circles and training in improvement methods). These firms do a bit more
promoting from within than average.
To use the typology of Luria and Wiarda13 these firms are “distinctive” in their capabilities --they can make products and
use materials that are hard for others to imitate. However, they are not “systematic”; they typically don’t have structures in
place that allow them to methodically identify weaknesses and improve them.
One of our interviewees exemplifies the craft skill firm.14 A tooling company with broad capability, it nonetheless faces
intense competition from China (which provides large subsidies to the tooling industry). To compete with off-shore
locations, this firm is focusing on enhancing its already-impressive expertise in computer-aided design and in producing
tools that can yield high-quality parts from newer, lightweight materials whose properties remain something of a black art.
The firm is also beginning to improve its scheduling capability to reduce lead times (currently it does not always deliver
products more quickly than its Chinese rivals).
11 Specifically, we used the k-means clustering technique, aiming to partition our survey respondents into k clusters, in which each respondent is assigned to the
cluster with the nearest mean. The k-means clustering technique produced four clusters as the best solution (i.e, the value of k that produced the highest Calinski/
Harabasz pseudo-F value (182.6). Therefore, our discussion is based on this four-cluster solution.
12 Quality circles are cross-functional groups of employees that meet regularly to discuss process improvement. These are discussed more fully in section 6.2, on
process improvement.
13 Daniel Luria and Edith Wiarda, “Performance benchmarking and measuring program impacts on customers,” Research Policy, 1996, 25, 233-46.
14 Firm 29
15At the opposite end of the spectrum, the operations of low-road firms or “clever cost cutters,” are primarily driven by low-
wage, semi-skilled workers; the proportion of skilled workers and engineers is much lower than average. Though many
employees of clever cost-cutting firms also received some formal continuous improvement training, they participated in
quality circles and autonomous team meetings at a much lower rate and produced a much lower number of suggestions
for improvement. Indeed, across all human resources indicators, cost cutter firms consistently performed the worst (see
Table 3, below). About a quarter of our respondents fall into this category.
While clever cost-cutters make cuts to the workforce and forgo equipment investment, as cost cutting implies, they also
apply practical knowledge to innovate in small yet lucrative ways. One of our interviewees15 developed manufacturing
processes using existing equipment to win new business that their customer had previously sourced in China. They
produced higher quality than their Chinese competitor and offered better delivery terms as a result of their closer
proximity to the customer. In a separate example, the firm’s mechanics also cobbled together a new machine out of two
old ones and won business in consumer products and health care markets.
Another firm16 employs low-skill workers from a local high school and has a plant characterized by medieval-looking open
boiling vats. However, it has the country’s largest-capacity vessel for applying metal protectant, allowing it to serve
geographically diverse customers. Other cost-efficient practices include a process for monitoring and maintaining
chemical levels using custom real-time adjustments rather than pre-packaged mixes. This firm also makes custom fixtures
to maximize throughput and manages subcontractors for its clients to reduce delivery times.
These cost cutter firms tended to survive the crisis by trimming costs rather than transforming their operations. Indeed,
one interviewed firm17 detailed a process they had themselves dubbed “clever cost-cutting”—reducing fixed costs, finding
ways to substitute stamped parts for cast parts and capitalizing on low labor costs through decreased automation. While
such models allowed firms to survive, the unintended consequences of these cost reduction strategies include increased
vulnerability to low-wage overseas labor and limited future investment and growth.
Finally, 37 percent of our respondents fell into what we term a “Kaizen” model, named after the Japanese approach to
management in which employees at all levels are involved in continuous improvement efforts. If the model is
implemented fully, decisions are made for the long-term rather than immediate-term and firms enjoy such positive
outcomes as agility to implement new products and processes quickly, and ability to influence the firm’s future direction.
Workers benefit through access to more robust skill sets, better wages and improved job security.
Kaizen firms’ employees tend to be more actively engaged in quality circles than average, receive formal training in
continuous improvement and greater number of suggestions for improvement. Thus this group acts in a way most
consistent with a Toyota-style approach, though even this group’s level of adoption of such policies remains shockingly
low, as we discuss in section 6.2.
One of our interviewees18 is a sheet-metal stamping firm whose main customer is a Japanese-owned firm that helped the
firm implement Kaizen systems, invest in information technology and install sensors to help manage inventory and
manufacturing processes. To survive the crisis, this firm made the deep cuts in personnel that many other firms made, but
also had a healthy cash position going into the crisis, built up over the years of profitability. This firm is a model of
systematic practice as defined above. It is not as distinctive as the “craft” firms; it does not design its own products or use
exotic materials; many firms can make the products it makes, though not with the price or defect rates that the firm’s
systems allow it to provide.
15 Firm 18
16 Firm 5
17 Firm 18
18 Firm 1
16Table 3: Human resources cluster analysis19
Engineering-intensive Craft Kaizen Cost cutter
Components Total
(7%) (31%) (37%) (25.2%)
% of skilled workers 6.5% 42.2% 19.9% 5.4% 22.1%
% of engineers 43.8% 9.6% 4.9% 2.5% 8.5%
Weighted wage ($) 32.5 20.6 15.3 11.0 17.0
Number of suggestions per
0.5 0.8 0.6 0.4 0.6
employee
% of employees who attended quality
circle/autonomous team meetings in 27.8% 18.7% 25.1% 13.3% 20.4%
the last six months
% of employees who have received
some formal training in continuous 28.2% 25.0% 26.1% 25.1% 25.7%
improvement
Succession planning 2.8 3.4 3.0 2.4 3.0
Promotion-from-within 2.9 3.5 3.4 2.6 3.2
Employee selection 3.7 3.5 3.9 3.3 3.6
Our cluster analysis suggests that there are several successful operations and human resources strategies that firms can
adopt to survive. We are also interested in the implications of these strategies for firms’ financial and workforce
performance. As indicators, we consider sales growth between 2007 and 2010 and absenteeism and turnover rates,
respectively; figures 8 and 9, below, report these results.
We reliably find that clusters paying higher wages and having the most highly-trained workers fared the best. That is,
engineering intensive firms do best, followed in order by craft, kaizen, and cost-cutter firms. This finding is consistent with
the view that firms can prosper by adopting a high-road production recipe in which firms, their employees and suppliers
work together to generate high productivity. The key to the success of a high-road recipe is to harness everyone’s
knowledge—from production workers to top executives—to produce high-quality innovative products. Even low-level
workers, have much to contribute because they are close to the process: They interact with a particular machine all day, or
they observe directly what frustrates consumers. Through coordination with highly skilled workers and suppliers, firms
achieve high rates of innovation, quality, and fast response to unexpected situations. The resulting high productivity
allows firms to pay fair wages to workers and fair prices to suppliers while still making fair profits.
A high-road recipe is consistent with systematic and/or distinctive operations. As mentioned above, Toyota’s production
system calls for workers to be engaged in problem-solving.20 The high level of education and training found in the
“engineering” and “craft” clusters helps workers be creative in a way that enhances both firm productivity and worker
ability to bargain for a share of the pie they helped create. It is possible to combine both systematic operations and
distinctiveness, though few firms did.21
19 To measure succession planning, we asked firms to indicate their level of agreement with the statement: "We do succession planning to make sure we will have
enough trained workers for each occupation over the next several years." Similarly, to measure internal promotion, we asked survey respondents to indicate their
level of agreement with the statement: "We frequently provide advice to individual employees about how they could advance within our company." Both
questions are coded on a 1-5 scale, with 1 indicating "Strongly Disagree" and 5 indicating "Strongly Agree." Employee selection is measured by the mean value of
screening intensity indicated by respondents for "knowledge of specific equipment," "fit with our culture" and "overall aptitude," with 1 indicating a firm that
"screens significantly less intensively than average" and 5 indicating a firm that "screens significantly more intensively than average."
20 Though as we discuss in section 6.2, some firms use some of the tools and much of the language (e.g. “lean production”) in a way that does not empower
workers.
21 Kristin Dziczek and Jay Baron outline a way that automakers and tool shops could work together to create repeatability and schedule stability that would allow
tool shops to become systematic, but few shops have done this (http://www.cargroup.org/documents/WorldClassToolShopFINAL.pdf).
17At right are our findings about the Figure 8: Absenteeism and turnover by cluster
relationship between high-road firms and
performance. We find that these firms
enjoyed on average the lowest decline in
sales between 2007 and 2010, while low-
road firms were faced with the highest
decline. A similar pattern is seen in
absenteeism and turnover rates, with high-
road suppliers reporting the lowest rates. In
both sales growth and workforce
performance, engineering-intensive firms
were superior to high-volume suppliers.
Our results regarding the performance of
different practices are only suggestive; in
future research we will perform more
rigorous tests. However, these results are
consistent with a large body of careful
research. For example, a study of steel-
finishing lines by Casey Ichniowski,
Kathryn Shaw, and Giovanna Prennushi Figure 9: Sales growth between 2007 and 2010 by cluster
found that firms with high-road practices
had 6.7 percent more uptime (generating
$2 million annually in net profits for a small
plant) than did lines without them. The
increase in uptime is due to
communication and knowledge overlap. In
a firm that does not use high-road
practices, all communication may go
through one person. In contrast, in high-
road facilities, such as plant 30, workers
solve problems more quickly because they
communicate with each other directly in a
structured way22.
A key point to note is that firms in even
the same narrowly-defined industry may
compete very differently, as Luria and
Wiarda (op. cit) also find. For example,
there are automotive stampers who
compete against each other for the same work in three of the four clusters (i.e., all but the “engineering-intensive”
cluster). The more high-road firms are able to offset their higher wage costs by such means as greater uptime and by
suggesting how they could add performance-improving features to the product. Wages of direct labor are less than 10%
of total cost for almost all stampers (steel is 60-70% of total cost). For this reason, even if a firm paid its production
workers twice what another firm paid, the higher wages would be more than offset by a 10% increase in revenues, a not
implausible increase from having more motivated, longer-tenure workers.
22 For a review of this literature, see Appelbaum, Eileen, Jody Gittell, and Carrie Leana. “High-Performance Work Practices and Sustainable Economic Growth.”
Employment Policy Research Network Brief. April 2011. http://bit.ly/qlkXmv.
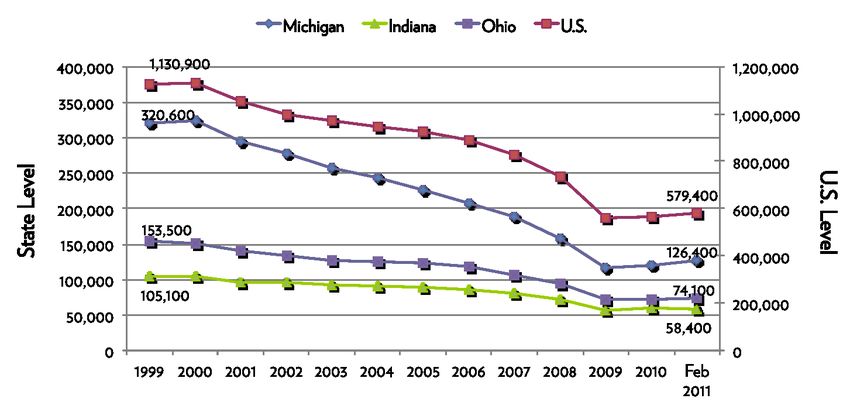
18Figure 10: Motor vehicle and parts manufacturing employment by state
19response to 2008-2009 crisis
While the decline in employment and establishments was already ongoing for over a decade when the financial crisis
occurred, the period just before the fall of 2008 was one of expansion. Interviewees reported difficulty meeting surging
demand in 2007-8 and expressed frustration with having to hire less-than-qualified workers then . When the crisis hit,
firms employed a variety of tactics to weather the downturn. Our sample is necessarily biased towards survivors as only
surviving firms were around to take our survey. Thus the responses to the crisis observed in our data are all strategies that
are consistent with firm survival. (However, as we shall discuss, the fact of short-term survival does not mean that these
strategies are optimal for firms, workers, or society.)
In our interviews of tier-1 supplier purchasing managers, they reported less-than-expected impact on business during the
financial crisis, measured both in their own ability to meet the needs of their customers and in the ability of their suppliers
to remain viable.23 While there were certainly supplier bankruptcies, there were fewer than top-tier suppliers expected.
That said, going forward, these firms were concerned about consolidation among suppliers which is already leading to
higher input prices24 and about supplier unwillingness to increase capacity.25 Our interviews and analysis of government
and survey data all suggest a consistent picture of the capacity squeeze. (See Figure 10 for representative data, for motor
vehicle parts producers (NAICS 3363). Firms in this industry cut employment 25-30% in early 2009 and had not restored
many jobs by spring 2011, leaving employment in the industry down by about 20% compared to mid 2008. However, light
vehicle sales recovered more quickly; in mid-2011 they were only 12% below their level of mid 2008. As a result of the
extremely tight capacity (especially in the lower tiers, existing workers were working a lot of overtime), some first-tier
suppliers reported having to increase inventory levels in order to meet production schedules; several also reported rising
defect rates in the parts they received from their lower-tier suppliers.
Our qualitative and quantitative research Figure 11: Changes to Operations
shows that not all the firms used the same
strategies to survive the crisis in 2008-09.
While only 12.1 percent of the firms in the
sample report no significant changes to their
business, the majority of plants implemented
a variety of survival strategies. This section
summarizes the responses to the auto crisis
focusing on operations, employment and
investment.
4.1. Production Response
First, as demand dropped suddenly, more
than a third of firms were forced to idle
plants, with almost a quarter of firms
shutting down a portion of their operations.
In the short term, at least, price does not
seem to have been a factor, as only a tiny fraction of firms shifted work around geographically. Also, idling capacity and
shutting down some operations, does not seem to have affected firms’ recovery, as neither is correlated with profitability
or sales growth.
23 Firms 6, 23, 26
24 Firm 24
25 Firm 6
204.2. Employment Response
In response to the dramatic fall in auto sales in 2008-9, 73% of our respondents laid off production workers (as Figure 12
shows). About 40 percent of firms laid off managers. Laying off production workers (but not managers) correlates with
slower sales growth, suggesting firms may have been hurt by laying off too many workers. Temporary workers seem to
have served as a buffer against layoffs, as more firms cut temps than hired them. 74.0 percent reduced working hours in
order to avoid layoffs, but 82% of these firms ended up doing layoffs as well. Only 21.3 percent of firms avoided both
layoffs and short working hours.
4.3. Financial Response
One of the most severe and immediate Figure 12: Changes to employment in response to crisis
consequences of the national banking crisis was a
sudden contraction in bank lending economy-
wide. Several interviewees reported having credit
dry up overnight. One theme that emerged
throughout multiple interviews was that credit
problems added an element of randomness to
the crisis, causing some seemingly robust firms to
falter unexpectedly. As one tool and die maker
explained about peer companies that had
recently gone out of business,
“These are four companies that I respected and
as of 2000 they were some of the leaders in our
industry. They were all very capable, well
established and well financed for most of their
history. They had a highly skilled workforce,
modern equipment and the latest technology.
Ten years ago no one would believe that they
would all four fail to survive.”26
As Figure 13 shows, almost two-thirds of our survey respondents reported reduced access to credit.27 While 38 percent of
respondents said they would not have invested even if they had gotten credit because of the decline in sales, diminished
credit caused many firms to cut back significantly; 43 percent of those whose access to capital was reduced cut back their
operations as a result of the credit crunch; 44 percent reduced their investment. Meanwhile, firms that experienced a
problem with credit continued to drive down costs; reduced access to credit is correlated with a firm’s ability to reduce
costs.
4.4. Investment Response
A matter closely related to the financial response to the crisis is firms’ investment response. Several interviewees said they
would have a difficult time justifying any investment that would not pay for itself within six months.28 Another manager,
who had had his eye on a new ERP package, decided to postpone that investment until business improved.29 A change in
26 Firm 29
27 To measure access to credit, we asked survey respondents: “During the auto crisis of 2008-2009, was your firm’s access to capital reduced?” Answer choices are
indicated in Figure 13, below.
28 For example, Firms 9 and 22.
29 Firm 7
21investment strategy appears in our survey, as well. Most Figure 13: Access to capital
of our respondents postponed investment in
production equipment (67.2 percent) and IT (45.2
percent); firms that postponed equipment investments
were also less profitable.30 While most firms also put
research and development (R&D) and product
development on hold, postponing R&D investment
does not appear to have hurt firms at least in the short
run, as postponement of R&D spending is correlated
with slightly faster sales growth. A small fraction of
firms, just 8.8 percent, increased investment in training.
While deferring investment during a downturn seems
reasonable, it might not be efficient. According to our
interviews, some lower-tier suppliers invested less than
they could have done because their customers would
disapprove of their level of debt. OEMs and tier-1
suppliers were understandably wary of doing business
with highly leveraged lower-tier suppliers
and would pull their business from suppliers Figure 14: Changes to investment strategy in response to crisis
they felt were over-leveraged.31 One
concern, however, is that firms that
borrowed for sound business investments,
such as workforce training or process
improvements would be treated the same as
firms making unsound investments, thereby
deterring good investments along with the
bad. (To read more about bankrupt firms,
please see Appendix D.) In theory, a
downturn is an excellent time to make
investments in training, because workers are
not needed for immediate production.
However, the depth of the crisis and lack of
pre-planning for such an eventuality meant
that managers were too busy to organize
such training, and/or lacked the cash to
continue paying workers.
4.5. Attitude Toward Crisis
Finally, attitudes towards the crisis differed widely among managers. In our interviews, several managers expressed the
belief that swings in demand were common and to be expected. A few even felt that the crisis provided an opportunity to
implement long-needed changes and to compete for “take over work” from former competitors that went out of
business.32 Some firms predicted that the crisis would have a long term negative effect; at least in the short run, they
seem to be correct as these firms have experienced slower growth during the recovery.
30 It is possible that causality runs the other way; firms that were profitable in the past had cash to invest. In future research, we will examine this possibility.
31 Source: Tier-1 interviews
32 Firm 9
22You can also read