SECTOR SKILLS PLAN TRANSPORT EDUCATION TRAINING AUTHORITY - 31 August 2020 - TETA
←
→
Page content transcription
If your browser does not render page correctly, please read the page content below

TRANSPORT EDUCATION TRAINING AUTHORITY

SECTOR SKILLS PLAN

31 August 2020

344 Pretoria Avenue                  Private Bag X 10016
                                                   Randburg
                                                   2194                                 Randburg
                                                   Phone: 011 577 7000                  2125
                                                   Fax: 0867650514

                                                                                        Coms@teta.org.za

                                                                               31 AugustFraud-line:
                                                                                         2020 0800222376

                                Cover Letter – SSP 2021/22
Dear Sir/Madam,

The Transport SETA’s 2021/2022 Sector Skills Plan (SSP) is attached for your consideration.
The unprecedented measures which the government took to curb the spread of the Covid-19
virus, came at a great cost to the economy and therefore also to most of the Transport sector.
A few fortunate subsectors benefitted significantly from consumers’ reliance on online
shopping. The profoundly negative impact of the lockdown measures on Transport sector
companies meant that TETA had to give a levy payment holiday to employers, therefore losing
a substantial portion of its funding required for skills development. We have ensured that the
structure of the SSP is in accordance with the latest SSP Framework as compiled by the
Department of Higher Education and Training (DHET). In this report, the numbering of tables
and figures corresponds to in-text discussions. Each table and figure displayed in the
document is succeeded by interpretation and discussion, however narratives which repeat
content already displayed in tables and figure were removed. There is a clear and direct
correlation between conclusions in each chapter and findings discussed in the respective
chapters. Complex statistical and economic models which may ‘cloud’ ease of comprehension
have been explained. In addition, the introduction of each chapter indicates which data
sources were utilised in compiling the respective chapters.

While adhering strictly to the recommended structure of the SSP, this document only features
topics which are pertinent to Transport sector skills development. As recommended, a holistic
approach was appropriated in profiling the sector. The PIVOTAL list of the Transport SETA has
been validated by the eight subsectors and is presented in the template recommended by
DHET. A new section dealing with performance, monitoring and evaluation (PM&E) in the
Transport SETA has been provided according to the prescripts of the framework. A conclusion
of the findings is included at the end of each chapter. Lastly, we point out the continuous
learning process that TETA has derived over the years and that the lessons are being applied
to every subsequent SSP. This is provided in the Continuous Improvement Plan (CIP).
Yours Faithfully,
ACTING: CHIEF EXECUTIVE OFFICER                    CHAIRPERSON: TETA BOARD

Mr. Famanda Shirindza                                     Mr. Samuel Zungu
Date: 31 August 2020                                 Date: 31 August 2020

                                                                                               i
Foreword
The Transport Education Training Authority (TETA) is a social partnership led by an officially
elected Board comprised of business, trade unions and government representatives. Our
strategic objectives are to:
Provide administrative support service and enable TETA to deliver on its mandate and
ensure compliance with all governance imperatives;
Enable mechanisms for skills planning and research capacity;
Increase access to occupationally directed programmes within the Transport sector;
Strengthen the quality assurance system.
The Transport SETA 2021/22 Sector Skills Plan (SSP) has been prepared in accordance with
the National Skills Development Plan (NSDP) 2030 and the Department of Higher Education
and Training Guidelines and Framework for the development of Sector Skills Plans.
The TETA SSP is developed based on research and sound information. It is a comprehensive
statement of the labour market trends, supply and demand dynamics and growth prospects
of the entire Transport sector in South Africa. A research process involved an online survey
sent to a large selection of sector key informants and companies, and a series of virtual focus
group discussions (FGDs) with the eight subsectors were utilised to inform this year’s SSP. In
addition, the Workplace Skills Plan/Annual Training Reports were also utilised, together with
extensive literature review, HEMIS and secondary data from Statistics South Africa.
I would like to express gratitude to all our stakeholders for their valuable contribution and
participation in the SSP development process. I strongly believe that the information captured
will influence the future direction of skills development in the sector.
CHAIRPERSON: TETA BOARD
_______________________
Mr. Samuel Zungu
Date: 31 August 2020
ii
Acronyms
ABET       Adult Basic Education and Training
ATR        Annual Training Report
DHET       Department of Higher Education and Training
ETQA       Education and Training Quality Assurance
TVET       Technical Vocational Education and Training
HET        Higher Education Training
HEMIS      Higher Education Management Information System
HRDSA      Human Resource Development Strategy for South Africa
HSRC       Human Sciences Research Council
IPAP       Industrial Policy Action Plan
MOU        Memorandum of Understanding
NDP        National Development Plan
NGP        New Growth Path
NQF        National Qualifications Framework
NVC        National Certificate Vocational
NSDS       National Skills Development Strategy
OFO        Organising Framework for Occupations
PFMA       Public Finance Management Act
PIVOTAL    Professional, Vocational, Technical and Academic Learning
QCTO       Quality Council for Trades and Occupations
QES        Quarterly Employment Survey
QLFS       Quarterly Labour Force Survey
RPL        Recognition of Prior Learning
SAQA       South African Qualifications Framework
SETA       Sector Education and Training Authority
SIC        Standard Industrial Classification
SIPs       Strategic Integrated Projects
SMME       Small, Medium and Micro Enterprises
SDF        Skills Development Facilitator
SSP        Sector Skills Plan
STATS SA   Statistics South Africa
WSP        Workplace Skills Plan

                                                                       iii
Table of Contents
Cover Letter – SSP 2021/22 ..................................................................................................................... i
Foreword................................................................................................................................................. ii
Acronyms ............................................................................................................................................... iii
Research Process and Methods ........................................................................................................... viii
Executive Summary................................................................................................................................. x
1      Chapter 1: Sector Profile ................................................................................................................. 1
    1.1        Introduction ............................................................................................................................ 1
    1.2        Scope of Coverage .................................................................................................................. 1
       1.2.1          National Overview........................................................................................................... 1
       1.2.2          Standard Industrial Classification Codes ......................................................................... 1
    1.3        Key role players ....................................................................................................................... 4
       1.3.1          The Role of CETs, TVETs and Universities ....................................................................... 6
    1.4        Economic Performance ........................................................................................................... 7
       1.4.1          Current economic performance by subsector ................................................................ 8
       1.4.2          Transport sector future outlook ................................................................................... 10
       1.4.3          Sector competitiveness ................................................................................................. 11
    1.5        Employer profile.................................................................................................................... 12
       1.5.1          Number of employers represented within the sector and sub-sectors ....................... 12
       1.5.2          Transport sector employer sizes ................................................................................... 13
       1.5.3          Employers geographical spread .................................................................................... 14
       1.5.4          Start-up and Closure performance ............................................................................... 14
    1.6        Labour market profile ........................................................................................................... 14
       1.6.1          Number of individuals employed in the sector............................................................. 14
       1.6.2          Employment by gender ................................................................................................. 15
       1.6.3          Employment by race ..................................................................................................... 15
       1.6.4          Employment by Age ...................................................................................................... 16
       1.6.5          Employment of People with disability .......................................................................... 17
       1.6.6          Employment by subsectors ........................................................................................... 17
       1.6.7          Provincial Distribution of Employees ............................................................................ 18
       1.6.8          Employment by Occupational Group ............................................................................ 19
    1.7        Conclusion ............................................................................................................................. 19
2      Chapter 2: Key Skills Change Drivers............................................................................................. 21
    2.1 Introduction ................................................................................................................................ 21
    2.2 Factors affecting skills demand and supply: Implications for future .......................................... 21
    2.3 Policy frameworks affecting skills demand and supply .............................................................. 25

                                                                                                                                                         iv
2.4 Conclusion ................................................................................................................................... 27
3      Chapter 3: Occupational Shortages and Skills Gaps ..................................................................... 28
    3.1        Introduction .......................................................................................................................... 28
    3.2        Hard-to-Fill Vacancies (Sectoral Occupation Demand) ......................................................... 28
    3.3        Major skills gaps in the transport sector............................................................................... 41
       3.3.1          Extent and Nature of Supply ......................................................................................... 43
    3.4        State of Education and Training Provision in 2020 ............................................................... 47
       3.4.1          Traditional Universities ................................................................................................. 47
       3.4.2          TVET Colleges ................................................................................................................ 47
       3.4.3          Training Providers ......................................................................................................... 48
    3.5        Sectoral Priority Occupations................................................................................................ 48
       3.5.1          Brief description of the method for consolidation of PIVOTAL List .............................. 49
    3.6        Conclusion ............................................................................................................................. 53
4      Chapter 4: Existing SETA partnerships .......................................................................................... 54
    4.1        Introduction .......................................................................................................................... 54
    4.2        TETA existing partnerships .................................................................................................... 54
       4.2.1          Successful Existing Partnerships ................................................................................... 56
       4.2.2          Challenges experienced with existing partnerships...................................................... 56
       4.2.3          Strengthening existing Partnerships ............................................................................. 57
    4.3        Planned partnerships ............................................................................................................ 57
       4.3.1          New Partnership ........................................................................................................... 57
    4.4        Successful Partnership Model – Lessons .............................................................................. 57
    4.5        Conclusion ............................................................................................................................. 58
5      Chapter 5: TETA Monitoring and Evaluation ................................................................................ 59
    5.1        Introduction .......................................................................................................................... 59
    5.2        TETA’s Approach to Monitoring and Evaluation ................................................................... 59
    5.3        The Use of M&E Data to Support Research and Planning .................................................... 60
    5.4        The Extent of How the Previous 2019/2020 Strategic Priorities were addressed................ 61
    5.5        TETA’s Un-achieved Previous Year’s Strategic Priorities ...................................................... 62
    5.6        Conclusion ............................................................................................................................. 63
6      Chapter 6: Skills Priority Actions ................................................................................................... 64
    6.1        Introduction .......................................................................................................................... 64
    6.2        Key Findings from the Preceding Chapters ........................................................................... 64
    6.3        Strategic skills Priorities ........................................................................................................ 65
       6.3.1          Measures in Response to Transformational Imperatives ............................................. 66
       6.3.2          Measures in response to the Fourth Industrial Revolution .......................................... 66
       6.3.3          Measures in support of SMMEs and entrepreneurship ............................................... 67
       6.3.4          Short-term Measures in Response to Covid-19 ............................................................ 68

                                                                                                                                                        v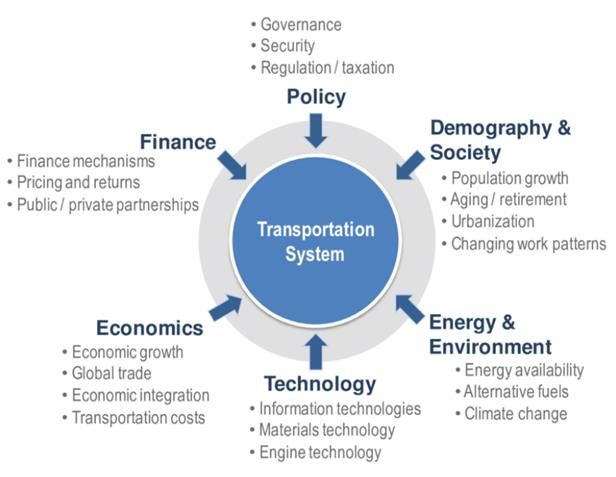
6.3.5          Other Measures to address matters related to SETA Skills Priorities and Processes ... 70
    6.4        Conclusion ............................................................................................................................. 71
7      Bibliography .................................................................................................................................. 72

Table 1: Transport sub-sectors and standard industry codes................................................................. 2
Table 2: Transport sector key role player by roles and contribution to education and workplace ....... 4
Table 3: The role that CETs, TVETs and Universities play in the Transport sector ................................. 6
Table 4: Annualised percentage change in the seasonally adjusted quarterly gross domestic product
by industry .............................................................................................................................................. 7
Table 5: Current economic performance by subsector .......................................................................... 8
Table 6: Employment across all sectors over a one year and a quarter period ................................... 15
Table 7: Employment by Gender .......................................................................................................... 15
Table 8: Employment Distribution by Subsector in 2017 - 2020 .......................................................... 17
Table 9: Transport sector employment by province............................................................................. 18
Table 10: Drivers of Skills Demand and Supply by Transport subsector............................................... 22
Table 11: Major national plans and strategies affect skills demand and supply .................................. 26
Table 12: Hard-To-Fill-Vacancies in the Aerospace subsector .............................................................. 29
Table 13: Hard-To-Fill-Vacancies in the Forwarding and Clearing subsector ....................................... 30
Table 14: Hard-To-Fill-Vacancies in the Freight Handling subsector .................................................... 32
Table 15: Hard-To-Fill-Vacancies in the Maritime subsector................................................................ 33
Table 16: Hard-To-Fill-Vacancies in the Rail subsector ......................................................................... 35
Table 17: Hard-To-Fill-Vacancies in the Road Freight subsector .......................................................... 36
Table 18: Hard-To-Fill-Vacancies in the Road Passenger subsector ..................................................... 38
Table 19: Hard-To-Fill-Vacancies in the Taxi subsector ........................................................................ 39
Table 20: Skills Gaps at Major Occupational Groups in the Transport sector ...................................... 41
Table 21: Enrolments by Institution type ............................................................................................. 43
Table 22: Completions/graduations by Institution type ....................................................................... 44
Table 23: Number of workers and unemployed persons registered in SETA-supported learning
programmes .......................................................................................................................................... 44
Table 24: Number of workers and unemployed persons certified in SETA-supported learning
programmes .......................................................................................................................................... 45
Table 25: Number of Trainees by Learning Programme Type .............................................................. 45
Table 26: Top Ten Occupations funded by TETA in 2019 ..................................................................... 46
Table 27: Transport SETA's PIVOTAL List 2021/22 ................................................................................ 51
Table 28: TETA existing partnerships .................................................................................................... 55
Table 29: TETA strategic priorities addressed....................................................................................... 61
Table 30: Un-achieved 2019/2020 strategic priorities ......................................................................... 62
Table 31: TETA strategic priorities against Action Plan ........................................................................ 63

Figure 1: Contributions to growth by sector in first quarter 2020 ......................................................... 7
Figure 2: Number of businesses represented in the sector and its subsectors .................................... 12
Figure 3: Breakdown of transport sector businesses by size classification (small, medium or large) .. 13
Figure 4: Geographical distribution of Transport sector companies .................................................... 14
Figure 5: Racial distribution of employment in the Transport sector................................................... 16
Figure 6: Employment by age ............................................................................................................... 16
Figure 7: Number of People with Disabilities employed by companies who submitted the WSP ....... 17
Figure 8: Employment by Occupational Group..................................................................................... 19

                                                                                                                                                         vi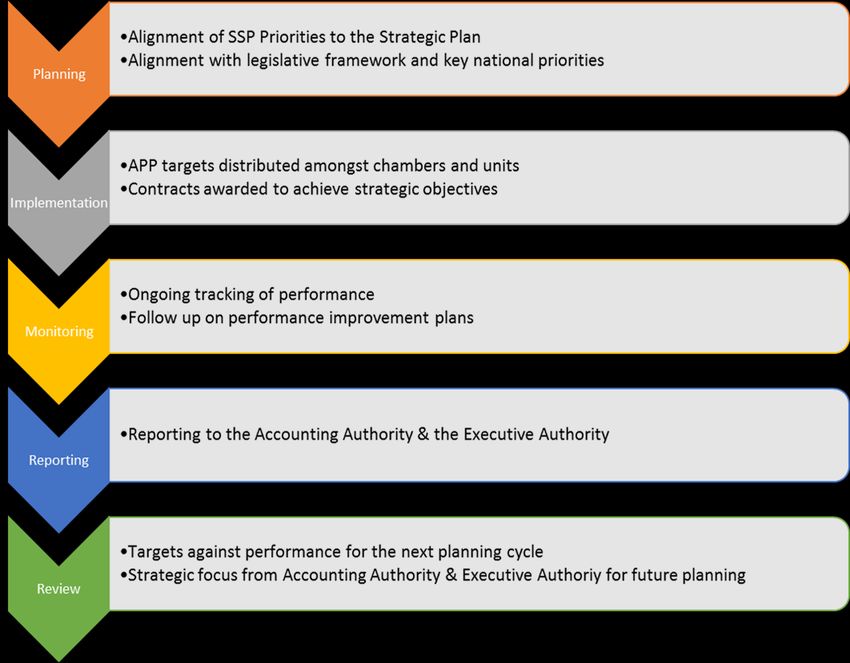
Figure 9: All the drivers of skills demand and supply in the Transport system .................................... 21
Figure 10: Percentage of individuals who have completed training interventions .............................. 46
Figure 11: Methods employed in compiling the PIVOTAL List .............................................................. 49
Figure 12: Results-based monitoring and evaluation framework ........................................................ 59
Figure 13: Use of M&E within TETA ...................................................................................................... 60

                                                                                                                                        vii
Research Process and Methods
This section details the research process and methods TETA utilised in generating findings
which informed the 2021/22 Sector Skills Plan (SSP) update. The research process entailed
consulting primary and secondary sources of data. In order to adequately satisfy the
requirements of the SSP framework, data were gathered for the SSP using a mixed methods
approach. The mixed methods approach involves integrating both quantitative and
qualitative data collection techniques in a single study (Creswell 2013).
RESEARCH METHODS: The research methods involved the following:
Literature Review
Objective: A review of literature on Transport sector publications, annual reports,
newsletters, and transport sector studies was conducted to gather secondary data on
economic and labour market profiles, change drivers, skills mismatches, supply and
demand of skills, HTFVs skills, skills gaps and skills development interventions.
Data Collection Tools: The literature review involved web search and document analysis.
Secondary data sources were an important source of data. The key sources were
publications from Statistics South Africa, professional research institutions and academic
institutions, as well as research studies commissioned by TETA publication on the Sector
Profile, Strategic Partnerships Skills and various Tracer Studies.
Scope of Study: The literature review gathered information on the first five chapters.
Time-Frame: The literature review was conducted throughout the duration of the study
(3½ months).
Virtual Focus Group Discussions
Objective: The objective of the virtual Focus Group Discussions (FGDs) was to probe scope
of coverage, key role players, effects of Covid-19 on economic performance and labour
force, change drivers, skills gaps and skills supply, hard-to-fill-vacancies (HTFVs), future
skills and priority skills actions. These FDGs were virtual to ensure that stakeholders were
consulted despite Covid-19 pandemic lockdown measures (i.e. inter-provincial travel ban).
Data Collection Tools: Standard focus group discussions were conducted with smaller
groups of participants using a focus group discussion guide presented in the form of a
presentation.
Sample Size and Scope of Study: A total of 77 individuals represented various Transport
subsectors and were distributed as follows; Road Freight (11), Maritime (7), Aerospace (12),
Road Passenger (10), Forwarding and Clearing (10), Freight Handling (11), Taxi (9), and Rail
(7).
Time-Frame: Workshops were all held in the month of June.
Online Survey
Objective: The objective of the survey was to supplement the FGDs because this year
fewer stakeholders were able to participate in the FGDs. Therefore, the survey covered
the same topics as the FGDs including scope of coverage, key role players, effects of
Covid-19 on economic performance and labour force, change drivers, skills gaps and skills
supply, hard-to-fill-vacancies (HTFVs), future skills and priority skills actions.
Data Collection Tools: An online survey was distributed using Survey Monkey.
viiiSample Size and Scope of Study: The survey was distributed to 576 Transport sector
stakeholders and 123 completed it, meaning that there was a 21% response rate.
Time-Frame: The survey was sent out on the 9th of June and closed on the 23rd of June.
Workplace Skills Plans and Annual Training Reports
Objective: The objective of the WSP/ATR analysis was to determine the extent of Hard-to-
Fill-Vacancies (HTFVs) as well as planned and reported training.
Data Collection Tools: Consolidated WSP/ATR spreadsheets.
Sample Size and Scope of Study: A total of 1 349 WSP/ATRs (2020) were analysed. The
submissions to the WSP/ATR by companies provided information that feeds into the
chapters of the SSP.
Time-Frame: June to July 2020.
Secondary Data Analysis
Objective: The objective of the secondary data analysis was to examine the sector’s
economic performance in comparison to that of other sectors, to analyse various aspects
of the employer profile and the labour market profile.
Data Sources: Statistics South Africa’s statistical data on the GDP, Statistics South Africa’s
quarterly labour force survey (QLFS) data and the SARS levy data obtained monthly by TETA
from the DHET levies website.
Sample Size and Scope of Study: The SARS file consisted of data on 20 000 registered
Transport sector companies.
Time-Frame: June to July 2020.
Time frame of the study
The SSP was conducted between 1st April and 7th July 2020.
ixExecutive Summary
The SSP is a guiding document for skills development and planning in the Transport sector. It
is also used as a source of input in formulating TETA strategic plans and budget allocations. In
its formulation, the SSP is a continuously improving record of the performance of the sector
and responds to the goals of the country’s legislative and planning frameworks such as the
Skills Development Act of 1998, the National Development Plan (NDP) 2030, National Skills
Development Plan 2030, National Human Resources Development Strategy South Africa
(2010-2030) and the BBBEE policies. The compilation of this SSP drew from a number of data
gathering methods such as authoritative documents, literature reviews, virtual focus group
discussions and an online survey.
It is important to note that although the Transport sector is explained by eight subsectors,
Chapter 1 cautions that the sector is increasingly experiencing influence from technology
which is in turn steadily resulting in new models of transport businesses likely to trigger a
redefinition of the sector and TETA alike. With its eight subsectors (Rail, Road Freight, Road
Passenger, Forwarding and Clearing, Aerospace, Freight Handling, Maritime and Taxi), the
Transport sector plays a major role in the economic growth of South Africa and contributes
greatly to the rate of employment and job creation. While for many years since 2013 data
from Stats SA indicated that growth in the Transport, Storage and Communication sector has
been between 2.9% and 1.6%, and thus contributed towards positive economic growth, in
2019 when the country went into a recession, the Transport, Storage and Communication
sector was one of the key contributors to the poor growth. Despite this however, the sector
managed to retain the same employment rate of 6% as it had in previous years, remaining
the sector with the seventh highest number of employees. The highest levels of employment
were found in Gauteng with 36.5% of the Transport sector employees, while the coastal
provinces of KZN and Western Cape trailed behind it with 19% and 17%, respectively (Stats
SA 2020), respectively. The economy of the coastal region is largely driven by ocean business
and tourism.
This year (2020), a total of 20 000 companies were registered in the Transport sector. Of this
group, 5 276 (26%) are levy paying, and 1 171 (6%) submitted their annual Workplace Skills
Plan/Annual Training Reports (WSP/ATR). This year, the subsectors with the largest number
of companies are the in the Road Freight and Road Passenger subsectors, followed by the
Maritime subsectors and Freight Handling; most of which also had the highest number of
employees. The Rail subsector also had one of the highest employee numbers, while
Forwarding and Clearing and Aerospace subsectors followed, and the registered Taxi
companies, within the formal economy, have the lowest number of employees (this does not
account for the employees in the informal sector of the Taxi industry), as well as the lowest
percentage for levy paying companies and submission of WSP, therefore warranting
intervention from TETA.
As noted in earlier SSPs, the Transport, Storage and Communication sector is amongst the
least gender-transformed sectors in the economy. In the fourth quarter of 2019, the
percentage of women employed in the sector was 17.8% compared 82.2% of men employed
in the sector. Much has been done however regarding the racial transformation of the sector,
as 72.1% of the employees in the sector are African. One area of concern is over the gradual
decrease in the percentage of youth in the sector. Consequently, TETA is recommended to
xreview its interventions aimed at empowering the formerly disadvantaged groups, including
increasing the number of women and young people in the sector.
The findings in Chapter 2 reveal that there are a large number of factors that drive the supply
and demand of skills in the Transport sector, six of which are the core factors with twenty
sub-factors. Of these drivers, the following were highlighted in Chapter 2: government
legislation and policies; the economic recession and COVID-19; the 4th industrial revolution
and technological innovations; demographic changes; and growth of small-medium micro
enterprises (SMMEs). While drivers such as technology are important, particularly as the
pandemic has fast-tracked many technological advancements; the “hand” of government
however has a major role in shaping how these other drivers influence skills development and
employment in the Transport sector.
In Chapter 3, a quantified estimation of occupational shortages, skills gaps and occupational
supply were provided and analytically discussed. The Hard-To-Fill Vacancies (HTFVs) are
presented by subsector mainly because nuanced effects of the pandemic and lockdown on
the skills needs of the various subsectors. Occupational shortages slow down the economic
growth of the country; thus, detailed information is crucial to facilitate appropriate
intervention to reduce the mismatch between demand and supply of skills. Skills gaps in the
sector were also addressed because proper functioning and productivity of transport
companies is hindered by individuals who do not possess the correct skills needed for the
positions they occupy. In terms of the state of education and training provision, there was
greater emphasis on effects of the pandemic and lockdown on the cessation or continued
education and training provided by the various institutions. Practical components of
education, learning and skills programmes were the most adversely affected as learners could
not gain workplace experience during the lockdown and continue to be the least of
companies’ priorities in level three of the lockdown. Also, the PIVOTAL list of the Transport
SETA has been updated and validated by the eight chambers.
Chapter 4 focuses on the evaluation of the effectiveness of partnerships with particular
reference to value-add as well as challenges experienced. Currently, TETA’s partnerships have
been structured into five typologies which are: TVET colleges, universities, organs of state,
employer associations and other SETAs. The collaborative approach between TETA and
partners has scored some successes albeit with some challenges. TETA’s partnerships are
increasing in number and they are becoming stronger, although it was not possible to list all
of TETA’s existing partnerships in this report. In addition, a few examples of potential models
of partnerships are emerging. The partnership between TETA and North West University as a
potential model to use with other universities has been noted. This partnership has disbursed
bursaries to PDI students of which 90% were immediately absorbed within the Transport
sector after completion of their studies. With the Eastern Cape Office of the Premier, the
partnership has provided new skills to 500 unemployed youth, through a Work Integrated
Learning (WIL) programme and over 70% of them have been reported as employed to date.
Nevertheless, the partnerships have not been immune to challenges. Some employers
perceive the WIL programme as a means to access funding as opposed to confronting skills
development challenges of the sector. Some of the levy paying companies are not responsive
to the collaboration opportunities availed by TETA. Other challenges include poor quality of
graduates produced, low absorption rate after training, slow transformational agenda and
poor research.
xiChapter 5 is a new addition to the SSP and focuses specifically on the performance,
monitoring and evaluation (PM&E) function of the SETA, the approaches to PM&E, a brief
summary of previous performance of the SETA regarding strategic priorities to inform skills
planning and a clear plan of action to inform the next skills planning cycle. The chapter reveals
that TETA’s PM&E is guided by its PM&E framework which sets out the role of PM&E across
all organisational functions including strategic planning, and that this framework could be
altered to align to the new overarching SETA-wide M&E Framework, which is being developed
by Rhodes University, SETAs, DHET and other key stakeholders. Furthermore, the chapter
showed that TETA has made great progress on its performance as an organisation; however,
there are areas that requires more effort, including leadership development, green economy
and the 4th Industrial Revolution.
Finally, Chapter 6 provides a brief description of the key conclusions of all five chapters and
also provides concrete and implementable recommendations for TETA based on the
conclusions and discussions in the document.
The SSP makes the following recommendations related to the following:
Measures in response to Transformational Imperatives;
Measures in response to the Fourth Industrial Revolution;
Measures in support of SMMEs and entrepreneurship; and
Other Measure to address matters related to SETA Skills Priorities and Processes
ACTING: CHIEF EXECUTIVE OFFICER CHAIRPERSON: TETA BOARD
_________________________ _______________________
Mr. Famanda Shirindza Mr. Samuel Zungu
Date: 31 August 2020 Date: 31 August 2020
xii1 Chapter 1: Sector Profile
1.1 Introduction
The chapter presents an overview of the Transport sector in South Africa. It presents the
analysis of the Transport sector scope of coverage, the key role players in the sector, and the
economic performance of the sector, and the employer’s and the labour market profile.
The analysis presented in this section is informed by primary and secondary data such as the
Quarterly Labour Force Surveys (QLFS 2020 Quarter 1) and Gross Domestic Product (GDP 2020
Quarter 1) of Statistics South Africa, April 2020 SARS Levies File, a sector profile study
commissioned by TETA in 2019, and virtual focus group discussions with key stakeholders
including employers, industry associations, trade unions and government agencies etc. as well
as a literature review.
1.2 Scope of Coverage
National Overview
The Transport sector facilitates the transportation of goods and people from one place to
another. This happens by means of four main modes of transport, namely, land, air, sea and
inter- or multi-modal transport. The Transport sector makes use of intensive infrastructure
and is an important component of development and the economy. Organisationally, South
Africa’s Transport sector is divided into eight Chambers or sub-sectors according to the four
modes of transport, these are represented as follows (UE 2018):
Land
Rail
Road (Road Freight, Road Passenger and Taxi)
Air
Water/Sea
Inter or Multi-modal
Forwarding & Clearing
Freight handling
Standard Industrial Classification Codes
Table 1 below provides a breakdown of the transport sub-sectors and standard industry codes
(SIC) as captured by the Transport Education Training Authority (TETA).
1Table 1: Transport sub-sectors and standard industry codes
Sub-sector SIC Code Description Brief Explanation
Aerospace 73000 Air Transport Aerospace involves the moving of goods and passengers by air. The aerospace industry
73001 Civil Aviation caters for both cargo and passenger transport and includes military activities, scheduled
flights, charter flights, business operated aircraft and recreational flying. South Africa has
a well-established aviation industry and network, providing world-class international
airports in the major cities of the country, and a significant number of smaller airports
throughout the country.
Forwarding and Clearing 71232 Freight Forwarding and Clearing The forwarding and clearing industry is responsible for activities and supply chains relating
to all imports and exports of goods entering or leaving South Africa by all modes of
transport. Freight forwarding involves the movement of goods on behalf of importers and
exporters, applying supply chain management solutions to ensure effective imports and
exports and transportation of goods, and applying warehousing solutions for goods in
transit. Freight clearing is concerned with customs clearing for exports and imports, as
well as assistance in implementation and adherence to import/export and related
regulations.
Freight Handling 71300 Transport via Pipelines The freight handling industry is an important link in the supply chain management system
74110 Cargo Handling and provides support services to the other transport industries and sectors. This industry
74120 Storage and Warehousing focuses on the handling and storage of cargo via ports (air and sea), distribution centres,
factories and depots.
Maritime 13100 Ocean and Coastal Fishing Maritime transport involves the shipment of goods and people by vessel on either sea or
72000 Water Transport other waterways. Maritime transport of goods includes the transport of containers,
27111 Coastal Shipping passengers and other vehicles, general cargo that is loose-packed (break-bulk), bulk goods
in the form of single-commodities such as minerals and grains, and the bulk transport of
72112 Ocean Fishing liquids such as oil. This includes both liner vessels operating on fixed routes and to fixed
72200 Inland Water Transport schedules, and charter vessels that are commissioned on demand. Passenger transport by
sea involves transport by ocean liner, ferry and cruise ships, offering round-the-world
cruises; repositioning cruises that offer cruises from one home-port to another
destination; and area-based or destination cruises, where the ship undertakes cruises
within the area of the home-port and returns to the home-port at the end of the cruise.
Rail 71112 Railway Commuter Services The Rail transport industry can be described as the movement of freight and passengers
49120 Freight Rail Transport by way of vehicles running on and guided by fixed rail tracks. Passenger Rail services fulfil
two main functions, namely regional, long-distance transport linking cities and rural areas
with one another; or daily movement of sub-urban commuters to and from work. Freight
Rail services involve the movement of various types of goods and commodities using
freight wagons specifically designed for various types of goods, including the transport of
2dry bulk, liquid bulk, break bulk (bags, cartons, crates, parcels, etc.), containers; and
unitised goods (pallets, bulk bags, etc.). This includes commodities such as road vehicles,
fuel, agricultural produce and fertilisers, minerals such as coal, chrome and manganese,
and consolidated consignments. Furthermore, it deals with the maintenance, servicing,
repair overhaul and testing of locomotives and rolling stock.
Road Freight 71230 Freight Transport by Road The Road Freight industry involves the movement of goods via roads. Freight are most
94004 Waste Management commonly moved between airports, rail yards, ports and distribution centres, and
between pipeline depots and petrol stations (also known as the first mile) and between
the distribution centres and retailers’/consumption zones (also referred to as the last
mile). Road freight is important in linking the various modes of transport and is key in
completing the freight logistics supply chain. It is estimated that Road Freight is
responsible for the moving of nearly 80% of all freight in the country on an annual basis.
Freight are generally transported by means of various vehicles, which can range from
motorcycles with an engine capacity of 125 cubic centimetres or less (drivers licence code
A1) to articulated vehicles with a gross combination mass greater than 18 000 kg (drivers
licence code EC). These typically include: Dry bulk transport carriers; Abnormal load
transporters; Hazardous chemical carriers; Retail fleet (fast moving consumer goods);
Courier companies; and Waste material transportation.
Road Passenger 71200 Other Land Transport The Road Passenger industry refers to mass transit of passengers through bus transport.
71211 Urban, Sub-Urban/Inter-Urban The following activities comprise the Road Passenger sub-sector:
Bus/Coach • Transporting passengers by bus or mini-bus at a fee (this, however, excludes the
minibus Taxi industry); Long distance bus services; Tour and charter bus services;
71212 School Buses
Cross-border bus services; Intercity bus services; School/learner bus services;
Commercial contract bus services; Special hire or private hire bus services;
Subsidised and non-subsidised bus services; Scheduled and unscheduled bus
services.
Taxi 71221 Taxi The Taxi industry is associated with the transportation of passengers in vehicles other than
buses, at a fare. This industry is dominated by the minibus Taxi industry, which is known
to be largely unregulated in terms of formal economic practices. The Taxi industry
transports by far the biggest number of passengers on any given day, compared to both
Rail and bus, carrying approximately 65% of the country’s public transport passengers. In
recent times, the Taxi industry has seen radical changes with e-hailing services such as
Uber and Taxify, labelled as “disruptive innovators”, causing tension amongst the metered
Taxi industry. The Taxi industry consists of the following activities: Minibus Taxis; Metered
Taxis; E-hail Taxis; Scholar transport; Shuttle services; Chauffeur drivers etc.
Sources: TETA (2020) and Urban Econ (2018)
31.3 Key role players
The Transport sector is dominated by various role players with diverse roles and with direct and indirect contribution to national skills
development plan and outcome 4.2 – “linking education and workplace through their workplace programmes”. These role players are easily
classified into six groups, namely; civil society organisations, employer associations, government, organised labour movement, regulatory bodies,
and training providers. Table 2 categorises the various role players, their roles and contribution to linking education and workplace.
Table 2: Transport sector key role player by roles and contribution to education and workplace
Categories Key Role Players Their Roles Contribution to linking education and
workplace in relation to the NSDP 2030
Civil society South African Women in Transport Network; Advocacy for gender transformation, In most cases, these self-organised groups are
Transport Student Logistic Association; Road advocacy for youth skills development and implementers of skills programmes on the
Transport Student Movement; Commuter employment, representation of “ground”. They are at the coal-face of the
Associations; Learners; Transport Sector communities and cooperatives interests, interventions. Furthermore, these groups
Representatives, Public Skills Development training and development of small provide an easy access to marginalised groups
Forums, Road safety lobbyists advocates etc. enterprises and cooperatives, beneficiaries such as women, youth and people with
of skills development initiatives, inputs on disability.
legislations and policy frameworks
Employer Associations South Africa Association of Freight Forwarders Influencing skill development through These key role players are the main drivers of
(SAAFF); South African Association of Ships’ submission of the workplace skills plan the sector. They lead technological advances,
Operators and Agents SAASOA); Transport and (WSP); Representation on committees of they contribute to training content and the
Logistics Employers Association (TLEA); Rail TETA; Representation and articulation of development thereof. Of more importance,
Road Association (RRA); Road Freight employers interest in various policy they are the creators of employment and
Association (RFA); South African National Taxi platforms; Ensuring workforce training and employment opportunities.
Council (SANTACO); National Taxi Alliance skills development in specialised areas of
(NTA) etc. need
Government Department of Higher Education and Training Represent interests of the state in national Government provide an enabling environment
(DHET); National Department of Transport skills development; Policy making for for the possibility of skills development and
(DoT) and its agencies; Provincial and Local education and training in the transport employment for the sector. It provides a
Government Transport Departments; sector; Delivery of SETA’s mandate to regulatory framework as well as holding other
Transport Education Training Authority (TETA), facilitate training and skills development in parties accountable to their social contract. In
National Skills Authority; Provincial Skills the sector the unique case of South Africa, Government is
Development Forums (PSDFs) etc. a direct funder of skills development in the
sector.
4Categories Key Role Players Their Roles Contribution to linking education and
workplace in relation to the NSDP 2030
Organised labour movement South African Federation of Dock Workers Their main role is the articulation of Acting on behalf of the work-force, labour
Union (SAFDU); National Certificated Fish and organised labour’s interest in various policy movements are there to ensure a conducive
Allied Workers Union (NCFAWU); Professional platforms; Contribution to education and environment in the workplace. Unions play a
Transport Workers Union (PTWU); Transport training negotiations, public management critical role in ensuring that skills innovations
and Allied Workers Union (TAWUSA); United of transport resources, and dispute and changes happen in a just manner (Just
Transport Allied Trade Union (UTATU); South resolution transition). They negotiate fair terms for
African Transport and Allied Workers Union existing and entrant employees in the sector.
(SATAWU); Democratised Transport Logistics
and Allied Worker’s Union (DETAWU); United
National Transport Union etc.
Regulatory bodies South African Marine Safety Authority Ensures that workers competently These bodies contribute quality standards in
(SAMSA); South African National Roads Agency discharge their jobs and protect workers the transport sector. They ensure high quality
Limited (SANRAL); South African International right to practice; advocate for the and safety in both training and practice in the
Maritime Institute (SAIMI); National Ports introduction of skills training in hard-to-fill sector. They hold the power to grant
Authority (NPA); Cross Border Road Transport skills areas permission to practice by setting and regulating
Agency (CBRTA); National Railway Safety quality and credibility standards.
Regulatory (NRSR); Quality Council for Trade
and Occupations (QCTO); South African
Qualification Authority (SAQA); Civil Aviation
Authority (CAA) etc.
Training providers Universities; Universities of Technology; TVET Represent interests of training provider in These institutions are there to supply skills to
colleges; Community colleges; Private training policy platforms; Contribute to education the sector. They ensure that new entrants are
providers; other training providers etc. and training quality assurance, and ready for the workplace. In many cases, such
curriculum development institutions invest in continuous curriculum
development to match sector needs.
Source: TETA (2019) and UE (2018)
5The Role of CETs, TVETs and Universities
Table 3: The role that CETs, TVETs and Universities play in the Transport sector
Community Education and Training Colleges (CETs): Technical and Vocational Education and Training Universities: These institutions are generally theory-
These colleges are a new type of institution catering Colleges (TVET): The focus of TVET colleges is to based, and in most instances, do not provide students
mainly for those who do not qualify for admission to provide students with not only the academic with practical experience or specific sector based-skills.
TVET colleges or universities. They are as a result of the knowledge, but also the practical experience to enter It is the experience of many employers that graduates
Government’s commitment to increase youth and the workforce as quickly and as well-equipped as from universities have extensive knowledge, but
adult involvement in the community education and possible. Many stakeholders in the transport sector cannot apply their theoretical knowledge practically,
training to one million by 2030 (DHET 2018). Their role remain unanimous about the fact that TVET colleges even in occupations such as mechanics. The greatest
is to assist post-school youth and adults who wish to often form partnerships with private training providers value traditional universities are seen as having is that
raise the base for further learning, improve their skills and industry companies which offer apprenticeships they provide higher-level skills and more advanced
for employability and/or progression to opportunities and learnerships, so that their students have access to qualifications such as finance, logistics, which are
in the TVET colleges and university education. In the practical training in these organisations. One of the essential for administration. They are viewed as better
transport sector, and as prescribed by the NSDP 2030, greatest needs of the transport sector is artisans, and positioned to define and drive innovation in the
they have been a grand opportunity to implement TVET colleges are said to be striving to meet this need. transport sector. Graduates from traditional
vocational training programmes catered for learners Besides, TVET colleges are regarded as trainers for the universities are said to be equipped with foundational
who may not necessarily fare well in mainstream labour market as they provide work experience for competencies in critical and analytical thinking.
education. They are an alternative route to a their students and link them to industry companies. Therefore, they are better able to occupy more
professional career in the sector. Although not well They stipulate that practical experience is a strategic, planning- related and leadership positions.
advertised, they also provide an opportunity for prerequisite to passing a course or graduating. In This therefore implies that universities are
experienced adults to formalise their skills by essence, the provision of vocational or practical appropriately positioned to drive the NSDP 2030’s
undergoing Recognition of Prior Learning (RPL). training as an outcome of the NSDP 2030 (Linking research and innovation imperative.
education and training to workplace experience) is a
key responsibility of these TVET colleges.
61.4 Economic Performance
This section presents the Transport sector’s economic performance measured by
contributions to GDP growth in comparison to contributions made by other economic sectors.
Figure 1: Contributions to growth by sector in first quarter 2020
1,0 0,5 0,8
0,0 0,1 0,0
0,0
-0,1 -0,2 -0,2 -0,3
-1,0
-1,1
-2,0
-1,7
Agriculture, forestry and fishing Mining and quarrying
Manufacturing Electricity, gas and water
Construction Trade, catering and accommodation
Transport, storage and communication Finance, real estate and business services
General government services Personal services
Taxes less subsidies on products
Source: Statistics South Africa (GDP Q1 2020)
Figure 1 shows the contribution to GDP growth by sector, while table 4 below shows the
quarterly GDP growth by sector. The real gross domestic product decreased by 2% in the first
quarter of 2020, following a decrease of 1.4% in the fourth quarter of 2019. The two largest
negative contributors to growth in GDP in the first quarter of 2020 were the mining and
manufacturing industries. In addition, the mining industry decreased by 21.5% and thus,
contributed -1.7 percentage points to GDP growth (see figure 1 above). The manufacturing
industry decreased by 8.5% and contributed -1.1 percentage points to GDP growth 2020. The
three highest positive growth rates and contributions to GDP growth in the first quarter were
in agriculture (27.8% and contributing 0.5 of a percentage point), finance (3.7% and
contributing 0.8 of a percentage point) and general government services (1% and contributing
0.1 of a percentage point). The trade, catering and accommodation industry decreased by
1.2%, while the Transport, storage and communication industry increased by 0.5%, as a result
of increases in Freight transport and communications (Statistics South Africa (GDP Q1 2020)).
Table 4: Annualised percentage change in the seasonally adjusted quarterly gross domestic product by industry
2019 Q1 2019 Q2 2019 Q3 2019 Q4 2020 Q1
Agriculture, forestry and fishing -16.8 -4.9 -4.5 -7.6 27.8
Mining and quarrying -10.8 17.4 -6.1 1.8 -21.5
Manufacturing -8.8 2.1 -4.4 -1.8 -8.5
Electricity, gas and water -7.4 3.2 -4.9 -4,0 -5.6
Construction -5.3 -2.4 -6.9 -5.9 -4.7
Wholesale, retail and motor trade; catering and -3.6 3.4 2.6 -3.8 -1.2
accommodation
Transport, storage and communication -4.4 -0.3 -5.4 -7.2 0.5
Finance, real estate and business services 1.1 4.1 1.6 2.7 3.7
General government services 2.5 3.3 2.4 -0.4 1.0
Personal services 1.1 0.8 0.4 0.7 0.5
Total value added at basic prices -3.2 3.5 -0.9 -1.3 -1.8
Taxes less subsidies on products -3.0 1.9 0.1 -3.0 -3.7
GDP at market prices -3.2 3.3 -0.8 -1.4 -2.0
Source: Statistics South Africa (GDP Q1 2020)
7Current economic performance by subsector
The impact of COVID-19 has been and is currently adversely experienced across the entire
Transport sector. Initially there was pressure on transport companies in terms of issues
relating to moving citizens, the pressure then shifted towards how the Transport sector will
keep the core transportation system operational with a skeleton workforce to ensure freight
and key essential workers can continue to move. A secondary effect of this shift is the sudden
change in sources of revenue for transport operators, as many are experiencing an
unexpected shortfall in their finances. Transport companies will have to plan ahead to ensure
that the transport network is ready for a return to normal operations when lockdown
measures are lifted (Dixon & Gause, 2020). Below is feedback from key stakeholders from the
virtual SSP workshops on the economic performance of the various subsectors.
Table 5: Current economic performance by subsector
Aerospace
Stakeholders indicated that the aerospace subsector has been one of the worst affected by the Covid-19
pandemic and the lock down, and is only getting a little relief now with the opening of the subsector locally
to four provinces. They stated that Covid-19 affected the subsector dramatically; it was the worst for airlines,
both for their workers and their owners. Economically, stakeholders indicated that it has been a disaster as
companies are in survival mode or business rescue, and that since airlines have only just began flying, it is
difficult for companies to know if this will bring in revenue.
Forwarding and Clearing
Stakeholders mentioned that one of the worst impacts of Covid-19 and the lockdown was on the ports and
the coastal harbours. Covid-19 exposed that companies were operating with bad service and had delay issues
with off-loading pre-Covid. It was the pandemic which exposed this very fragile service, and it has become an
absolute disaster of note, according to stakeholders. Secondly, generally this industry has very small margins
and that’s what companies existed on previously; therefore, those companies that think they can continue
operating with even smaller margins now have had to cut costs by retrenching staff. Third, Covid-19 has
advanced the fourth Industrial Revolution, as technologies have been fast-tracked, therefore companies can
no longer do business without understanding this technology. Many companies are working now on
implementing IT- related solutions, e.g. now that most loads of parcels are going to customers’ homes,
delivery personnel had to be trained to use the hand-held devices to capture proof of delivery (POD) and
customers can also track the parcels in transit. These are changes companies have to observe now because
digitalisation of many systems is where the whole world is moving to now, so the industry needs to be placing
greater emphasis on digitalization, and thus, the skills needed for this.
Freight Handling
Stakeholders indicated that freight handling companies were also negatively affected by the shutdown of
other industries, such as restaurants. Therefore, freight handling companies in those industries were not
operational during levels five and four of the lockdown, and many also experienced theft of their parked
trucks. There were some companies that were fortunate to be essential workers such as grocery stores, and
therefore their warehousing and distribution were still in operation. These employers however indicated that
this came with its own set of challenges, such as putting preventative health and safety measures in place or
having to use private taxi services to transport staff because of social distancing regulations placed on taxis
(which account for 60% of passenger transport). Also, these companies had to split business into shifts to
prevent cross contamination, and so that there is time for the cleaning staff to sanitize the stores between
shifts, canteens were also closed, and truck drivers were also carefully monitored, while extensive Covid-19
related training was conducted. All of these changes meant that additional costs were incurred by companies.
Some stakeholder explained that this is the reason that the cost of products went up because the supply chain
became more expensive.
Maritime
Stakeholders indicated that during the lock down Maritime industry companies had to cease all activity. This
stalled the contribution of the industry to the economy because supply chains had all ceased. Stakeholders
mentioned that all mariners were parked; while those that were at sea pre- Covid-19 lockdown, had to stay
at sea and were unable to change crews, while some were even quarantined in a multitude of countries,
8You can also read


