High Level Skills in Yorkshire and Humber: Understanding the Drivers of Change Phase 1 High Level Skills Context A Report to Yorkshire Futures ...
←
→
Page content transcription
If your browser does not render page correctly, please read the page content below
High Level Skills in Yorkshire and Humber:
  Understanding the Drivers of Change

    Phase 1 High Level Skills Context

      A Report to Yorkshire Futures

                  May 2010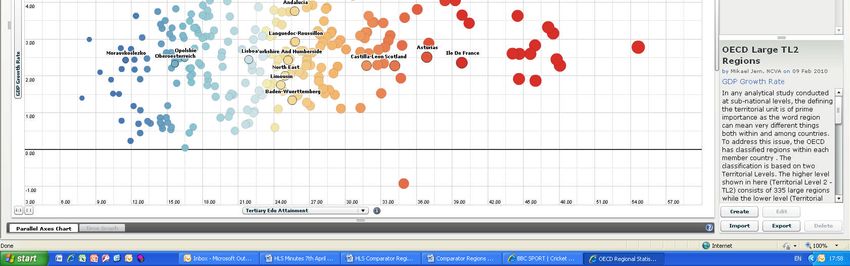
High Level Skills in Yorkshire and Humber: Understanding the Drivers of Change – Phase 1

Report submitted by: David Roberts, Tamara McNeill – ekosgen. Dr Peter Wells,
Richard Crisp, Tony Gore – CRESR.
Reviewed by: Tim Allan – ekosgen.
Date: 7 May 2010

Address: St James House, Vicar Lane, Sheffield, S1 2EX
Telephone No: 0845 644 5407
High Level Skills in Yorkshire and Humber: Understanding the Drivers of Change – Phase 1
TABLE OF CONTENTS
1 INTRODUCTION................................................................................................................ 1
2 HIGH LEVEL SKILLS: Y&H PERFORMANCE................................................................. 2
Introduction ............................................................................................................................ 2
The Role of the Supply Side in HLS Performance................................................................. 2
The Role of Demand in High Level Skills Performance....................................................... 11
The Drivers of Demand in Yorkshire and Humber............................................................... 13
Low Skills Equilibrium .......................................................................................................... 22
Conclusions and Emerging Implications .............................................................................. 24
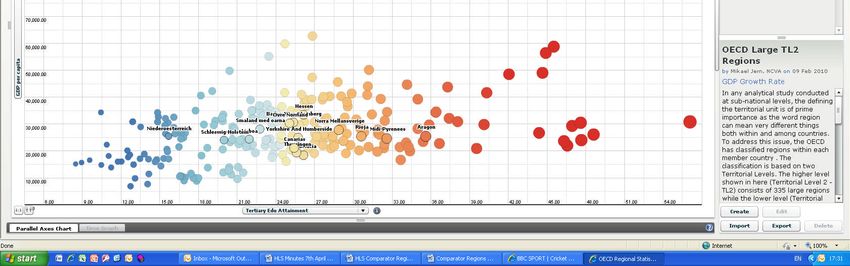
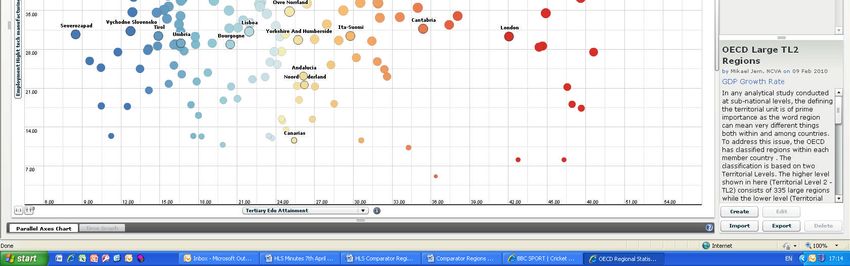
3 HIGH LEVEL SKILLS: REGIONAL COMPARATORS ................................................... 26
Introduction .......................................................................................................................... 26
Initial Review ........................................................................................................................ 26
Statistical Review of Comparator Regions .......................................................................... 32
Comparator Regions: History and Recent Development..................................................... 38
Key Emerging Messages ..................................................................................................... 47
4 HIGH LEVEL SKILLS: REVIEW OF MECHANISMS...................................................... 48
Introduction .......................................................................................................................... 48
Summary Assessment ......................................................................................................... 49
Overview of Intervention Evidence ...................................................................................... 51
Emerging Messages ............................................................................................................ 68
5 THE CONCEPTUAL FRAMEWORK ............................................................................... 71
Introduction .......................................................................................................................... 71
Developing the Conceptual Framework............................................................................... 72
6 CONCLUSIONS AND IMPLICATIONS ........................................................................... 79
ANNEX 1 BIBLIOGRAPHY .................................................................................................... 81
ANNEX 2 SOURCES FOR COMPARATOR REGION ANALYSIS........................................ 84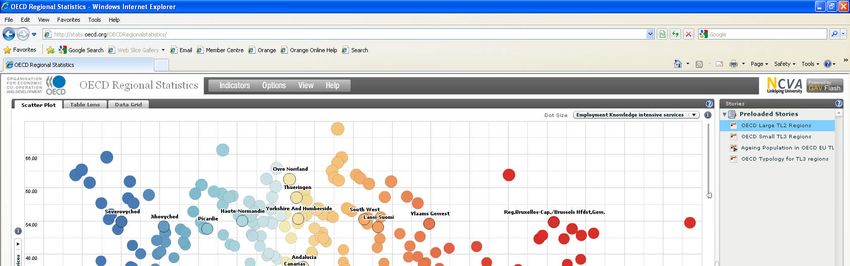
High Level Skills in Yorkshire and Humber: Understanding the Drivers of Change – Phase 1
1 Introduction
1.1 High level skills (HLS) appear to play a key role in the growth and productivity of economies.
As Yorkshire and Humber (Y&H) makes the transition to a knowledge-based economy, the extent to
which it is able to attract, develop and retain higher skilled workers will be a necessary, although not
necessarily sufficient, condition in generating more high value jobs.
1.2 For clarity, HLS are defined to be any qualification at Level 4 and above, both academic and
vocational, including professional qualifications and non-accredited Continuing Professional
Development qualifications.
1.3 The overall aim of this project is to assess the context for HLS development in Y&H. In doing
so, the study seeks to provide Yorkshire Futures and its partners with a greater insight into how the
growth in HLS can be accelerated and to understand which interventions are likely to be the most
effective. Sitting beneath this aim are the following objectives:
Conceptualising the HLS context in Y&H;
Identifying what works in both the HLS context and similar contexts; and
Drawing on the above to generate recommendations for policy intervention.
1.4 The research is being undertaken in two phases. The first phase, to which this report relates,
seeks to establish the regional context for HLS development, examining how Y&H performs and
reviewing the evidence on what works. Comparator analysis has also been undertaken to explore
what, if anything, Y&H can learn from skills development in other regions.
1.5 The second phase will seek to build on this analysis and apply a realist synthesis method of
evidence review to arrive at a series of policy implications. Findings from the second phase of the
work will be presented in a phase two report in August 2010.
1.6 This report is a high level summary which concentrates on examining the key evidence on
HLS. It is recognised that there is a wealth of evidence which may be directly or indirectly relevant.
Our focus has been on a series of specific key sources, set out in Annex 1. A detailed evaluation of
the effectiveness of existing interventions, for example Train to Gain, to boosting HLS in Y&H is
outside the scope of this review. Rather, the focus is on synthesising evaluation, academic and
practitioner evidence to generate a set of policy implications.
1
High Level Skills in Yorkshire and Humber: Understanding the Drivers of Change – Phase 1

2       High Level Skills: Y&H Performance

Introduction
2.1      Understanding the factors that influence HLS performance is central to this study. This
section of the report draws on academic literature and statistical evidence to examine the relationship
between supply (e.g. workforce qualifications) and demand (e.g. jobs in knowledge based industries)
factors. It also considers whether a low skills equilibrium exists in Y&H and the associated policy
implications.
2.2     It is recognised that the economic performance and structure of Y&H is not uniform. Where
appropriate, the key datasets are broken down into the four functional sub-regions (FSRs) of Sheffield
City Region, Leeds City Region, Hull and the Humber Ports City Region, and York and North
Yorkshire.

The Role of the Supply Side in HLS Performance
The National Picture

2.3      Until recently, UK policy on skills has centred on supply-side assumptions that aggregate
levels of skill to drive national economic performance (Keep, 2006; Payne 2008), although there are
tentative signs that this is changing, as outlined below. This assumed link between skills and
productivity has been premised on close examination of cross-national league tables of skill levels in
which Britain performs less well than some of its international competitors (Keep, 2006).
2.4      The diagnosis that flows from this has encouraged policymakers to focus on education and
training as a 'panacea' (Lloyd and Payne, 2003: 86) to a vast area of social and economic problems
including poor productivity and weak competitiveness. In terms of HLS, this has translated into
policies to expand higher education on the dual presumption that this will improve economic
performance and increase access to better jobs for those from lower socio-economic backgrounds
(Keep and Mayhew, 2004). A commitment remains to a target of 50% higher education participation
as recently reaffirmed in the Skills for Growth white paper (BIS, 2009). Critically, the shift from an elite
to a mass higher education system is seen by policymakers as not only satisfying existing demand
but also stimulating demand for better jobs from employers (Wilton, 2008). In other words, supply will
generate its own demand.
2.5      Policies to boost the supply of skills are justified on two grounds. Firstly, there is empirical
evidence to suggest growing demand for HLS. In reviewing the polarised opinions on the validity of a
supply side skills policy, Wilton (2008: 1-2) presents a series of studies that support the government’s
position by identifying a growing demand for qualifications, an increase in high-skilled jobs and a rise
in the utilisation of skills. Wilton also highlights research (see Purcell and Wilton, 2004) suggesting
that the expansion of higher education has not led to a deterioration in employment opportunities for
graduates or an over-supply of graduates. Moreover, Felstead et al.’s (2002) skills survey reported an
approximate balance between the supply of high level qualifications (Level 4 or above) in the
workforce and employers’ utilisation of these qualifications across the economy, despite imbalances
at other levels of qualification.
2.6     A second justification for boosting the supply of skills is the notion that the optimum supply
has not yet been achieved because of market failure. Keep (2006) identifies four categories of reason
used to explain why the market for skills may be subject to failure:

                                                                                                          2
High Level Skills in Yorkshire and Humber: Understanding the Drivers of Change – Phase 1
Imperfect information on the benefits of investing in learning or training on the part of both
employers and individuals;
Time preference, short-termism and risk aversion where individuals or firms fixate on the short-
term and ignore long-term benefits. This partly reflects the complexity of discounting future
benefits;
Capital market imperfections where problems may be encountered in obtaining funding for
investment. For example, individuals may struggle to secure personal loans needed to fund
education; and
Externalities where the wider benefits of skill formation are not fully captured by those investing
in it, thereby leading to a disinclination to invest. Employers, for example, may be reluctant to
train staff if they fear they may subsequently leave. Moreover, the wider spillover benefits of
training or education such as a more skilled workforce boosting national productivity may have
little impact on the investment decisions of individual firms.
Supply Side Characteristics in Y&H
2.7 The evidence from Y&H supports some but not all of these arguments. Below we examine
supply side dynamics. The four categories of market failure are considered in Chapter 4.
2.8 Looking at the key characteristics, 25% of the region’s working age population possessed a
qualification at NVQ4 or above in 2008, up from 19% a decade earlier. Increased participation in
higher education has been a key driver, but in spite of this growth, the region’s ranking dropped from
sixth to seventh of the nine English regions.
Table 2.1 Attainment of NVQ Level 4+ by Age Group, 2008, Rank
16-19 20-24 25-29 30-39 40-49 50-ret
East 8 3 6 4 5 7
East Midlands 7 5 9 6 6 5
London 6 1 1 1 1 1
North East 3 8 8 8 9 9
North West 6 4 5 5 4 6
South East 4 2 2 2 2 2
South West 5 7 3 3 3 3
West Midlands 2 9 4 9 7 8
Yorkshire & Humber 1 6 7 7 8 4
Source: Annual Population Survey, 2008, ONS.
2.9 The region’s ranking is broadly similar across age groups, with the exception of those aged
50 and over (see Table 2.2 overleaf). This suggests that lifestyle factors, particularly in York and
North Yorkshire, may act as a significant magnet to highly qualified people to reside in the region,
when career advancement opportunities are less of a consideration.
3
High Level Skills in Yorkshire and Humber: Understanding the Drivers of Change – Phase 1

 Table 2.2 Attainment of NVQ Level 4+ by Age Group, 2008, %
                                  16-19          20-24            25-29       30-39        40-49       50-ret
 East                               0.7           22.7            32.3        32.6         28.1        25.7
 East Midlands                      1.0           19.5            31.3        31.6         28.1        26.2
 London                             1.1           32.0            51.9        47.7         37.6        33.5
 North East                         1.4           18.7            31.9        30.7         25.7        23.8
 North West                         1.1           19.8            32.5        31.9         28.8        25.9
 South East                         1.3           22.9            37.4        39.6         35.4        31.8
 South West                         1.3           18.8            34.7        35.0         31.7        30.2
 West Midlands                      1.9           18.0            33.4        29.8         27.0        24.9
 Yorkshire & Humber                 2.3           19.0            32.0        31.2         26.5        26.6
 Functional Sub-region
 Leeds CR                           1.5           20.5            34.5        31.7         27.1        27.6
 Hull & Humber Ports CR             1.4           13.8            21.3        28.1         23.7        21.6
 York and N Yorkshire               1.2           21.2            39.2        43.0         34.8        35.2
 Sheffield CR                       2.3           14.8            30.2        29.5         26.7        26.8
 Source: Annual Population Survey, 2008, ONS.

2.10    Within Y&H, the Hull and the Humber Ports City Region performs relatively poorly. Low levels
of educational attainment, although improving, feed through into poor progression into higher
education and a local economy which has too few businesses which demand HLS and qualification
levels.

2.11    At an FSR level, York and North Yorkshire has a higher proportion of its working age
population with HLS than any other English region, excluding London (see Tables 2.2 and 2.3). For
the Leeds City Region, the profile suggests a strong initial level of graduate retention followed by a
leakage of higher skilled individuals elsewhere. This is explored further below.

 Table 2.3 Household Qualifications and Skills, % of respondents
                                             Hull and
                                             Humber                        York and     Sheffield
                                            Ports City        Leeds City     North        City
                                             Region            Region      Yorkshire     Region        Y&H
 Fewer than 5 GCSEs/ NVQ Level 1                18.8             18.2        17.1          18.9        18.2
 5+ GCSEs (grade A* - C) or equiv.              26.5             28.9        32.9          27.2        28.1
 NVQ Level 2, Intermediate GNVQ                 11.4             10.7         9.7          12.2        11.1
 2+ A levels, 4+ AS Levels or equiv.            13.3             17.0        20.4          14.7        15.9
 Trade Qualifications                           18.2             17.1        20.1          17.3        17.3
 NVQ Level 3, OND, Advanced GNVQ                8.7              7.8          8.5          8.4          8.1
 NVQ Level 4 or 5, HNC, HND                     6.2              6.0          7.4          5.9          6.1
 First Degree                                   14.5             18.0        22.5          14.7        16.7
 Postgraduate Qualification e.g. MA             5.4              7.1          8.9          5.7          6.6
 No qualifications                              14.5             13.0        10.8          14.5        13.6
 Source: Acxiom, 2009. Copyright © 2010 Acxiom Corporation.

                                                                                                                4
High Level Skills in Yorkshire and Humber: Understanding the Drivers of Change – Phase 1

2.12    There is a natural increase in the demand for training as individuals become more qualified
themselves. One in five of the Y&H workforce is considering training in the next 12 months which is
close to the national average (see Table 2.4). The differences between qualification levels, with the
exception of those having no qualifications, are not substantial, suggesting that efforts to stimulate
employee engagement in learning are likely to be equally effective across a number of groups in the
labour market.

 Table 2.4 Demand for Skills Development (% considering training)
                     NVQ Level         NVQ Level      NVQ Level       NVQ Level         Up to
                        1 or              2 or           3 or          4 or 5 or       Degree/
                     equivalent        equivalent     equivalent      equivalent       Postgrad         No Quals
 North West             19.0              21.8           22.3            23.0            23.0              6.9
 North East               16.9            21.4              24.1         24.4             23.7            6.2
 East Midlands            18.9            21.1              22.0         22.8             22.8            6.3
 West Midlands            20.9            23.0              23.9         24.3             24.0            7.9
 East                     17.2            19.1              20.9         21.6             21.5            6.0
 London                   24.1            25.9              27.4         28.5             28.2            10.2
 South East               17.5            19.0              20.2         21.0             20.7            6.0
 South West               17.1            19.4              21.1         22.0             21.8            5.3
 Y&H                      20.4            21.8              22.7         23.2             22.8            7.7
 England                  19.2            21.3              22.5         23.3             23.2            7.0
 Source: Acxiom, 2009. Copyright © 2010 Acxiom Corporation.

2.13    Possession of some of the components of HLS varies across Y&H but not by as much as
might be expected given the relative differences in qualifications attainment. Team working, customer
care and management skills are the most in demand in Y&H (see Table 2.5).

 Table 2.5 Skills Self Assessment
                                  Hull and                          York and
                                  Humber                              North
                                 Ports City      Leeds City         Yorkshire      Sheffield City
                                  Region          Region           Sub-Region        Region              Y&H
 Marketing                         9.4%             11.1%            13.3%             9.5%             10.4%
 Team Working                     26.9%             28.9%            30.1%            26.6%             27.9%
 Selling                          14.6%             16.0%            17.0%            14.7%             15.4%
 Customer Care                    22.6%             25.0%            26.2%            23.2%             24.1%
 Microsoft Office                 19.3%             22.5%            23.0%            19.7%             21.1%
 Management                       21.4%             23.5%            27.3%            21.1%             22.5%
 Communications                   19.7%             21.6%            23.3%            19.6%             20.8%
 Clerical / Secretarial           18.1%             19.6%            20.1%            17.9%             18.8%
 No Response                      62.9%             60.5%            58.4%            63.5%             61.7%
 Source: Acxiom, 2009. Copyright © 2010 Acxiom Corporation.

2.14      However, data from the Acxiom 2009 household survey suggests that more than nine in ten
residents do not have a strong desire to develop work-related skills in a wide range of service related
activities (see Table 2.6), suggesting that interventions focused on boosting individuals’ aspirations
and demand for training are unlikely to play to a receptive audience, and will need to be targeted.

                                                                                                                   5
High Level Skills in Yorkshire and Humber: Understanding the Drivers of Change – Phase 1
Where a desire was expressed, the strongest motivations were to develop management and/or IT
skills.
Table 2.6 Skills Development Aspirations
Hull and York and
Humber North
Ports City Leeds City Yorkshire Sheffield City
Region Region Sub-Region Region Y&H
Marketing 2.4% 2.9% 2.4% 2.5% 2.7%
Team Working 1.8% 2.0% 1.6% 1.9% 1.9%
Selling 1.8% 2.1% 1.7% 1.7% 2.0%
Customer Care 2.0% 1.9% 1.5% 1.8% 1.9%
Microsoft Office 3.2% 3.5% 3.1% 3.4% 3.4%
Management 3.3% 4.0% 3.0% 3.5% 3.7%
Communications 2.1% 2.3% 1.7% 2.1% 2.2%
Clerical / Secretarial 2.3% 2.4% 2.0% 2.2% 2.3%
None 92.9% 92.0% 93.4% 92.6% 92.4%
Source: Acxiom, 2009. Copyright © 2010 Acxiom Corporation.
2.15 It is also the case that a much lower proportion of the Y&H workforce would consider
changing career than is the case nationally. This characteristic is largely replicated across the four
FSRs. The ICT sector was highlighted as the most likely avenue for job movers, which links to the
identification of IT skills as an area for development. Overall, however, motivations appear relatively
modest.
Table 2.7 Career Aspirations*
York and
Hull and North
Humber Yorkshire
Ports City Leeds City Sub- Sheffield
Region Region Region City Region Y&H
Career change to: IT 4.3% 4.8% 3.5% 4.6% 4.6%
Career change to: Bookkeeping 2.1% 2.1% 1.9% 2.1% 2.1%
Career change to: Plumbing 2.7% 2.7% 2.2% 2.4% 2.6%
Career change to: Electrical 1.7% 2.1% 1.6% 2.1% 2.1%
Source: Acxiom, 2009. Copyright © 2010 Acxiom Corporation. *aspirations of those who identified a desire to change
career.
2.16 Looking at the graduate labour market, the region fares modestly in retaining graduates from
its HE institutions in the immediate period following graduation, ranking sixth of the nine English
regions with a retention rate of 57% at six months (see Chart 2.1). At 64%, the post-graduate
retention rate is higher. Retention of science graduates is higher than the graduate cohort as a whole,
reflecting perhaps the availability of both employment and further research opportunities in the region.
6High Level Skills in Yorkshire and Humber: Understanding the Drivers of Change – Phase 1
Chart 2.1 Graduate Retention After 6 Months, 2002/2003 to 2006/7 Pooled
Source:HESA
Yorkshire & Humber
Studied & Worked in Region
West Midlands
after 6 months -
Postgraduates
South West
Studied & Worked in Region
after 6 months - Graduates
South East
North West
North East
London
East Midlands
Eastern England
0 10 20 30 40 50 60 70 80
% of graduates
2.17 Comparing initial destination and work location suggests that there is something of a
mismatch between graduate supply and demand in the region - between 2002 and 2007, Y&H
accounted for 10.2% of graduates in the UK but only 8.2% of graduate jobs (not taking account of
graduate-underemployment), an outflow of 20,000 people (see Table 2.8).
Table 2.8 Initial Graduate Labour Flows, 2002/3 to 2006/7, pooled
% of graduates remaining in region after 6 % of graduate workers in the
months region who studied in the region
East 60 35
East Midlands 43 62
London 72 42
North East 62 79
North West 70 60
South East 42 54
South West 57 59
West Midlands 53 62
Yorkshire & Humber 57 71
Source: HESA from analysis conducted by the University of Strathclyde.
2.18 The data also reinforces the pull of London as a graduate destination – 85,000 more
graduates began work in London between 2002 and 2007 than graduated from London’s HE
institutions over the same period. However, only the North East has a higher share of graduate
workers who studied in the region than Y&H.
2.19 Part of this dynamic relates to the link between home domicile and place of study (see Table
2.9). Y&H possesses above average proportions of residents at its universities, but these students
account for a much smaller share of its undergraduate population. The suggestion is that Y&H is a
7High Level Skills in Yorkshire and Humber: Understanding the Drivers of Change – Phase 1
more popular place to study than it is to remain in to work and the region loses a large number of
students who originated from other regions following graduation.
Table 2.9 Initial Undergraduate Study Destinations, 2002/3 to 2006/7
% of students studying in % of the students in the region’s
their own region HEIs drawn from that region Balance
East 26 56 +30
East Midlands 45 35 -10
London 51 62 -9
North East 67 51 -16
North West 51 60 +9
South East 46 41 -5
South West 49 51 +2
West Midlands 51 48 -3
Yorkshire & Humber 58 41 -17
Source: HESA from analysis conducted by the University of Strathclyde.
2.20 Just over two in five of the region’s undergraduates are still in Y&H (or have returned from
elsewhere) three years after graduation (see Chart 2.2). This places Y&H in the mid rank of the nine
English regions. In contrast, retention rates for post graduates are comparatively good.
Chart 2.2 Medium Term Graduate Destinations, 2002/3 Graduates
Source: HESA
Yorkshire & Humber
Studied & Worked in after 36 months -
West Midlands Undergraduates
Studied & Worked in after 36 months -
Postgraduates
South West
South East
North West
North East
London
East Midlands
Eastern England
0 10 20 30 40 50 60 70 80
% of graduates
2.21 Again, insufficient demand or availability of career options appears to act as the key driver –
the data upon which chart 2.2 is based shows that there were 56% more graduates from Y&H
universities than graduates in employment in Y&H. This pattern is mirrored across the regions of the
north and the midlands but appears particularly stark in Y&H (see Table 2.10).
8High Level Skills in Yorkshire and Humber: Understanding the Drivers of Change – Phase 1
Table 2.10 Medium Term Graduate Labour Flows, 2002/3 cohort
% of graduates remaining in % of workers in the region
region after 36 months who studied in the region Balance
East 38 31 -7
East Midlands 35 52 +17
London 71 33 -38
North East 50 56 +6
North West 60 52 +12
South East 36 45 +9
South West 47 49 +2
West Midlands 43 57 +14
Yorkshire & Humber 42 66 +24
Source: HESA from analysis conducted by the University of Strathclyde.
2.22 Whilst it should be recognised that the results represent a snapshot in time, they nonetheless
provide a useful insight into the relationship between HE and the Y&H economy. A notable contrast is
apparent with the North West, where the total number of graduates in work after three years exceeds
the number of students who studied at North West universities.
2.23 Looking now at occupational structures (Table 2.11), there is evidence that Y&H is evolving.
Y&H has experienced significant growth in higher order occupations (SOC1-2) over the past decade,
with the share of the workforce now 26.1% compared to 23% in 1998.
Table 2.11 Occupational Structure, 2008, % of workforce
NE NW Y&H EM WM EE L SE SW
Managers/S Officials 13.2 15.0 14.4 15.5 14.7 17.0 17.8 17.6 16.5
Professional 11.5 11.5 11.7 11.3 12.1 13.1 17.0 14.5 11.9
SOC 1-2 24.7 26.5 26.1 26.8 26.8 30.1 34.8 32.1 28.4
Assoc Profess Trades 13.1 13.9 12.7 12.3 12.7 14.4 18.9 15.6 14.4
Admin & Secretarial 11.5 12.2 11.4 10.8 11.9 11.2 11.8 11.3 10.9
Skilled Trades 11.0 10.9 11.3 12.0 11.9 11.3 7.4 10.0 12.3
SOC 3-5 35.6 37.0 35.4 35.1 36.5 36.9 38.1 36.9 37.6
Personal Services 8.7 8.4 8.3 8.4 8.1 8.0 7.3 7.7 8.8
Sales/Customer Serv 9.0 8.1 8.3 7.8 7.6 7.0 6.2 7.4 7.9
Process & Machine
Operative 8.9 8.4 8.8 8.7 8.5 7.1 4.2 5.4 6.0
Elementary 13.0 11.7 12.9 13.2 12.4 10.9 9.4 10.5 11.3
Source: Annual Population Survey, 2008, NOMIS
2.24 The rate of change, however, has not been sufficient to alter Y&H’s ranking relative the other
English regions (see Table 2.12). With the bulk of the 2030 workforce already in employment, this
reinforces the need to boost workforce development.
9High Level Skills in Yorkshire and Humber: Understanding the Drivers of Change – Phase 1
Table 2.12 Occupational Structure, 2008, % of workforce, Rank
NE NW Y&H EM WM EE L SE SW
Managers/S Officials 9 6 8 5 7 3 1 2 4
Professional 7 8 6 9 4 3 1 2 5
Assoc Profess Trades 6 5 7 9 8 4 1 2 3
Admin & Secretarial 4 1 5 9 2 7 3 6 8
Skilled Trades 6 7 4 2 3 5 9 8 1
Personal Services 2 3 5 4 6 7 9 8 1
Sales/Customer Serv 1 3 2 5 6 8 9 7 4
Process & Machine
Operative 1 5 2 3 4 6 9 8 7
Elementary 2 5 3 1 4 7 9 8 6
Source: Annual Population Survey, 2008, ONS. 1= highest %; 9 = lowest %.
2.25 Looking forward, the growth in higher order occupations is forecast to continue in Y&H,
although this will be at a slower rate than in the UK as a whole (see Table 2.13).
Table 2.13 Current and Forecast Occupational Structure, % of workforce
2010 2026 Y&H Relative to UK
SOC Major Group Y&H UK Y&H UK 2010 2026
Managers and Senior Officials 15.3 16.3 16.6 17.3 -1.0 -0.7
Professional Occupations 12.0 13.0 11.6 13.1 -1.0 -1.5
Associate Prof. and Technical 13.5 14.8 14.0 15.4 -1.3 -1.4
Administrative and Technical 11.4 11.8 10.6 11.1 -0.5 -0.5
Skilled Trades 10.0 10.4 10.1 9.6 -0.4 0.5
Personal Service 7.6 8.2 7.4 8.5 -0.6 -0.9
Sales and Customer Service 8.3 7.4 9.3 7.7 0.9 1.6
Process, Plant Operatives 8.9 7.1 7.8 6.8 1.8 1.0
Elementary 12.9 10.9 12.6 10.5 2.0 2.1
Source: Yorkshire Forward Regional Econometric Model.
2.26 The forecast data suggests that by 2026 the overall pattern will be broadly similar to 2010
with the following key differences:
Growth in the proportion employed in two of the top three categories in Y&H but a decrease in
the proportion employed in professional occupations; this category will become more
significantly under-represented within the region compared to the UK; and
A smaller proportion of people in the bottom two groups, coupled with a reduction in the over-
representation compared with the rest of the UK.
10High Level Skills in Yorkshire and Humber: Understanding the Drivers of Change – Phase 1
The Role of Demand in High Level Skills Performance
The National Picture
2.27 The assumed relationship between skills and productivity, and the supply side focus on
boosting skills has been challenged on two key grounds. Firstly, critics point towards evidence which,
it is claimed, shows that the demand for HLS is not as high as often assumed. This centres on the
assertion that there is currently an over-supply of graduates relative to demand. Keep and Mayhew
(2004: 310), for example, have suggested that this fixation on expanding supply ‘without due prior
consideration of whether expansion is necessary or desirable’ is flawed because the supply of
graduates is ‘massively outstripping’ local demand for graduate labour in knowledge-intensive
1.
industries outside of lowland Scotland, London and the South–East
2.28 The result is that graduates either migrate out of the region or take jobs that would previously
have been occupied by school leavers (Hepworth and Spencer cf. Keep and Mayhew, 2004).
Elsewhere, Keep (2006: 13) has presented further evidence of over-qualification within the British
workforce, with 37% of employees holding qualifications higher than needed for their current job in
2
2001 compared with 29 per in 1986 . Brown et al. (2008) have also suggested that falling numbers of
UK-domiciled students studying STEM (Science, Technology, Engineering and Maths) subjects may
be a reflection of over-supply relative to domestic demand. This evidence is supported by the analysis
of the supply side characteristics in Y&H presented above.
2.29 Further evidence that there is oversupply of skills relative to demand is provided by skills
surveys of Britain (cf. Keep, 2008) and Scotland (cf. Payne, 2009) indicating that over a third of
employees in both areas feel they are over-qualified relative to the demands of their job.
2.30 Moreover, those who challenge the government’s supply-side focus have suggested there is
little evidence that future economic growth will create sufficient demand in knowledge-intensive
industries to soak up the expanding supply of graduate labour. Keep and Mayhew (2004) have
observed, for example, that optimistic accounts of future growth in high-skilled jobs is based on a
misreading of projections of the number of new jobs that will demand an HE qualification. They argue
that this is often conflated with the total demand for graduates without recognising that these
projections do not take into account the existing stock of jobs, many of which require lower levels of
skills. Brown et al. (2008: 18) also cite evidence from the Skills at Work survey suggesting that the
increase in supply of graduates continues to outpace the growth of jobs perceived by jobholders to
require a degree (Brown et al, 2008: 18). At the same time, the acceleration of demand for
knowledge workers in the 1980s has now plateaued, with little expectation of further acceleration in
the near future. Between 1981 and 1991, the rate of increase in employment for knowledge workers
(27%) was over four times that of the growth in the total number of jobs in the UK economy (6%).
However, this rate of change has not been maintained since with growth figures for knowledge work
falling continuously to reach 11% compared with 6% for all jobs in 2005-07 (ibid.: 20).
2.31 Lloyd and Payne (2003) also challenge claims that the UK is witnessing the growth of a
'knowledge economy' premised on the 'high performance workplace' that could accommodate a more
highly-skilled workforce. They observe that whilst there may be long-term growth in professional and
technical workers, there is concurrent growth in less-skilled occupations such as waitresses, care
1
The source of this claim is Hepworth, M. and Spencer, G. (2002) A Regional Perspective on the Knowledge
Economy in Great Britain. London: Department of Trade and Industry.
2 nd
According to figures from the 2 Skills Survey : Felstead, A, Gallie, D. and Green, F. (2002) Work Skills in
Britain 1986-2001. Nottingham: DFES.
11High Level Skills in Yorkshire and Humber: Understanding the Drivers of Change – Phase 1
assistants, sales persons, shelf-fillers and cleaners. Brown et al. (2008: 49) also contest the view that
increasing the supply of higher educated employees will 'generate its own demand' by highlighting
evidence that UK employers do not seem to be modifying the skill level of jobs in response to the
greater availability of graduates. The extent to which these characteristics are evident in Y&H is
considered in more detail below.
2.32 There is evidence, however, of skills shortages within particular sectors and occupations,
3
even if aggregate supply outstrips demand. The 2009 National Skills Survey for England found that
4
the highest level of skill-shortage vacancies (SSVs) were evident in Electricity Gas and Water sector
(7% of employers) followed by Hotels and Catering; Education; and Health and Social Work (4%
each).
2.33 Evidently, figures for sectors include vacancies demanding all levels of skill. A better insight
into HLS shortages can be gained by looking at the data on occupations, with approximately one fifth
of all vacancies identified nationally for professionals (19%), associate professionals (20%) and
managers and senior officials (19%) attributed to skills shortages.
2.34 Commentators have noted that there may be unintended consequences if policymakers
continue to boost the supply of HLS without a concurrent rise in demand. Keep and Mayhew (2004)
suggest this could impact negatively on the prospects of non-graduates if employers recruit graduates
for jobs that only require Level 3 skills. Moreover, Brown et al. (2008) also observe that the expansion
of higher education may reduce the average returns to a degree (as measured by lifetime earnings) if
it is not matched by a growth in jobs offering high wages. Recent data shows that there are already
significant differences in the returns to a degree within the graduate population, with the benefits of
graduate-level education actually declining over time for those at the bottom end of residual wage
distribution (ibid., 2008: 45). This decline is attributed to a rise in levels of over-qualification that has
seen a sharp increase in the costs of being over-qualified for those who do end up in jobs requiring a
degree. In a Y&H context, this study has not been able to find substantial evidence of employers
reporting graduate recruitment difficulties.
2.35 A second challenge to the supply-side focus on boosting skills focuses on the limitations of
‘market failure’ as an explanation for sub-optimum levels of skills. Keep (2006: 5) claims that the
evidence base on the incidence of market failure is ‘extremely patchy’ in terms of, for example, the
scale of poaching. There is also very little research which goes below national-level analyses to
attempt a more fine-grained analysis of market failure within different sectors of the economy.
According to Keep (ibid.) this encourages crude ‘one-size-fits-all’ policy responses.
2.36 In particular, Keep (2006) argues that there are two key difficulties with the concept of market
failure:
Firstly, it overlooks the other factors which combine with skills to deliver economic performance
including, for example, investment in plant and machinery;
Secondly, it fails to recognise that employer decisions not to invest in skills may not be driven
by market failure. Firms may introduce forms of work organisation that minimise skill needs or
adhere to low commitment to forms of employee relations if they believe that training may have
3
Figures taken from UKCES (2010) National Employer Skills Survey for England 2009: Key findings report.
4
A subset of vacancies classified as hard-to-fill where the reason given for difficulty filling the position was a low
number of applicants with the required skills, work experience or qualifications.
12High Level Skills in Yorkshire and Humber: Understanding the Drivers of Change – Phase 1
adverse effects such as raising unrealistic expectations about pay and progression as well as
increasing dissatisfaction with repetitive work.
2.37 A separate review of vocational and educational training by Keep and Mayhew (1999: 4)
characterises these impediments as ‘systems failure’ rather than ‘market and administrative failures’
within a scenario ‘where employers were reacting rationally to a battery of incentives provided by the
institutions and attitudes they inherited’. In other words, employers were not inhibited from realising
the optimal level of training by concerns about ‘poaching’ but, rather were responding positively to
incentives to produce using a low-skill model. The specific evidence on systems failure in Y&H is
limited, although in the section below we discuss the extent to which a low skills equilibrium exists in
the region.
The Drivers of Demand in Yorkshire and Humber
2.38 As economic restructuring has taken place, the concentration of HLS has become
increasingly intertwined with the structure of the business base, the number of jobs in knowledge
based industries and other key characteristics. Whilst start up rates have improved, Y&H retains a
significant enterprise deficit with better performing regions (see Table 2.14).
2.39 The region’s industrial legacy remains apparent, with large firms continuing to account for a
higher share of the business base than nationally. Many of these firms historically invested
significantly in workforce development, so the continuing rationalisation of the manufacturing sector
poses significant challenges for in-firm activities to develop HLS.
Table 2.14 Comparative Business Density
No. of Businesses Per 1,000 inhabitants
East 38.0
East Midlands 33.4
London 44.5
North East 22.3
North West 30.8
South East 40.3
South West 38.9
West Midlands 32.7
Yorkshire & Humber 29.2
England 35.8
Source: Neighbourhood Statistics and Mid-Population Estimates, ONS. All VAT and/or PAYE Based Enterprises
2.40 Enterprise options are only considered by a small proportion of the workforce in Y&H, with a
clear link to the existing rates of business start up and the stock of HLS in the workforce (Table 2.15).
This suggests that productivity growth and HLS are more likely to be driven through the development
of established non-micro firms. With the exception of the York and North Yorkshire Sub Region, the
situation is across the FSRs is reasonably similar.
13High Level Skills in Yorkshire and Humber: Understanding the Drivers of Change – Phase 1
Table 2.15 Enterprise Potential in Y&H
% Self Employed / Running % Thinking About Starting
Own Business New Business
Hull and Humber Ports City Region 8.0% 1.6%
Leeds City Region 9.2% 2.4%
York and North Yorkshire City Region 12.7% 2.3%
Sheffield City Region 7.6% 2.0%
Yorkshire & Humber 8.8% 2.2%
Source: Acxiom, 2009. Copyright © 2010 Acxiom Corporation.
2.41 Yorkshire and Humber is characterised by a growing knowledge economy, albeit
concentrated in a small number of sub-sectors. Overall, growth in knowledge base industries (KBIs)
has been slower than better performing regions, thereby dampening the demand for HLS (see Table
2.16). It should also be noted that some of the manufacturing niches which make up the KBI definition
and where Y&H is strong, possess substantial numbers of roles which do not require HLS.
Table 2.16 Knowledge Economy Density
Employee Jobs in KBI % of total Ranking
East 444,381 18.6 6
East Midlands 299,935 15.9 9
London 1,173,366 28.1 1
North East 180,483 17.5 7
North West 586,915 19.5 3
South East 794,920 21.2 2
South West 424,210 18.9 4
West Midlands 387,525 16.5 8
Yorkshire & Humber 418,913 18.8 5
Sheffield CR 134,994 19.0
Leeds CR 246,327 19.6
Hull and the Humber Ports CR 55,108 15.2
York and North Yorkshire FSR 56,173 16.3
Source: Annual Business Inquiry, 2008, ONS.
2.42 The other notable feature of KBI employment in Y&H, as in the other northern regions, is the
large share accounted for by the public sector – 42% of KBI jobs in 2008, compared with 30% in the
South East and 20% in London. This raises a number of points:
First, the growth in the public sector has provided opportunities for graduates and other skilled
individuals which might not otherwise have been available – it is estimated by Graduates
Yorkshire that 50% of Y&H’s graduates enter jobs in the public sector;
Second, the public sector generally has a good track record in investing in employee
development;
On the downside, however, this picture masks the mixed performance on the growth in private
sector KBIs and the extent to which crowding out effects may be apparent. Constraints on
public sector expenditure in the medium-term also mean that this growth is unlikely to continue.
14High Level Skills in Yorkshire and Humber: Understanding the Drivers of Change – Phase 1
2.43 The correlation between HLS and the knowledge economy at a regional level is strong but not
overwhelming (see Chart 2.3). This reinforces some of the national evidence in relation to skills
utilisation and the extent to which HLS supply acts to influence demand.
Chart 2.3 Higher Level Skills and the Knowledge Economy
Source: ABI and APS, ONS
45
NVQ4+ % employed in KBIs
40
35
30
% of workforce
25
20
15
10
5
0
London South South East North East Yorkshire West North East York and Leeds City Sheffield Hull and
East West West Midlands and The Midlands North Region City the
Humber Yorkshire Region Humber
FSR Ports CR
2.44 There is evidence that higher order occupations are also coalescing around the knowledge
economy sectors in the better performing regions. This is most apparent in London. Within Y&H, the
relationship appears quite strong in the Leeds City Region, with the apparent mismatch in York and
North Yorkshire accounted for in part by commuting patterns (see Chart 2.4).
Chart 2.4 Higher Order Occupations and the Knowledge Economy
Source: ABI and APS, ONS
40
% share of SOC 1-2
% employed in KBIs
35
30
25
% of workforce
20
15
10
5
0
East North East Yorkshire West North West South West East of South East London Leeds City Sheffield City York and Hull and the
Midlands and the Midlands England Region Region North Humber
Humber Yorkshire Ports
15High Level Skills in Yorkshire and Humber: Understanding the Drivers of Change – Phase 1
2.45 Encouraging firms to invest in workforce development in Y&H remains a major challenge. Of
the nine English regions, Y&H possesses the smallest share of firms with a formal commitment to
employee training (see Chart 2.5 – North West is used as a comparator given its similar industrial
structure to Y&H). This is largely down to the approach of small businesses. Medium sized and larger
firms in Y&H are as proactive in workforce development as in any other region.
Chart 2.5 Existence of a Training Plan
Source: RDA National Business Survey 2009 Don't know/No answer No Yes
England
North West
Y&H
0 10 20 30 40 50 60
% of firms
2.46 Linked to this, uptake of national accreditations and workforce development support services
in Y&H is mixed, albeit on a par with trends nationally. On most of the indicators the region is ranked
in the bottom half of the English regions (see Chart 2.6).
Chart 2.6 Participation in Training Activties in the Last 12 Months
Source: RDA National Business Survey, 2009
Yorkshire and Humber
North West
Investors in People England
Apprenticeships
Train to Gain
Training (ext)
Training (intl)
0 10 20 30 40 50 60 70 80
% of firms
16High Level Skills in Yorkshire and Humber: Understanding the Drivers of Change – Phase 1
2.47 Firms of all sizes in Y&H report fewer skills shortages than elsewhere, highlighting (at a broad
level) at least a better level of market equilibrium (see Chart 2.7). Whilst this may reflect labour
availability due to the recession, analysis of previous years’ data suggests a similar picture.
Chart 2.7 % of Firms With Hard to Fill Vacancies
Source: RDA National Business Survey 2009
East
EM
L
NE
SE
SW
WM
Eng
NW
Y&H
1 3 5 7 9 11 13 15 17
% of firms
2.48 In occupational terms, the evidence from the latest National Employer Skills Survey indicates
that higher order occupations in Y&H are no less difficult to recruit to than either the North West or
England as a whole. As nationally, recruiting associate professionals remains the most problematic,
although the proportions of employers in all of the categories is very low.
Chart 2.8 Hard to Fill Vacancies By Occupation
Source: NESS 2009
0.8%
0.7% 0.7%
0.7% 0.6%
0.6%
0.6%
% of employers
0.5% 0.5% 0.5%
0.5% 0.5%
0.5%
0.5%
0.4%
0.4%
0.4% 0.4%
0.4%
0.3% 0.3% 0.3%
0.3%
0.3% 0.3%
0.3% 0.3% 0.3% 0.3%
0.2%
0.2% 0.2%
0.1%
0.1%
0.1%
0.0%
Manager Professional Assoc Admin Skilled trade Personal services Sales Machine operator Elementary
professional
Yorkshire and Humber North West National
17High Level Skills in Yorkshire and Humber: Understanding the Drivers of Change – Phase 1
2.49 Sectoral skills shortage evidence also presents a mixed picture. As shown in charts 2.9 and
2.10, Y&H struggles comparatively in the creative industries, fashion and textiles, passenger transport
and food manufacture. Given these sectors are characterised by a broad occupational structure, the
bulk of the gap is likely to relate to intermediate and lower level skills.
Chart 2.9 Smaller Skills Gaps
Source: NESS 2009, top five best performing SSC sectors relative to national levels
30%
26.7%
26.2%
25%
22.8%
22.2%
21.2%
% of employers
19.7%
20% 19.0% 19.1%
18.2%
16.3% 16.3%
15%
12.9% 12.7% 12.9%
9.7%
10%
5%
0%
Asset Skills e-skills UK People 1st Skills for Care and Development Skillsmart Retail
Yorkshire and Humber North West National
Chart 2.10 Bigger Skills Gaps
Source: NESS 2009, top five worst performing SSC sectors relative to national levels
30%
27.3%
25.6%
25.2%
25%
23.3% 23.1% 23.1%
21.7%
% of employers
19.8%
20%
17.8%
16.5%
15.9%
15.5%
15.1%
15%
13.3%
10.5%
10%
5%
0%
Improve Cogent Skillfast-UK Skillset GoSkills
Yorkshire and Humber North West National
2.50 Firms in Y&H have been less likely than firms on average to cut back on training expenditure
over the past year and the majority are expected to maintain investment over the next year (see Chart
18High Level Skills in Yorkshire and Humber: Understanding the Drivers of Change – Phase 1
2.11). This suggests that investment in workforce development in Y&H is not as cyclical as had been
previously thought. A significant net balance (those whose anticipate increasing investment minus
those who anticipate decreasing investment) of firms in the 10-50 employee size range is apparent.
Chart 2.11 Forecast Investment in Training in the Next 12 Months
Source: RDA National Business Survey, 2009
Same Lower Higher
Eng
NW
Y&H
0 5 10 15 20 25 30 35 40 45
% of firms
2.51 Employment and output forecasts suggest that the region is in line for a slow recovery and
widening of the gap with the UK average. Having fared badly during the recession, the number of FTE
jobs in the region is not expected to reach 2007 levels until 2019 at the earliest (see Chart 2.12).
Chart 2.12 FTE Employment 2007-2026 FTE Employment Decline:
Source: Yorkshire Forward REM 2009 Y&H: -5.5%, -121,012
UK: -3.8%, -1,003,394
110
105
Index (2007=100)
100
95
90
85
2001 2002 2003 2004 2005 2006 2007 2008 2009 2010 2011 2012 2013 2014 2015 2016 2017 2018 2019 2020 2021 2022 2023 2024 2025 2026
UK Yorks and Humber
19High Level Skills in Yorkshire and Humber: Understanding the Drivers of Change – Phase 1
2.52 Significant sub-regional differences are apparent (see Chart 2.13). York and North Yorkshire
is expected to weather the recession fairly well and build on its significant growth in the early part of
the 2000s. A deeper recession is evident in West Yorkshire but faster growth is expected from 2012
onwards, in part due to its greater economic diversity. For South Yorkshire and Hull and the Humber
5
Ports, only very slow growth is expected .
Chart 2.13 FTE Employment 2007-2026 FTE Employment Decline:
Source: Yorkshire Forward REM 2009 Hu: -5.6%, -20,260 NY: -1.6%, -6,134
SY: -7.2%, -37,929 WY: -7.1%, -64,930
110
105
100
Index (2007=100)
95
90
85
80
75
2001 2002 2003 2004 2005 2006 2007 2008 2009 2010 2011 2012 2013 2014 2015 2016 2017 2018 2019 2020 2021 2022 2023 2024 2025 2026
Humberside North Yorkshire South Yorkshire West Yorkshire
2.53 The structure of employment will look very different in 2026 with, for example, the
manufacturing sector predicted to consolidate further and account for 6.8% of employment compared
with 14.9% in 2001. The biggest growth areas are expected to be in business services and health.
These sectors cover a number of sub-sectors and niches and will act as a strong driver of HLS.
However, the extent to which this growth will be sufficient on its own to substantially alter the HLS
profile of the region is debateable.
The Role of Skills Utilisation
2.54 Cutting across the debate on the demand and supply drivers of HLS is a growing interest in the
way that skills utilisation (the way skills are deployed in the workplace) may provide a mechanism for
boosting productivity and regional economic performance. This is often linked to product market
strategies as a move by companies to compete on the basis of higher spec products or services that
can generate internal demand for higher levels of skills. This is not, however, always the case.
2.55 The growing interest in skills utilisation reflects concerns that increasing aggregate levels of skill
in itself will not necessarily translate into higher growth if the skills of employees are not put to full use
e.g. graduates undertaking non-graduate jobs. A notable policy development in recent years is that
the devolved administrations have shown a keener interest in skills utilisation than their counterparts
in Westminster. Payne (2008) observes that there are two divergent ‘strategic paths’ in the wake of
the Leitch Review, with the English government focused on narrowly boosting skills supply whilst the
Scottish Government has stressed the need to consider skills utilisation strategies and to integrate
5
Sub-regions used here do not exactly correspond to Functional Sub-regions used earlier in this chapter.
20High Level Skills in Yorkshire and Humber: Understanding the Drivers of Change – Phase 1
skills policy within a wider business improvement, innovation and economic development agenda as
6
part of ‘Skills for Scotland’ (Scottish Government, 2007) .
2.56 This difference is explained, in part, by the Scottish Government’s recognition that labour
productivity in Scotland is just below the UK average despite having a workforce with levels of formal
qualification above the UK average. This adds weight to the argument that there is no simple
relationship between aggregate skill levels and economic performance.
2.57 Although skills utilisation has the potential to boost the demand for skills, the evidence
available to date on the impact of initiatives remains inconclusive. There is some indication, however,
in the most recent white paper on 'Skills for Growth' (BIS, 2009) that Westminster is beginning to
recognise some of the arguments about the importance of understanding the demand for skills and
skills utilisation (Keep and Mayhew, 2010). This is likely to reflect the influence of the UKCES who
have challenged an emphasis on boosting the supply of skills. Nonetheless, Keep and Mayhew
(2010) also note, that BIS’s apparent conversion to demand-side arguments has yet to translate into a
coherent skills utilisation programme as per the Scottish Government. The Skills for Growth Paper
also failed to address UKCES’ argument that boosting the supply of highly-skilled people could lead to
oversupply if growth in high-skilled jobs continues to lag behind other countries.
2.58 Much of the literature on how skill utilisation strategies might be deployed in the workplace
focuses on the potential for ‘high performance working’ - ‘bundles of management and work practices'
(Payne, 2008) – thought to incentivise employees to deploy their skills more effectively, in turn, raising
performance. These ideas have considerable appeal for policymakers but Payne (2008; see also
Lloyd and Payne, 2003) has highlighted two key difficulties. Firstly, there are definitional problems in
terms of the range of practices it encompasses. Secondly, there is mixed evidence on whether such
approaches yield gains for workers with potentially negative consequences such as downsizing, work
intensification and the loss of both control and autonomy.
2.59 These concerns aside, an emphasis on high performance working also raises questions
about how, and to what extent, organisations can be encouraged to implement new working practices
that raise skills. Recent research in Scotland has explored this by looking at the degree to which the
Scottish Government can influence product market strategies that, in turn, encourage high
performance working work practices that impact on the demand for skills and skills utilisation. Sung et
al.’s (2009) study of 32 companies across five sectors in Scotland found that government can
influence employers’ product market strategies through a range of mechanisms including:
Formal regulation such as efficiency frameworks that operate in the utility sector or Health and
Safety legislation that applies to specific industries; and
Branding to market specific industries such as the Scottish food and drinks sector as part of
tourist initiatives.
2.60 The capacity of government to influence strategies varied considerably across industries, with
the government most able to influence the utility and public sub-sector of the creative industries
(museums, galleries etc). These variations highlight the importance of sector-specific analysis.
2.61 In terms of the relationship between product market strategies and skill levels, some
employers wanting to move up the product market chain were looking to upskill their labour force. It
was also the case, however, that high-valued added production could be achieved using a
6
See especially Scottish Government (2007a) Skills for Scotland
21High Level Skills in Yorkshire and Humber: Understanding the Drivers of Change – Phase 1
predominantly low-skilled workforce. In other words, there was no ‘invariant’ relationship between
product market and skill, even within the same industry (Sung et al., 2009: 6). Equally, the demand for
and utilisation of skill appeared to be driven by factors unrelated to product market strategy including
the introduction of new technology in the financial services and utilities sectors.
2.62 In terms of supply, skill shortages were identified in particular industry-specific occupations
such as the lack of home-grown food technologists for the food and drinks industry; a shortage of IT
skills in the financial sector and a lack of specialist skills to support in the renewable energy sector.
Again, this illustrates the value of fine-grained analysis of conditions in particular sectors. Overall, the
research suggested that governments can influence product market strategies in a way that impacts
on the demand or utilisation of skill using a variety of levers. But these policy levers have to be
deployed differently both across and within industries, which is indicative of the need to conceptualise
skills utilisation within industry-specific models.
2.63 Empirical evidence on skills utilisation within firms in Y&H is limited, with data from the
National Employers Skill Survey indicating that the number of firms experiencing skills gaps is broadly
in line with the national average. In addition, there is a range of anecdotal evidence on cultural
characteristics of firms and individuals which act to constrain high performance working and the
accumulation of HLS. There may be merit in exploring the role of mechanisms to boost skills
utilisation as part of the second phase of this study.
Low Skills Equilibrium
2.64 The evidence on demand and supply drivers of HLS has also been heavily influenced by the
extent to which it is considered that parts of the UK economy are trapped in a Low Skills Equilibrium
7
(LSE) . Keep (2006: 3) observes that skills development may be constrained by the LSE within the
UK economy which he defines as follows:
An LSE exists where a substantial part of the economy uses low levels of skill to produce
relatively low specification goods or services, which are sold on the basis of low price
and support large swathes of relatively low-paid employment. In many firms, path
dependency (i.e. managerial reliance on a certain way of doing things and of coping with
competition) and low domestic demand for higher quality goods mean that they are often
unable to break free from this equilibrium. Demand for skill is therefore limited.
2.65 One implication of the LSE theory is that it suggests that low skill levels may be the result of
individuals or employers acting rationally in the face of the structural barriers or incentive structures
that face them, even if this is sub-optimal for the economy as a whole. It has been noted, for example,
8
that some of the most profitable companies in the UK in 2001 were freight distributors (Tibbett and
Britten and Excel) and retailers (TESCO and Kingfisher) that are competitive without the need for a
highly educated or broadly skilled workforce (Lloyd and Payne, 2003).
2.66 One of the key arguments deployed to question the continued emphasis on increasing the
supply of HLS is the characteristics and trajectory of the UK economy. Whilst Keep (2006: 4) notes
that the evidence for the LSE is ‘inconclusive’, he highlights other research (Mason, 2004) that
suggests that product market and competitive strategies do play an important if complex role in
determining the level of skills required by employers. Elsewhere, Keep and Mayhew (1999: 12)
7
This concept was first popularised in Finegold, D. and Soskice, D. (1988) The failure of Training in Britain:
Analysis and Prescription’, Oxford Review of Economic Policy, Vol 4 (3), pp. 21-53.
8
Based on the Financial Times 2001 list of the 10 most profitable companies in the UK.
22You can also read


