Grafton OSRP - Town of Grafton MA
←
→
Page content transcription
If your browser does not render page correctly, please read the page content below
[Grafton OSRP]
Town of Grafton
                Open Space and Recreation Plan

                                      2018

Prepared for:   Town of Grafton
                30 Providence Road
                Grafton, MA 01519

Prepared by:    Central Massachusetts Regional Planning Commission
                1 Mercantile Street, Suite 520
                Worcester, MA 01608

                                           i
                      Grafton OPEN SPACE AND RECREATION PLAN 2018
Acknowledgements
The following individuals and organizations have contributed to the development of this Open Space
and Recreation Plan for the Town of Grafton:

Grafton Open Space and Recreation Committee

Jennifer Thomas
Kristin Belanger
Scott Conway
David Robbins
Rick Geoffroy
Karen Eisenhauer
Melinda J Springer

Special Thanks to the Following Town of Grafton Staff

Maria Mast, Conservation Agent
Joe Laydon, Town Planner
Jen Anderson, Recreation Director
Rachel Benson, Assistant Town Planner

Central Massachusetts Regional Planning Commission

Trish Settles, Program Manager
Ron Barron, Associate Planner
Matt Franz, GIS Analyst
Eli Goldman, Planning Assistant

                                                       ii
                                  Grafton OPEN SPACE AND RECREATION PLAN 2018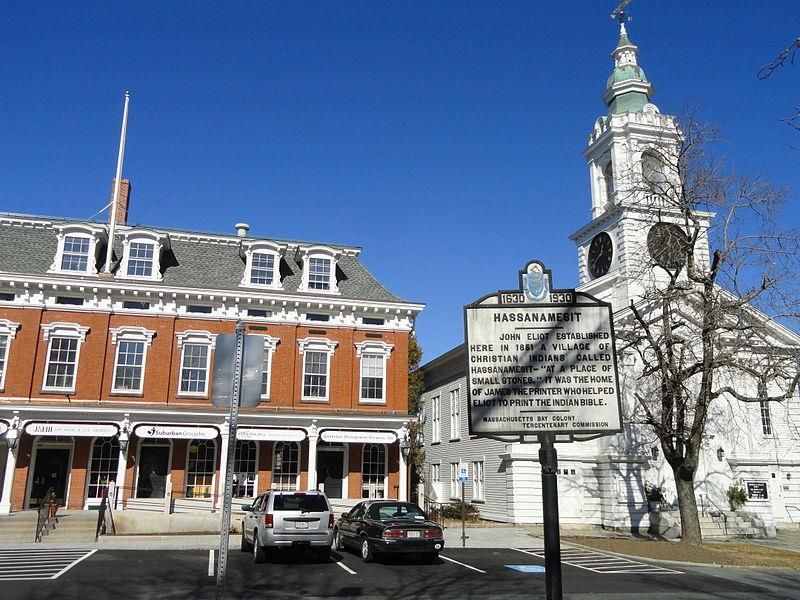
TABLE OF CONTENTS

Contents
TABLE OF CONTENTS ...................................................................................................................................... iii
APPENDICES ....................................................................................................................................................... v
SECTION 1: PLAN SUMMARY ......................................................................................................................... 1
SECTION 2: INTRODUCTION .......................................................................................................................... 4
   2A. STATEMENT OF PURPOSE .................................................................................................................... 4
   2B. PLANNING PROCESS AND PUBLIC PARTICIPATION ........................................................................ 4
SECTION 3: COMMUNITY SETTING .............................................................................................................. 6
   3A. REGIONAL CONTEXT ............................................................................................................................. 6
   3B. HISTORY OF THE COMMUNITY ........................................................................................................... 7
   3C. POPULATION CHARACTERISTICS ........................................................................................................ 9
   3D. GROWTH AND DEVELOPMENT PATTERNS ..................................................................................... 17
   3E. PRIOR PLANNING EFFORTS ................................................................................................................ 21
SECTION 4: ENVIRONME NTAL INVENTORY AND ANLYSIS ................................................................... 24
   4A. GEOLOGY, SOILS, AND TOPOGRAPHY ............................................................................................. 24
   4B. LANDSCAPE CHARACTER .................................................................................................................... 26
   4C. WATER RESOURCES ............................................................................................................................. 27
   4D. VEGETATION ......................................................................................................................................... 32
   4E. FISHERIES AND WILDLIFE ................................................................................................................... 33
   4F. SCENIC RESOURCES AND UNIQUE ENVIRONMENTS .................................................................... 35
   4G. ENVIRONMENTAL CHALLENGES ....................................................................................................... 37
   5A. PRIVATE PARCELS ................................................................................................................................ 47
   5B. PUBLIC AND NON-PROFIT PARCELS ................................................................................................. 50
   5C. PARKS AND RECREATIONAL FACILITIES AN D USAGE ................................................................... 52
SECTION 6: COMMUNITY GOALS................................................................................................................ 56
   6A. DESCRIPTION OF PROCESS ................................................................................................................ 56
   Playgrounds, Recreation Fields ....................................................................................................................... 57
   Scenic Routes .................................................................................................................................................. 58
   Conservation and Preservation....................................................................................................................... 58
   Connectivity .................................................................................................................................................... 58
   6B. STATEMENT OF OPEN SPACE AND RECREATION GOALS ............................................................ 58

                                                                      iii
                                                 Grafton OPEN SPACE AND RECREATION PLAN 2018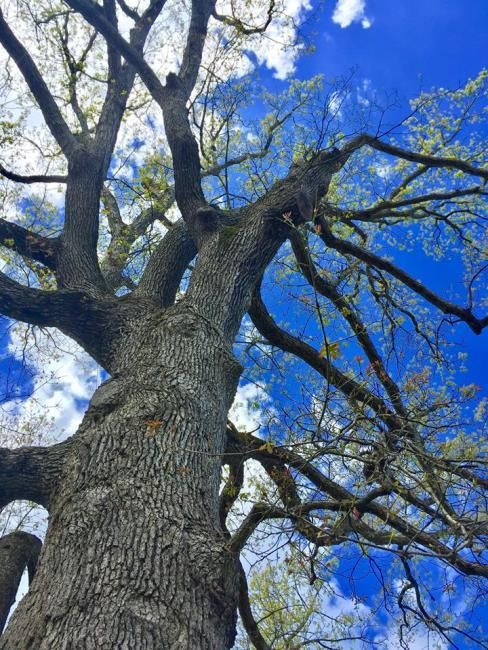
SECTION 7: ANALYSIS OF NEEDS ................................................................................................................ 60
   7A. SUMMARY OF RESOU RCE PROTECTION NEEDS ............................................................................ 60
   7B. SUMMARY OF COMMU NITY'S NEEDS ............................................................................................. 64
   7C. MANAGEMENT NEEDS , POTENTIAL CHANGE OF USE .................................................................. 66
SECTION 8: GOALS AND OBJECTIVES ........................................................................................................ 68
SECTION 9: SEVEN YEAR ACTION PLAN .................................................................................................... 70
SECTION 10: PUBLIC COMMENTS ............................................................................................................... 80
SECTION 11: REFERENCES ............................................................................................................................ 81

TABLE OF FIGURES

Figure 1 Town of Grafton ...................................................................................................................................... 1
Figure 2 OSRP Community Meeting Flyer ............................................................................................................. 5
Figure 3 Waterways in Grafton ............................................................................................................................. 6
Figure 4 Miscoe Brook .......................................................................................................................................... 7
Figure 5 Trails in Grafton ...................................................................................................................................... 8
Figure 6 Passive Recreation in Town .................................................................................................................. 24
Figure 7 Grafton Landscape Character ............................................................................................................... 26
Figure 8 Ekblaw Landing ..................................................................................................................................... 28
Figure 9 Dams in Grafton .................................................................................................................................... 29
Figure 10 Walking Trails ...................................................................................................................................... 30
Figure 11 Grafton Tree Canopy........................................................................................................................... 32
Figure 12 Honeysuckle, source: Mass Audubon ................................................................................................. 33
Figure 13 Playing Fields in Grafton ..................................................................................................................... 53
Figure 14 Silver lake ............................................................................................................................................ 53
Figure 15 OSRP Survey Cover Page ..................................................................................................................... 56

                                                                      iv
                                                 Grafton OPEN SPACE AND RECREATION PLAN 2018
APPENDICES

Appendix A: Maps (folded at the end of the document)

       Map 1 – Regional Context Map
       Map 2 – Environmental Justice Map
       Map 3 – Zoning Map
       Map 4 – Soils and Geologic Features Map
       Map 5 – Scenic Unique Features Map
       Map 6A – Water Resources Map 1
       Map 6B – Water Resources Map 2
       Map 7 – Open Space Inventory Map
       Map 8 – Action Plan Map

Appendix B:   Community Engagement Materials
Appendix C:   The Massachusetts Cultural Resource Information System (MACRIS) Inventory
Appendix D:   21E sites in Grafton
Appendix E:   NHESP Fact Sheets
Appendix D:   ADA Access Self Evaluation, ADA Grievance Procedure, Employment Practices,
              ADA Coordinator Letter

                                                   v
                              Grafton OPEN SPACE AND RECREATION PLAN 2018
SECTION 1: PLAN SUMMARY
This Open Space and Recreation Plan (OSRP) is an update of Grafton’s previous OSRP completed in 2007.
This plan has been updated through an extensive review of available data, public participation from
Town stakeholders, and thorough review and inclusion of current regional issues related to open space
preservation. Grafton is a community actively engaged in open space and resource protection. To this
end, the goals included in the OSRP focus on: preserving and enhancing water resources, protecting and
conserving land resource, preserving Town character, providing well-distributed and varied recreational
facilities and opportunities throughout Town, and enhancing use of existing recreation and conservation
resources in Grafton. This plan seeks to assess the current status of open space in Town by inventorying
existing land uses as they relate to open space and recreation opportunities.
The theme of the 2018 Grafton Open
Space and Recreation plan centers
around preserving, enhancing, and
creating new methods to preserve the
ecological integrity of the Town while
simultaneously meeting recreation
needs. The residents of the Town of
Grafton consider open space,
recreation, and the preservation of
the natural features of the Town to be
of the utmost importance. Grafton’s
rolling hills and green space
contributes to the Town’s aesthetic
beauty, have helped inform the
Town’s development patterns. Major                       Figure 1 Town of Grafton
features of Grafton’s landscape are
the two north-to-south waterways composed of streams and rivers connecting natural and manmade
ponds, which in turn established the mill areas of Town.
Open space provides numerous social benefits and ecosystem services, both of which contribute to
increased quality of life at a local and regional scale. Open spaces provide peaceful areas, pleasant
vistas, sites for wildlife and flora, active and passive recreational opportunities, safety from flooding and
groundwater contamination, and they contribute to clean air. Municipal action is required to protect
these features and benefits, which are threatened by development activity. Grafton citizens and interest
groups have already begun to work together to proactively and innovatively preserve open space.
However, the work needs to continue as development pressures mount. Grafton has been under
constant developmental pressure through the 90’s and 2000’s and has been proactive and innovative in
preserving open space. The development pressure continues to this day and Grafton must continue to
be proactive and innovative to preserve open space. This plan will help the Town as it continues to face
this issue. The visibility of new growth contributes to the sense of suburbanization without regard to
vistas, coordination or neighborhood character. Without continued and intensive action by the Town to

                                                     1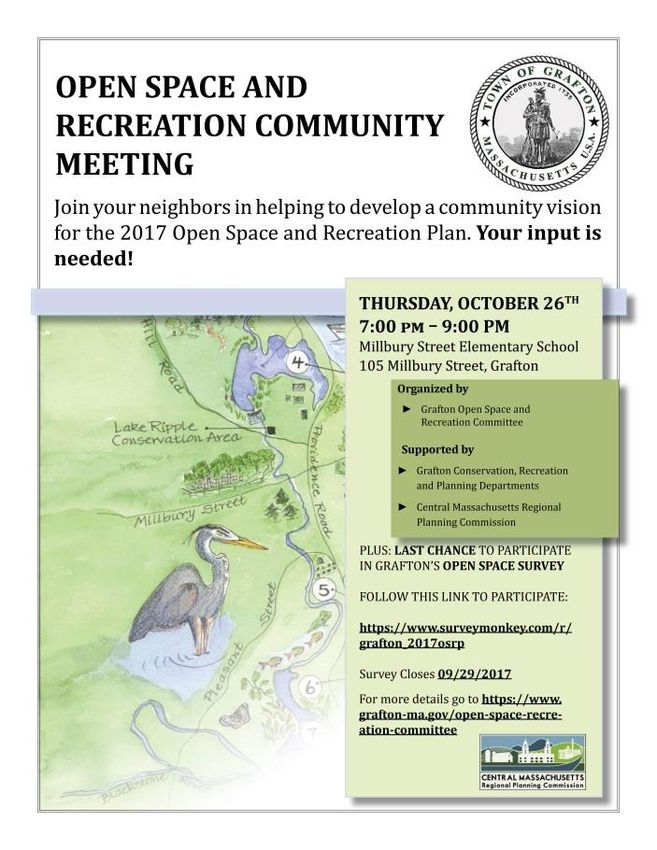
remove fragile land from potential development, Grafton will likely lose much of its scenic and
environmental resources.
Grafton is situated along the Massachusetts Turnpike, and in the line of westward development from
Interstate 495, southerly development from Worcester. Development activity is rapidly depleting open
space and limiting natural resources. The loss of open land to development can lead to increases in
surface water runoff and negative impacts on groundwater resources. Continued development can be
expected to contribute to landscape fragmentation as well, which will limit available habitat and has
potential to reduce critical wildlife corridors.
To this end, this OSRP emphasizes open space connections, open space corridors, and a combination of
full range outdoor recreation. The town of Grafton used two methods to develop the goals and
objectives of this Open Space & Recreation Plan. The first method was to conduct a citizen survey of
Grafton residents in an effort to discern their preferences regarding conservation and recreation.
Conducted in two phases between July and August, and September and October 2017, survey data was
collected electronically using the Survey Monkey platform. The response rate included 686 respondents
or about 3% of Town residents. Following this survey, a public workshop was held in October of 2017.
At this workshop the proposed OSRP goals and objectives from the Town’s previous OSRP were
reviewed with members of the public to see if they were still valid or warranted modification. Town
planners made use of the public’s input from the survey and forum to develop the following open space
and recreation goals for Grafton:
    ●   Preserve and Enhance Grafton's Water Resources,
    ●   Protect and Conserve Grafton's Land Resources,
    ●   Preserve Grafton's Town Character,
    ●   Enhance Grafton’s Existing Recreation and Conservation Resources,
    ●   Expand Grafton’s Recreation and Conservation Resources, and
    ●   Connect Grafton’s Recreation and Conservation Resources

As stated above, Grafton previously addressed open space and recreation issues with a comprehensive
OSRP in 2007. The 2007 Plan is still valid in many respects; however, there have been changes in Town
and there is an even greater sense of urgency towards preserving Grafton’s natural resources. Changes
and additions to the 2007 Plan primarily relate to updated data, identification of new methods for
prioritizing and connecting parcels, and programs and regulations to protect the character of the Town.

DEFINITIONS

The term “open space” in this document refers to either public or privately-owned land that is
undeveloped. It is land in a predominantly natural state or altered for natural resource-based uses (i.e.,
farming, orchards, forestry, hunting and fishing, walking-type parks and trails). Examples of privately-
owned open space might include farms, forest lands, and passive recreation areas.
The term “recreational open space” or “recreation” refers to land used for active recreational purposes.
Land used for active recreation does not qualify technically as open space because these parcels often
have portions covered with paved surfaces such as that for tennis courts, basketball courts and parking

                                                    2
lots. In addition, athletic fields require regular fertilizer applications and are usually installed with
fencing and outbuildings. Since this plan deals with both open space and recreation, we have presented
an approach to obtain the benefits of developing new and maintaining existing recreational facilities,
without losing scarce valued environmental assets. In addition, grants and partnerships between federal
state and local agencies are often based on recommendations the applicant community makes in its
OSRP. Hence, we recognize and embrace opportunities for healthy outdoor activities, be it hiking along
forest trails or a competitive soccer or football field.

                                                    3
SECTION 2: INTRODUCTION

2A. STATEMENT OF PURPOSE
 The Town of Grafton developed this plan to coordinate efforts between town departments, private
organizations, landowners, and citizens as efforts relate to acquisition, protection and management of
open space and recreation resources particularly in light of continued residential and commercial
development pressures. In order to secure and protect valuable parcels of open space, it is essential to
bring forth today’s issues and concerns regarding development, land exchanges, and open space and
recreation needs. The Grafton 2018 Open Space and Recreation Plan builds on past and recent planning
initiatives to provide a framework for priority needs and actions. This 2018 update of the Grafton Open
Space and Recreation Plan is part of a Town-wide effort to manage growth and protect the natural and
built resources that Grafton has to offer. The Town has worked aggressively to protect its open space,
and will greatly benefit from an updated plan to refer to for direction and coordination.

The past ten years have contributed to continued growth and land development. Through its goals and
objectives, as well as the larger narrative, the 2007 Plan identified many tracts of land to be protected,
most of which remain important today. In addition, the Plan developed a five-year action plan in
accordance with its goals and objectives. While efforts have been made to achieve the goals in the 2007
Plan, much of the action plan has not been realized. The 2018 update is a current action plan that builds
on the 2007 Plan and has been adjusted to reflect changes in and around Grafton that have occurred
over the past ten years. The primary purpose of this plan is to realize the Town’s vision where open
space preservation is integral to the Town’s character, where pastoral landscapes are valued and where
natural and historical resources are protected and retained.

2B. PLANNING PROCESS AND PUBLIC PARTICIPATION

Planning Process
In an attempt to accurately determine citizen preferences regarding open space and recreation, the
Town of Grafton distributed a town-wide citizen survey, held public workshops, and a series of public
meetings. The Town formed an Open Space and Recreation planning committee (hereafter the
Committee) comprised of representatives from the Board of Selectmen, Recreation Department,
Conservation Commission, Grafton Land Trust and Planning Board, along with two at-large position. The
Committee met monthly at public meetings in the Grafton Municipal Center throughout the planning
process.

The Town contracted with the Central Massachusetts Regional Planning Commission (CMRPC) to work
alongside the Committee to develop this document. CMRPC provided research and assistance with
public outreach. Ron Barron, Associate Planner from CMRPC served as the principal consultant with Joe
Laydon, Maria Mast, Rachel Benson, and Jen Andersen serving as staff for the Town. Town residents
played an integral role in this planning process as well via survey responses and public forum
attendance.

This OSRP builds an understanding of Grafton’s current place in the region, its history and sense of self,
its demographics, and its growth and development patterns. A thorough review of the geology,
landscape, water resources, vegetation, wildlife and fisheries, unique and scenic resources, as well as,

                                                    4
environmental challenges was necessary to develop a clear picture of the area’s strengths, weaknesses,
opportunities and threats. Working with the State’s Geographic Information Systems (MassGIS)
database, the Grafton Town Assessors Office and others, an inventory of public and private lands of
conservation and recreation interest was compiled. This Plan identifies special areas that town
residents enjoy and sets out a strategy for improving open space and recreation opportunities in a
manner that is sustainable for future generations. Central themes included in this plan include
protection of existing resources, providing open space and recreation opportunities, enhancing land
conservation programs, and preserving town character. The Seven-Year Action Plan included in Section 9
outlines progressive steps to increase community information dissemination and involvement, to
improve recreational opportunities for Grafton’s residents and visitors, and to foster economic growth
by promoting its open space and recreation opportunities. It stipulates detailed action steps, time
frames, and suggests responsible parties intended to help Grafton move forward with open space
planning.
Public Participation
The Committee first convened in March of 2017
and began working on a town-wide survey. The
survey was completed by early June 2017 and
was open to receive responses over the summer
of that year. The survey received 689 responses
or a response rate of around 3%. For comparison
purposes, the 2007 survey received more than
800 responses. The difference between the two
are accounted for largely in the differences in
delivery method. The 2007 survey contained
only eight questions and was mailed to every
household in town. The 2017 survey contained
twice as many questions. Because of the length
of the survey and the costs associated with
delivery, it was decided to promote this survey
entirely online. Despite receiving fewer
responses, the level of specificity and detail
included in the 2017 survey allows for increased
analysis. This analysis will be presented in
Section 7.
The Committee also planned and held a public Figure 2 OSRP Community Meeting Flyer
forum to engage the community in a true
dialogue centered on open space and recreation needs in Grafton. This public forum was held the
evening of October 26, 2017 at Grafton’s Millbury Street School. At the forum, citizens were briefed on
the Town’s open space and recreation resources, and the goals and objectives from the Town’s previous
Open Space & Recreation Plan were reviewed to see if they were still valid or warranted modification. In
addition to the survey and forums, the Committee met monthly throughout the duration of this project
starting in April of 2017. All Committee meetings were open to the public.
5SECTION 3: COMMUNITY SETTING
3A. REGIONAL CONTEXT
Grafton is a semi-rural community located in central Massachusetts southeast of the City of Worcester.
Located in the Blackstone River Watershed, the Town abuts Worcester, Millbury, Sutton, Northbridge,
and Upton. Like many New England communities, Grafton's history and land development have been
heavily influenced by its location and proximity to major waterways. The Quinsigamond River flows
south through Town and meets the Blackstone River within Town boundaries. Native Nipmuc Indians
considered it a place of great Manitou, or spiritual power, because of its many waterways, along which
they developed overland trails that later became regional transportation routes.
Central Massachusetts hills, which are often too steep for easy development, are, in many cases,
mantled with soils that make prime pasturelands. The rich loams found in the river valley are well suited
for crops. Even before the Blackstone's waterpower was harnessed for industry, success with farming
and animal husbandry fostered a rural economy in Grafton, which remained significant in the region as
late as 1940. The Town was long known for its dairy production and was famous for its fruit orchards.
Although Grafton and Worcester County have lost farmland to urbanization over the last four decades,
the Town still retains much of its rural character.
The Blackstone River
The 438-foot drop in run of the
Blackstone River produced the
power that launched the Industrial
Revolution in America. As in other
towns and cities within the
Blackstone River Valley, the
industrial enterprises growing up
along the river and its tributaries
influenced Grafton's land use and
settlement patterns until well into
the twentieth century.
The Blackstone Canal and, shortly
after, the railways linked Grafton to
Worcester, Providence, and Boston, Figure 3 Waterways in Grafton
providing access to much larger
markets and allowing the Town to flourish as an independent commercial center, a status it held until
the post‑war period.
After the war, Grafton's proximity to Worcester influenced North Grafton's development as a suburban
location for Worcester's metal industry, bringing a concomitant burst of residential growth, typified by
one‑half acre lot subdivisions, in that section of Town. The industrial expansion bolstered the Town's
economy at a time when its basis in the textile industry was becoming obsolete, allowing Grafton to
thrive in a way not typical of more southerly towns in the Blackstone Valley.
6Grafton's proximity to the Massachusetts Turnpike has significantly increased its connectivity to the rest
of the region. Due in part to its location near the Turnpike, many residents view Grafton as a bedroom
community. The subsequent development of Interstate 495 further increased residential development
pressures in Grafton. Since 1970, the Town has experienced a substantial increase in its housing stock,
much of it occurring in the previously open and rural midsection. Between 1980 and 2000, the entire
Blackstone Valley saw substantial growth in its population, rising from 72,414 residents in 1980 to
95,674 residents in 2000 – an increase of 32.1%. Today, Grafton still experiences considerable
development pressure. Development pressure, discussed more in depth in Section 4, has the potential
to significantly impact and reduce existing open space. While maintaining open space is a necessary
component of maintaining an adequate supply of recreational opportunities, it is increasingly critical to
providing necessary habitat space for wildlife due to constraints caused by climate change.
Over the past two decades, development pressures have increased due in large part to the opening of
the Route 146 Connector to the Massachusetts Turnpike, the construction of an MBTA Commuter Rail
Station with daily trains into Boston, and an improved local and regional economy. There is no indication
at this time that this pressure will decrease in the immediate future. This fact should be taken into
account during future open space planning in Grafton and the larger region.
3B. HISTORY OF THE COMMUNITY
Grafton, with its lush meadows, good
farmlands, and abundant waterways, has
been historically a site of settlement.
Originally called Hassanamesit, it became
the third of Reverend John Elliot's "praying
Indian" towns and served as a center for
missionary activities in Central
Massachusetts until the outbreak of King
Philip's War. As fortunes of the Native
American population continued to dwindle
in the war's aftermath, white settlers
purchased half of the land from the
Hassanamisco band of the Nipmuc tribe and
incorporated Grafton as a Town on April 18, Figure 4 Miscoe Brook
1735. Only a three-acre tract, the
Hassanamisco Reservation on Brigham Hill Road, remains in Native Nipmuc ownership to this day.
Early colonists farmed, but with increasing use of the Blackstone River's water power for manufacturing
the Town developed as an industrial center, numbering a cotton mill, grist mill, wheelwright shop,
blacksmith shop, and linen mill among its early enterprises. Ethan Allen began the manufacturing of
firearms, pocket cutlery, and the "pepperbox" revolver in 1832. Grafton was the site of the first shoe
factory in the United States. The Forbush-Brown J.D. Nelson and Son shoe factory located in North
Grafton in the 1840s in what was known as the Hancock Building just off the Grafton Common.
Employing as many as 200 people at the height of its operation, the factory was taken over by Forbush-
Anderson after the death of Charles Nelson. Willard Clocks was another notable manufacturing
operation to locate in Grafton and its site is still preserved as the Willard Clock Museum.
7Many of the mills thrived during the nineteenth century and first decades of the twentieth, but few
were able to make a comeback once stricken by the Great Depression. By 1960, there were only 17
manufacturing firms in the Town, compared to 72 in 1922. Even with such reduced numbers, the
remaining companies accounted for 80 percent of local jobs. Manufacturing, now mostly in machine
tools and castings, still provides more of Grafton's jobs (36.4 percent as of 1997) than any other sector
of the economy, but the great majority of these come from a single firm, Wyman‑Gordon, in North
Grafton. Grafton today is a suburban community with almost one‑third of its resident labor force
working in the city of Worcester and close to 40 percent commuting east to the I-495 area or to Boston.
Historic Land Use Patterns
The distinct stages of Grafton's history, described below, had an impact on the Town's land use patterns,
which are evident in the Town's landscape.
Native American Settlement: The Nipmuc
Indians developed trails along the Quinsigamond
and Blackstone Rivers, and along the Miscoe
Brook, which drains into the West River.
Portions of the trails developed into the two
regional stagecoach routes that crisscrossed in
Grafton. The Boston-to-Hartford Post Road
incorporated the old "Connecticut Trail",
generally known as the "Thomas Hooker Trail",
which ran over Keith Hill, across the Blackstone
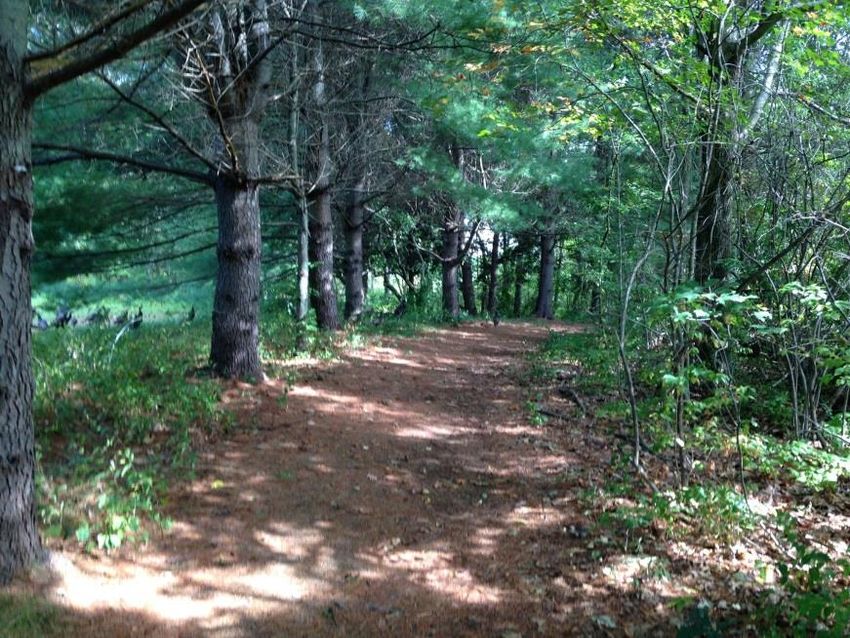
and into Sutton. This was the path along which Figure 5 Trails in Grafton
the renegade Puritan preacher Thomas Hooker
led his dissenting flock out of Massachusetts into Connecticut. The Worcester to Providence Road,
included Worcester and Oak and South Streets, and Old Upton Road and Leland Street as it ran through
Grafton into Upton. Other Indian routes included one starting below Flint Pond, running along what is
now Creeper Hill Road and Westborough Road, which became an east‑west road to Worcester, and the
long-distance Nipmuc Trail, which traversed Grafton into Worcester via Brigham Hill.
Colonial Settlement: Land bought by the Massachusetts General Court from the Indians was
apportioned to each English settler‑farmer in 40-acre lots. These lots, some of whose stone wall
boundaries yet exist, formed the basis for the dispersed pattern of settlement seen amidst the hills. In
following years, the Center, where the stagecoach routes crossed, became the focal point of Town.
Rapid residential growth took place along the Town’s radial routes, such as Brigham Hill, Estabrook, Fay
Mountain, and Soap Hill Roads, all of which were developed as upland connectors.
The Mill Era: Clustered Settlements Amidst Open Space: Mills that took advantage of the Town's
waterways appeared along river and stream banks. The advent of canal and rail transportation through
Town insured that the mills would prosper and spurred development along transport routes. Notable
mill villages developed in North Grafton (New England Village) and South Grafton (Farnumsville,
Fisherville and Saundersville) in addition to the settlement in Grafton's center. The farm economy also
benefited from the railroads and Grafton became famous for its fruit orchards. There was little loss of
farmland to residential growth throughout the 19th century. As late as 1960, 80 percent of the Town
8was undeveloped land, with agricultural activity occurring on 3,447 acres, or 23.6 percent of the total
land area. Grafton was also home to an airport in the late 1920s and 1930s. The Grafton Airport was
located in North Grafton near what is known as Airport Road. South Grafton was the site and
headquarters of Tupperware Inc. before they relocated out of Massachusetts.
Post‑War Suburbanization: As Grafton's mill‑based economic fortunes declined after the war, it
increasingly became a bedroom suburb dependent on Worcester's economy. From 1950 to 1960, during
the height of the baby boom, the Town’s population grew by 37 percent, the largest increase over a
decade in the last 50 years. In spite of the high birth rate, in‑migration from the city of Worcester
accounted for 62 percent of the increase. Much of the residential growth occurred in North Grafton, on
lots zoned for 10,000 to 20,000 square feet. The commercial growth supporting the new population
occurred as strip development along Route 122 leading from Millbury into Grafton. South Grafton did
not grow at the same rate, which kept the old 19th century mill village-based spatial pattern of its
landscape intact and visible.
Modern Day Suburbanization: The most recent spurt of growth occurred in response to the
development of Interstate 495. Long distance commuters engaged in professional, managerial,
technical, and sales positions comprise an increasing percentage of the resident labor force. In 1980, the
mean travel time to work for Grafton’s labor force was 20.3 minutes. By 2000, with the new MBTA
station in place, the mean travel time to work had increased to 28.2 minutes.
Use of land for recreation expanded significantly in the 1950s when a group of South Grafton men
established the Town’s first Little League program. At the time, there were only three suitable locations
to play: Fisherville Park, Norcross Park and Nelson Park. Grafton’s recreational resources and facilities
have continued to develop as the Town’s population continues to grow.
Historical and Archeological Resources: A complete listing of Grafton's archeological resources and
historical buildings and landscapes can be found in A Survey of Historic and Cultural Resources of the
Town of Grafton, by Anne Forbes, on file with the Grafton Planning Board and Grafton Historical
Commission and is included here by reference.
3C. POPULATION CHARACTERISTICS
Population, Household Trends and Density
The Town of Grafton has experienced steady growth in the last century. In 1940, Grafton had a
population of 7,030 residents, and the Town’s population grew steadily through 1970. After
experiencing a slight decrease in population between 1970 and 1980, population in Grafton has
continued to rise as evidenced by the data presented below. By 1990 the Town’s population had grown
to 13,035, indicating significant growth over this period. Since the turn of the century Grafton’s
population has continued to grow, bringing new needs and opportunities to the region. As the
population and associated development increase it becomes more important that the Town plan for
evolving open space and recreation needs. Planning in this way will not only ensure that there are
adequately distributed recreation opportunities throughout the Town, but will help to build a
community that is more resilient to climate change. As temperatures and storms continue to become
more severe, as species become threatened, and as development begins to encroach on existing open
space it becomes increasingly important for open space to be designed with wildlife corridors and
9various other ecological needs in mind. Having adequate open space will allow for continued
biodiversity and delivery of ecosystem services in addition to providing adequate space for Grafton
residents and those traveling to Grafton to recreate.
As shown in Table 3.1 below, Grafton’s population more than doubled in size between the years 1930
and 2010. When compared to other Towns in the region, Grafton experienced a considerable increase in
its population between 1980 and 2010. This comparable growth is evidenced via table X2 below. The
highest rate of growth in Grafton took place between 1950 and 1960, with population leveling off
somewhat between 1960 and 1980. Since 1980 the Town’s population has gone back to increasing by
more than 10% each decade. Based on 2016 American Community Survey projections, Grafton’s
population reached 18,330 in the year 2016, or a 3.2% increase from the 2010 documented population. Comment [JL1]: Our 2018 Housing Plan used
2016 ACS numbers as well. Any way to be
consistent with both plans?
Table 3.1 : Population change in Grafton 1930 to 2010
Year 1930 1940 1950 1960 1970 1980 1990 2000 2010 2016
Population 7030 7457 8281 10627 11659 11238 13035 14894 17765 18330
Change from X 427 824 2346 1032 -421 1797 1859 2871 565
Previous
Percent X 6.1% 11.1% 28.3% 9.7% -3.6% 16.0% 14.3% 19.3% 3.1%
Growth
Source: U.S. Census Bureau Decennial Census; U.S. Census Bureau, 2012-2016 American Community
Survey 5-Year Estimates
At a broader, more regional geographical scale, the previous 30 years represent a period of significant
growth for the Blackstone Valley as many communities in the Valley have experienced explosive
development pressure (see Table 3.2). Since 1980, Grafton’s population has grown by 58.1%. Based on
the data presented below, Grafton’s increase of 6,526 residents is responsible for 17.7% of regional
growth in the Blackstone Valley. Other towns in the Blackstone Valley that have undergone significant
population growth include: Douglas, Mendon, Millville, and Upton. The State of Massachusetts has
experienced population growth of 14.1% between 1980 and 2010. Over the course of the same period
Worcester County has experienced a growth rate of 23.5%. Meanwhile, the Blackstone Valley has grown
at a rate of 50.7%.
10Table 3.2: Regional Growth - 1980 through 2010
1980 1990 2000 2010 Change Percent
1980-2010 Change 1980-
2010
Blackstone 6,570 8,023 8,804 9,026 2,456 37.4%
Douglas 3,730 5,438 7,045 8,471 4,741 127.1%
Grafton 11,238 13,035 14,894 17,765 6,527 58.1%
Hopedale 3,905 5,666 5,907 5,911 2,006 51.4%
Mendon 3,108 4,010 5,286 5,839 2,731 87.9%
Millbury 11,808 12,228 12,784 13,261 1,453 12.3%
Millville 1,693 2,236 2,724 3,190 1,497 88.4%
Northbridge 12,246 13,371 13,182 15,707 3,461 28.3%
Sutton 5,855 6,824 8,250 8,963 3,108 53.1%
Upton 3,886 4,677 5,642 7,542 3,656 94.1%
Uxbridge 8,374 10,415 11,156 13,457 5,083 60.7%
Blackstone Valley 72,413 85,923 95,674 109,132 36,719 50.7%
Worcester County 646,352 709,705 749,973 798,552 152,200 23.5%
Massachusetts 5,737,037 6,016,425 6,349,097 6,547,629 810,592 14.1%
Source: U.S. Census Bureau, Town of Grafton
Table 3.3 indicates that roughly a quarter of Grafton’s population in 2010 consisted of school-age
children. This population represents an increase of 26.57% from the Town’s 2000 population. The
majority of age brackets have experienced population growth between 2000 and 2010. The 20-44 year
old age group in Grafton has increased by 6.41%, indicating a slow growth in the number of younger
residents in Town. The Town of Grafton has also experienced an increase in the number of residents
aged between 45 and 64. In 2000, 3,325 residents fell into this category. By 2010, this figure had
increased to 4,552 or a 25.45 % increase. The only age group that has experienced a decrease in
population size over the course of this period are those aged 65 years or older. In 2000 1,671 residents
fit into this age group. By the time of the 2010 Census this figure had dropped to 1,458. This decrease
marks a 12.75% loss. However, overall population has increased by 19.28% over this period. As Grafton
continues to be home to a population of a significant number of young children and older residents it is
critical that open space and recreation needs are identified and met in order to provide necessary access
and services to residents.
11Table 3.3 Grafton Age Characteristics
Age Group Year Year Year 2016 % of Total Population Change
2000 2010 Population 2010 2000-2010
Under 5 Years of Age 1,086 1,300 1,026 7.32% 19.71%
5 – 19 3,098 3,921 22.07% 26.57%
20-44 5,714 6,080 34.22% 6.41%
45-64 3,325 4,522 25.45% 36.00%
65 Years of Age and Over 1,671 1,458 8.21% -12.75%
Total: 14,894 17,765 100.00% 19.28%
Source: US Census Bureau, 2000, 2010 Census.
CMRPC projections show continued growth for the town with an estimated 20,970 residents by 2030.
CMRPC regularly publishes population projections for its constituent communities based on U.S. Census
estimates. The town level projections were vetted with the communities for transportation planning
purposes as part of the 2016 Long Range Transportation Plan. The control totals for the CMRPC region
are provided by the Massachusetts Department of Transportation (MassDOT). Town level projections
were developed based upon past growth trends, land use and infrastructure capacity, planned future
projects, and stakeholder input, including that of the Central Massachusetts Metropolitan Planning
Organization (CMMPO), CMMPO Advisory Committee, and CMRPC Regional Collaboration and
Community Planning staff.
As shown on Table 3.4, Grafton is expected to experience steady population growth compared to other
communities in the Southeast sub-region. The population in surrounding towns of Northbridge and
Upton are expected to rise by 13% and 11% respectively by the year 2030. This proximal growth in
population may have an impact on the Town of Grafton by increasing local housing needs, spending, and
goods and services. Once again, this growth can be expected to have an impact on the Town’s open
space and recreation needs. Projections indicate that Grafton can expect to experience an increase in
employment as well. Grafton’s estimated 8% increase in employment is relatively high when compared
with neighboring towns in the sub region, with several other nearby towns expected to experience
anywhere from 3-4% employment growth from 2010 to 2030. With a total land mass of 23.3 square
miles, Grafton’s population density is equal to 763 people per square mile. By contrast, Worcester had a
population density of 4,815.03 people per square mile in 2010 and Worcester County as a whole had a
population density of 527.77 people per square mile.
12Table 3.4: Population and Housing Projections
Population Projections Employment Projections
Municipality 2010 2030 Percent 2010 2030 Percent
change change
Blackstone 9,026 10,110 11% 1,030 1,060 3%
Douglas 8,471 9,550 11% 830 930 11%
Grafton 17,765 20,970 15% 4,100 4,470 8%
Hopedale 5,911 6,480 9% 1,620 1,670 3%
Mendon 5,839 6,550 11% 1,280 1,320 3%
Millbury 13,261 14,880 11% 5,050 5,440 7%
Millville 3,190 3,580 11% 270 280 4%
Northbridge 15,707 18,070 13% 5,320 5,950 11%
Sutton 8,963 10,040 11% 2,110 2,420 13%
Upton 7,542 8,520 11% 1,010 1,040 3%
Uxbridge 13,457 15,950 16% 3,080 3,200 4%
Southeast Sub- 109,132 124,700 12% 25,700 27,780 7%
Regional Total
Source: U.S. Census Bureau and the Central Massachusetts Regional Planning Commission
Housing Characteristics
As population has increased in Grafton Table 3.5 Grafton Housing Unit Growth
so have the number of housing units.
Table 3.5 below indicates changes in Year Housing Numerical %
the number of housing units from 1960 Units Change Change
through 2010. Data from 2016 and
1960 2605 ---- ----
2016 are also presented via American
Community Survey 5-year estimates. 1970 3097 492 18.90%
The Town of Grafton has experienced
consistent growth in the number of 1980 3863 766 24.70%
housing units in recent years. Since the 1990 4799 936 24.20%
1970s, the Town has seen an increase
in the number of housing units by at 2000 5694 895 18.60%
least 500 units each decade. After this
2010 6,516 822 14.40%
period the decadal increase has varied,
ranging from 766 units to 936 units 2015 7283 767 11.80%
added. Based on projections, the
number of housing units increased 2016 7179 -104 -1.42%
from 2010 to 2015 by 767 units or an
Sources: US Census, Decennial Census 2010, ACS 2015, ACS
11.8% change. 2016.
The number of family households in
Grafton has increased alongside the total gross population from the year 2000. Over the same period
the overall percentage of non-family households has increased. In 2000, just shy of 4,000 family
households were recorded as living in Grafton compared to 1,742 non-family households. By 2010, the
13number of family households had increased to 4,736, while the number of non-family households has
increased to 2,156.
Table 3.6 Households by Type
Year Family Percentage of Non-Family Percentage of
Households Households Household Households
2000 3,952 69.4% 1742 30.60%
2010 4,736 68.7% 2,156 31.30%
2016 4,747 69.7% 2,060 30.3%
Source: 2000 U.S. Census Bureau decennial figures; 2010 U.S. Census Bureau decennial figures;
2016 ACS 5-year survey
Of the 6,892 households in Grafton in 2010, the majority are 2-person households (32.5%). The other
highest categories of household size include 1-person households (24.2%), 4-person households (17.6%),
and 3-person households (17.4%).
A comparison of the data presented above indicates that Table 3.7
Grafton’s housing stock has and continued to grow at a
faster rate than its population. Table 3.8 below indicates HOUSEHOLD SIZE Number Percent
that there has been an increase in the number of vacant 2010 2010
housing units between 2000 and 2010 as well. This trend Total households 6,892 100%
of a greater rate of increase for housing units compared
to population is not surprising when one considers the 1-person household 1,665 24.2%
national trend towards smaller household sizes. Couples
2-person household 2,237 32.5%
are having fewer children today and many households are
of the single parent variety. Grafton’s US Census data 3-person household 1,197 17.4%
confirms this trend. In 1960, the typical Grafton
household contained 4.08 people. By 1980, the persons 4-person household 1,215 17.6%
per household figure had declined to 2.91 and by 2000, to 5-person household 434 6.3%
2.62 persons per household. Based on 2016 projections
from the American Community Survey, the number of 6-person household 113 1.6%
persons per household has increased slightly to 2.67, 31 0.4%
7-or-more-person
representing a slight increase. However, there is an household
apparent downward trend reflected in household size.
Another factor contributing to smaller household sizes is Source: 2010 U.S. Census Bureau decennial
“the graying of America”, that is, our nation’s elderly figures
population is expanding. The Census data clearly
demonstrates that this national trend is taking place in Grafton. In 1970, the median age of Grafton’s
population was 32.5 years of age. By 2000 the median age had increased to 35.9 years of age, and 39.2
by 2010. 2016 American Community Survey estimates project that the median age has increased to 41.3
years old.
14Grafton’s median household income is significantly higher than the average for Worcester County and
the State as a whole. This is an indicator of an affluent community that should be able to afford the cost
of providing a diverse selection of recreational opportunities and open space amenities for its citizens,
including the long-term Table 3.8 Occupancy Status
maintenance of these resources.
Number of Number of vacant Percent
Analysis of per capita income shows occupied housing units Vacant
that Grafton ranks well above the units
State and Worcester County per
2000 5,694 134 2.29%
capita income, further indicating
that resource are likely available to 2010 6,892 285 3.97%
meet needs. 2016 6,807 372 5.2%
Source: U.S. Census Bureau 2000 and 2010; 2018 Grafton Housing
Production Plan
Table 3.9 Median Household Income Comparison
Year Median income (dollars) State Median Household Income Percent of State Average
2000 $66,396 $50,502 131.50%
2010 $91,743 $64,509 142.20%
2015 $88,712 $68,563 129.40%
2016 $96,277 $70,954 135.68%
Source: U.S. Census Bureau 2000, 2010 US Census, 2015 ACS, 2016 ACS.
Table 3.10 Per Capita Income Comparison
2000 2010 2015 2016
Grafton Per Capita Income $26,952 $39,304 $42,542 $44,034
State Per Capita Income $25,952 $33,966 $36,895 $38,069
Percent of State Average 103.80% 115.70% 115.30% 115.67%
Worcester County Per Capita Income $22,983 $30,557 $32,284 $33,272
Percent of Worcester County Average 117.30% 128.60% 131.80% 132.35%
Source: 2010 US Census, 2015 ACS, 2016 ACS.
15Table 3.11 shows significant growth in all but the upper middle-income categories, which saw a small
decline between 2000 – 2010. The greatest growth is found in less than $10,000 and greater than
$100,000 range indicating a bifurcated income distribution pattern seen elsewhere in the region. This
being said, the 2010 US Census data do indicate that the around 75% of housing units continue to be
owner-occupied, which represents a small increase from 2000 (72.3%). Rental occupied units only
accounted for 25% of total housing stock in 2010 compared to 27.7% in 2000.
Table 3.11 Grafton Income Distribution
Income Range 2000 2010 2016
# Households # Households # Households
Less than $10,000 48 143 283
$10,000 - $24,999 381 436 610
$25,000 to $34,999 284 417 387
$35,000 to $49,999 527 654 564
$50,000 to $74,999 943 872 916
$75,000 to $99,999 772 834 763
$100,000 to $149,999 653 1388 1,554
$150,000 and over 337 1488 1,730
Additional Demographics
According to the most recent statistics of the Massachusetts Division of Unemployment Assistance,
there were 363 business establishments in Grafton as of 2005, employing an average monthly total of
4,356 people. The service industry had the highest number of the jobs in Grafton (3,137) followed by
manufacturing (835).
The Division of Unemployment Assistance statistics further indicate that Grafton had a labor force of
8,928 workers as of 2005, with an unemployment rate of 4.2%, significantly lower than the State
average of 5.4% and the Worcester County average of 5.7%. Grafton’s unemployment rate has
fluctuated wildly during the past fifteen years, with a low of 2.5% in 2000 and a high of 10.1% in 1991.
Environmental Justice
Since 2002, the Executive Office of Energy and Environmental Affairs (EOEEA) has been implementing an
Environmental Justice Policy to help ensure that all Massachusetts residents experience equal
protection and meaningful involvement with respect to the development, implementation, and
enforcement of environmental laws, regulations, and policies and the equitable distribution of
environmental benefits. This policy was instituted recognizing that communities across the
Commonwealth, particularly those densely populated urban neighborhoods in and around the state’s
older industrial areas, are facing many environmental challenges associated with Massachusetts’
16industrial legacy. Residents in these predominantly low-income and minority communities – nearly 29%
of the state population – lack open space and recreational resources and often live side-by-side
numerous existing large and small sources of pollution and old abandoned, contaminated sites, which
can pose risks to public health and the environment. Critical to advancing Environmental Justice (EJ) in
the Commonwealth is the equitable distribution of environmental assets such as parks, open space, and
recreation areas. Toward this end municipalities shall identify and prioritize open space sites in their
OSRPs that are socially, recreationally, and ecologically important to EJ populations within the
community. Environmental Justice Populations in Massachusetts are determined by the following
criteria:
Households that earn 65% or less of the statewide household median income;
25% or more of the residents are minority;
25% or more of the residents are foreign-born; or
25% or more of the residents are lacking English proficiency.
There is currently one Environmental Justice population located in the Town of Grafton. This section of
the population is located in the southern section of Town abutting Northbridge and Upton. In planning
for Grafton’s future open space and development this population should be taken into account.
3D. GROWTH AND DEVELOPMENT PATTERNS
Patterns and Trends
The University of Massachusetts-Amherst has been tracking statewide land use data for the better part
of the previous century. The University uses aerial photographs and interprets them (now using GIS)
based on land use categories. This work was updated in 2005 by MassGIS, the Massachusetts Bureau of
Geographic Information. As indicated below, the largest land use in Grafton is forest cover followed by
residential development. Together these two land uses make up well over two-thirds of total land use in
Grafton.
2005 Land use Sum of GISACRES Percent of total
Forest 7081.26 47.47%
Residential 3325.13 22.29%
Cropland 733.97 4.92%
Forested Wetland 719.64 4.82%
Non-Forested Wetland 605.65 4.06%
Open Land 366.36 2.46%
Water 361.15 2.42%
Pasture 292.73 1.96%
Urban Public/Institutional 214.08 1.44%
Powerline/Utility 194.52 1.30%
Transportation 188.56 1.26%
Commercial 158.54 1.06%
Golf Course 153.73 1.03%
17Transitional 102.42 0.69%
Industrial 97.99 0.66%
Participation Recreation 74.84 0.50%
Brushland/Successional 68.84 0.46%
Nursery 53.06 0.36%
Cemetery 52.11 0.35%
Mining 42.57 0.29%
Orchard 20.38 0.14%
Waste Disposal 5.88 0.04%
Junkyard 4.47 0.03%
Source: MassGIS 2005
The table below shows a clear comparison of land use change from 1971 through 2005. The amount of
developed land in Grafton has increased by 67.7% between 1971 and 1999. In terms of sheer acreage,
the residential sector has grown the most, adding 1,243 new acres of development between 1971 and
1999. Conversely, Grafton’s farmland has declined by roughly 22% and forestland by 8.8% during the
same time period. With only 3,667 developed acres out of a total land area of 14,528 acres (or 25.2% of
the total), Grafton is still very much a rural small town despite the increase in development documented
above.
Table 3.12 Grafton Land Use Changes Over the Years
1971 1985 1999 2005
Developable Acres 2,186 2,919 3,667 3,581
Residential 2,048 2,583 3,291 3,267
Industrial 29 181 194 97
Commercial 109 155 182 158
Forestland 8,420 8,113 7,677 7,081
Farmland 2,189 2,057 1,707 1,026
Source: UMass-Amherst land use data for 1971, 1985 and 1999; MassGIS, 2005
Zoning
Zoning and other land use laws constitute a community’s “blueprint” for its future. Grafton’s residents
and leaders can expect that the Town’s existing land use will continue to look more and more like its
zoning map over time until the Town is finally “built out.” The Town adopted its first zoning bylaw in
1956 and was amended as recently as October 2018. Grafton has nine base zoning districts and six
overlay districts. The base districts define the allowed uses and dimensional requirements, while the
overlay districts provide for additional uses, restrictions and protection measures in specific areas of
Town. Permitted uses within each of the zoning districts, as well as dimensional and density regulations
for building sizes and yard areas are set forth within Grafton’s Zoning Bylaw.
18Infrastructure
The public roads and highways are in good condition and meet the requirements of a modern roadway
network. Immediate access to the interstate highway system is available via Exit 11 of the
Massachusetts Turnpike in Millbury, just a few hundred feet from the Town line in North Grafton. A
second interchange that connects the Turnpike with Route 146 has made the valley more accessible and
therefore more attractive to commercial firms.
In addition to roadways, Grafton also is accessible by rail and bus service. MBTA commuter rail service
was introduced to Grafton in 2000, with a station located at Route 30 and Pine Street. Bus and rail
service is available in adjacent Worcester at Union Station with connections to Amtrak and Peter Pan
and Greyhound bus lines. The Worcester Regional Transit Authority (WRTA) provides additional
connections to neighboring towns such as Northbridge and Millbury and links to the nearby MBTA
station. Other than the Massachusetts Turnpike, east‑west travel is limited to local roadways, except for
short sections of Routes 122A, 122, and 30. Route 122A enters the Saundersville section of Grafton at
the Sutton town line and joins Route 122 in the Farnumsville section. Route 30 in North Grafton
provides east‑west travel to the major high-tech employers in Westborough and along Interstate 495.
Two major north‑south highways are present in Grafton. Route 122 is the principal connection to
Worcester and Route 140 provides access to U.S. Route 20 and State Route 9 in Shrewsbury. Portions of
Routes 140 and 122 are state-administered highways, while Routes 30 and 122A and the Town
maintains the rest of Routes 122 and 140.
Roadways
The Town of Grafton owns the majority of
Table 3.13 Grafton Road Inventory
roadways in the town. Of the 96.07 miles, 84 are
town owned. A complete breakdown of roadways Administration Number of Miles
is included in the Table 3.13. This table indicates
the amount of mileage in Grafton for each State 10.01
category of roadway in Grafton. Town 84
Blackstone River Bikeway: Another important Mass. Turnpike Authority 4.43
transportation element that is currently in the
planning/design stages is the Blackstone River Unaccepted 2.57
Bikeway. The Bikeway will ultimately extend Within Grafton State 2.9
forty-eight miles from Worcester, MA to Hospital
Providence, RI passing through Grafton.
Currently, various sections of the Bikeway are Total Mileage 96.07
open to the public in Rhode Island and Source: Mass GIS
Massachusetts. When completed, the Bikeway
will provide a mostly off-road non-motorized transportation corridor through the historic John H. Chafee
Blackstone River Valley National Heritage Corridor. The Corridor Commission has been instrumental in
the formation of the Bikeway, working with Federal, State, Regional and local agencies to create an
important recreational and cultural link within the Blackstone River Valley. The Blackstone Valley
Bikeway will serve as an alternative mode of transportation for commuters as well as the region’s
premiere multi-use recreational facility. This bi-state linear State Park along the Blackstone River will
connect New England’s second and third largest cities serving a population of more than 1 million. The
19You can also read