Proceedings of the 3rd Annual System Dynamics Conference - Eskom Research Testing & Development Centre; Johannesburg; South Africa
←
→
Page content transcription
If your browser does not render page correctly, please read the page content below
Proceedings of the 3rd Annual
   System Dynamics Conference

          16th November 2015
Eskom Research Testing & Development
  Centre; Johannesburg; South Africa

                            Collaborative Partners:
Eskom & the South Africa System Dynamics Chapter
Proceedings of the

3rd Annual System Dynamics

       Conference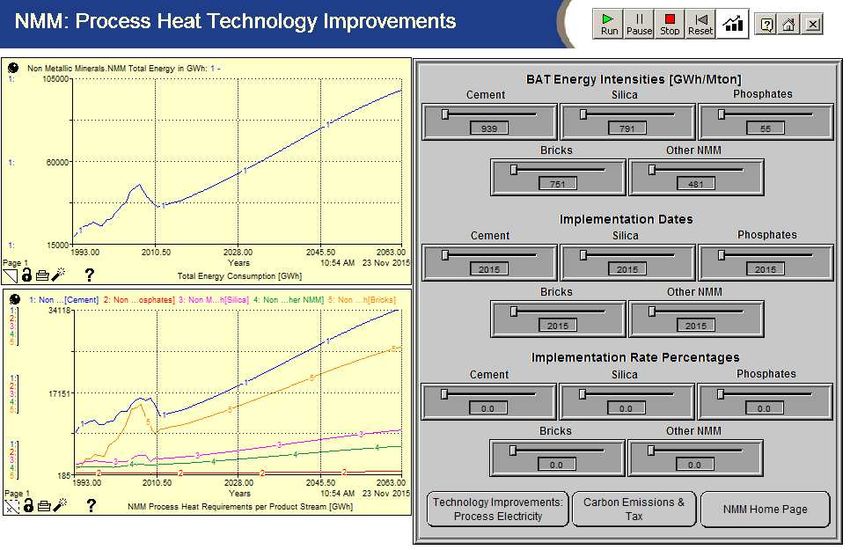
Proceedings of the 3rd Annual System Dynamics
                  Conference

                           16th November 2015

     Eskom Research Testing & Development, South Africa

                  ISBN 978-0-620-69147-5

 Copyright © January 2016

 Edited by:
 Nalini Sooknanan Pillay

 Publisher:
 Eskom SOC, Lower Germiston Road, Rosherville
 South Africa

 To obtain additional copies of these proceedings or to learn more
 about the Annual System Dynamics Conference, contact:

 Nalini Sooknanan Pillay Pr.Eng
 Email: Nalini.pillay@eskom.co.za

 Or Mapule (Minah) Ntsoane
 Email: NtsoanMM@eskom.co.za

 Or Access the Website for the South African System Dynamics
 Chapter: http://www.systemdynamics.org.za

                                    3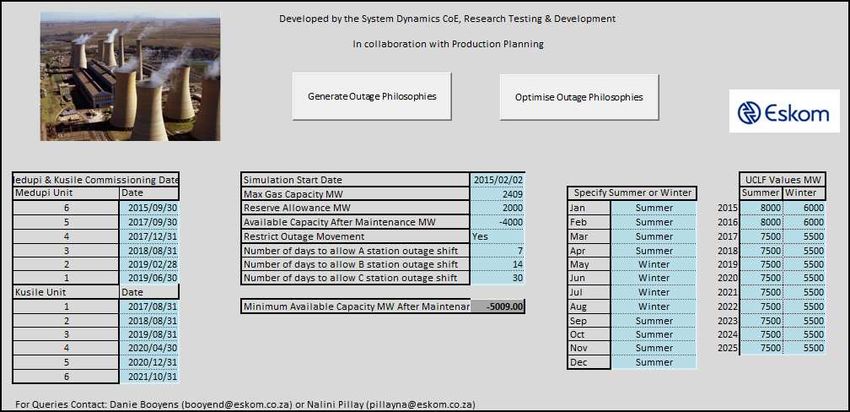
Contents
Welcome .......................................................................................................................................................... 5
Partners and Conference Organizers ............................................................................................................... 6
Conference Chair and Submission Review Volunteers ................................................................................... 6
Keynote Speaker.............................................................................................................................................. 6
Conference Participants ................................................................................................................................... 7
KEYNOTE ...................................................................................................................................................... 9
System Dynamics in the Making of a Professional: A Health Sciences Perspective ...................................... 9
A System Dynamics Approach to Understand the Implications of a Green Economy Transition in the
Western Cape Province of South Africa ........................................................................................................ 10
Project Prioritisation Using System Dynamics .............................................................................................. 14
Using System Dynamics Methodology to Simulate Various Demineralised Water Production Plants in
Eskom ............................................................................................................................................................ 18
Using SD Modelling to Explore the Complex Social, Biophysical and Political Interactions Involved in
Establishing Water Security within the Selati Catchment in the Limpopo Province of South Africa. .......... 22
System Dynamics Simulation using Non-Traditional Platforms ................................................................... 26
System Dynamics Modelling of Situation Awareness .................................................................................. 30
Key Value Chain KPI Simulator ................................................................................................................... 34
Using System Dynamics to Minimise Operational Cost and Risk of a Stock Out of Returnable
Transportation Stillages ................................................................................................................................. 38
Simulating the Chemical Usage of Power Stations Using System Dynamics ............................................... 41
Conceptual Model for the Innovation-Decision process with focus on Adoption of Health Technology ..... 44
A Conceptual Model for the Innovation-Decision Process with Focus on Acceptance ................................ 48
System Dynamics Constructs and Knowledge Management ........................................................................ 52
Exploring the Use of SD modelling Towards the Goal of Enhancing Resilience of People and Ecosystems
in the Limpopo-Olifants Region of South Africa .......................................................................................... 56
Modelling the Energy Requirements of South Africa’s Economic Sectors Using a System Dynamics
Approach ....................................................................................................................................................... 60
Ponzi Schemes - A System Dynamics Perspective ....................................................................................... 64
(It’s not all about work!)................................................................................................................................ 64
Working with Systems Thinking & Systems Dynamics when Linear and Convergent Thinking is the
‘Norm’ ........................................................................................................................................................... 66
An Exploration of Gangs on the Cape Flats with Specific Reference to Gang-Related Murders using System
Dynamics ....................................................................................................................................................... 70
Applying System Dynamics to Complex Social Challenges ......................................................................... 74
Author Biographies ....................................................................................................................................... 77

                                                                                 4
Welcome
Eskom SOC collaboratively hosted the 3rd System Dynamics Conference in South Africa on the
16th November 2015. Once again, the Conference served as a vehicle to discuss and share existing
system dynamics projects and research by various institutes and organizations, while creating
opportunities for networking and new research ideas. The Conference was opened by Mr Barry
MacColl, General Manager – Eskom Research Testing & Development and the keynote speaker
was Professor David Rubin from the University of Witwatersrand who spoke about the
application of system dynamics in Health Sciences.

Topics covered were diverse and it was clear that the system dynamics approaches assisted in
developing an understanding of the behaviour of these systems over time, through multiple
scenarios that provided foresight intelligence and insights on how to manage change. Several of
the systems which were simulated were complex with variables that interacted with each other
non-linearly in a “network-like” causal structure, however, a few topics went beyond modelling
organizational complexities to applications in everyday, realistic activities.

The South African System Dynamics Chapter incentivised this years Conference by donating
trophies to the following participants who received accolades through a process of voting:
    •   Best Contribution to the South African System Dynamics Community: Danie Booyens,
        System Dynamics CoE, Eskom Research Testing & Development.
    •   Best Student Paper: Willem Jonker & Theodore A York: A System Dynamics Approach
        to Understand the Implications of a Green Economy Transition in the Western Cape
        Province of South Africa
    •   Best Presentation: Andries Botha, Toyota SA: Ponzi Schemes - A System Dynamics
        Perspective.

The 4th Annual South African System Dynamics Conference will be held in Stellenbosch, South
Africa, hope to see you all there!

Nalini Sooknanan Pillay
Head: System Dynamics CoE, Eskom Research Testing & Development
Vice-President: South African System Dynamics Chapter

                                                  5
Partners and Conference Organizers

Eskom Research Testing & Development – System Dynamics Centre:
Mapule Ntsoane, Daniel Booyens, Naledi Memela, Talitha Koegelenberg, Corné Du Plooy,
Nombuso Sibeko, Chris Gross, Nalini Sooknanan Pillay

South African Chapter of the System Dynamics Society:
Prof. Alan Brent (President), Nalini Sooknanan Pillay (Vice-President), Dr Josephine Musango
(Secretariat), Stephen Roper, Prof Leon Pretorius, Andries Botha, Thokozani Simelane, Rudolph
Louw, Dr Jai Clifford-Holmes.

Conference Chair and Submission Review Volunteers

Conference Session Chairs:
Chris Gross – Eskom SOC
Andries Botha - Toyota South Africa
Dr Josephine Musango – University of Stellenbosch
Prof Alan Brent – University of Stellenbosch
Nic Cloete Hopkins – University of Witwatersrand

Keynote Speaker

Professor David Rubin – University of Witwatersrand

                                               6
Conference Participants

The following institutes and organizations were represented:
   •   Eskom Divisions & Groups
   •   SASOL Inzalo Foundation
   •   CSIR
   •   Sustainable Concepts (Pty) Ltd
   •   Dynamic Strategies
   •   Nedbank
   •   EON
   •   Department of Energy
   •   University of Stellenbosch
   •   University of Witwatersrand (Including the Transnet Centre of Systems Engineering)
   •   University of Cape Town (including the Energy Research Centre)
   •   University of Pretoria
   •   Tshwane University of Technology
   •   Da Vinci Institute
   •   IDC
   •   Global Prospectus Training
   •   Gordon Institute of Business Science
   •   Toyota South Africa
   •   KnowlEdge Srl.

                                              7
EXTENDED
ABSTRACTS

    8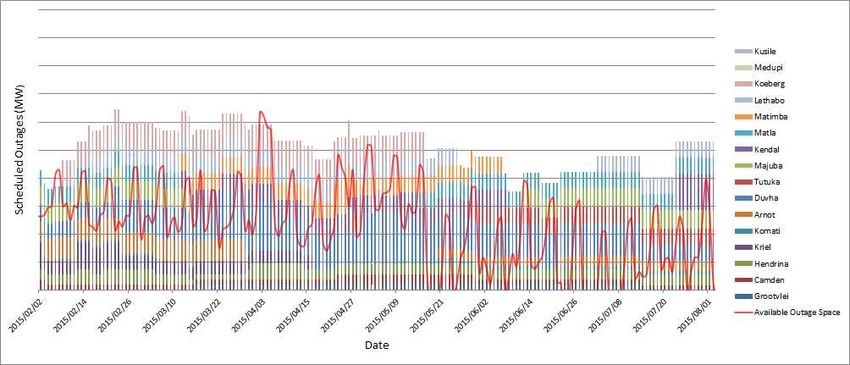
KEYNOTE
  System Dynamics in the Making of a Professional: A Health Sciences
                                            Perspective

                                           David M. Rubin

   Biomedical Engineering Research Group; School of Electrical & Information Engineering; University of
                        Witwatersrand, South Africa; Email: d.rubin@ee.wits.ac.za

ABSTRACT
System Dynamics has broad applicability across numerous disciplines, and knowledge of and fluency
with System Dynamics thus has the potential to benefit the practice of a wide range of professions. A
number of professional activities are well known to include a heavy dose of systems thinking;
examples of this include environmental management, urban planning and economics. The need for
systems thinking in various professional activities is not always recognised, however there is little
doubt that many fields could benefit from an enhanced education in systems approaches. This talk
focuses primarily on the teaching of System Dynamics as part of the training of medical professionals
as a means of achieving a more rigorous thought process and a deeper appreciation for the role of
complexity in their discipline. An outline of the courses taught to Medical, Pharmacy, and Health
Science students at the University of the Witwatersrand, Johannesburg is given. This includes a
discussion on the nature of medical problems and their suitability for systems analysis.

Particular emphasis is placed on the hierarchical nature of the “medical system”, starting with the
molecular aspects and extending this to the sub-cellular, cellular, organ, and human body levels,
followed by further extension of its utility in the local and general healthcare systems. Examples
are given of the various systems studied at each level, such as pharmacokinetics, enzyme kinetics,
cardiovascular dynamics, heat transfer in the human body, endocrinology, hospital logistics and
health economics. This is followed by some discussion on the anticipated effects that this training
has on the students' approach to problem solving in the context of clinical medicine. Of critical
importance is the attitudes expressed by students in their endeavour to master the approach to System
Dynamics and their perceptions of its utility for the future careers. This is likely to vary among
various professional disciplines, and insights gained so far from trainee medical professionals is
discussed. The benefits of training in System Dynamics for medical professionals may be extended to
the training of other professions where, like clinical medicine, a systems approach has not
traditionally been used in the undergraduate training process.

                                                    9
A System Dynamics Approach to Understand the Implications of a
   Green Economy Transition in the Western Cape Province of South
                                                    Africa

Josephine K Musango*1, Alan C Brent2, Jacobus B Smit van Niekerk2, Willem D Jonker2, Aliza
         P Pienaar2, Theodore A York2, Juan Oosthuizen2, Lize Duminy2, Imke H de Kock 2

                          *1
                               Corresponding Author, Josephine.Musango@spl.sun.ac.za
    1
        School of Public Leadership, and the Centre for Renewable and Sustainable Energy Studies (CRSES),
                     Stellenbosch University, Private Bag X1 Matieland, 7602; South Africa
    2
        Department of Industrial Engineering, and the Centre for Renewable and Sustainable Energy Studies
   (CRSES), Stellenbosch University, Private Bag X1, Matieland, 7602, South Africa; Tel: +27 21 808 4069;
                                              Email: acb@sun.ac.za

ABSTRACT
The United Nations Environment Programme (2010) defines a green economy as “an economy that
will result in improved human well-being and social equity, while significantly reducing
environmental risks and ecological scarcities”. To this end, various bodies, policies and structures
have been aligned to address the effect of human progression (socially and economically) on the
earths’ limited natural resources.

Facilitating the transition to a green economy presents opportunities for national, provincial and
local governments. A number of initiatives (on all levels of government) relating to the green
economy within South Africa emerged at the 2010 Green Economy Summit, and the identified
drivers to a green economy include, amongst others: the need to move towards low carbon
economies; decreasing scarcity of material resources; and the need for improved and sustained
service delivery (South African Government, 2010). Previous studies developed frameworks and
models to identify and investigate the aspects of green economy transitioning within South Africa
(Musango et al., 2014) which could aid in managing the various green economy drivers without
noteworthy negative impacts on other sectors. However, Musango et al. (2015) noted that the
analysis of green economy transitions generally happens on a national level, while many of the
green economy interventions take place on a provincial or local government level. It is thus
recommended that a green economy analysis be conducted on provincial level, in order to
indicate to decision-makers and stakeholders what the effects and scale of investment and
intervention required are.

                                                       10
As part of the national initiative to address climate change, the Western Cape Government (2013)
created the Western Cape Green Economy Strategy Framework, which identifies five drivers for
transitioning to green economy. These drivers include: smart living and working, smart mobility,
smart ecosystems, smart agri-production, and smart enterprise. The study with which this paper is
concerned is guided by the said strategy and focusses specifically on water, agriculture, transport
infrastructure, renewable energies, energy production, CO2 emissions, and public services.
The vast majority of challenges relating to climate change and the depletion of limited natural
resources are due to the unintended and unforeseen consequences of past actions. For analysis
and assessment of such systems, an approach should thus be used that can indicate the complex
dynamic effects and relations of policies, strategies and decisions. System dynamics was
identified as a modelling approach that enables the understanding of complex real world
problems over time in order to guide decision-making to ultimately achieve sustainable long-term
solutions (Musango et al., 2015). The usefulness of system dynamics in describing complex
socio-ecologic systems has been established in previous studies (Musango et al., 2014), and was
subsequently used to build a model that encapsulates the transition to a green economy in the
Western Cape Province. Key variables and indicators were identified within the sectors that
contribute towards a green economy. The model aims to indicate the behaviour, or outcomes, of
these indicators until 2040, aiming to identify, and recommend on, strategic intervention points.
The developed model consists of sub-models that constitute a larger holistic model with
numerous interaction and feedback effects. There are 14 sub-models, of which some have been
further developed to subsequently deliver simulation results under different scenarios for each
sub-model. Three sub-models are in an advanced stage of development, these are the agriculture,
biofuel, and transport infrastructure models; and their preliminary results have yielded important
findings.
The agriculture model was developed to better understand the impact sustainable farming
(organic and conservation) practices would have on the food production sector of the Western
Cape Province. The model consists of the ten major food crop commodities (grains, vegetables
and fruit) produced in the Western Cape Province, and how their annual production is affected by
conventional, organic and conservation farming practices. Organic yield is assumed to be
significantly less than that of conventional food crop and can be applied to grains, vegetables and
fruit. Conservation yield is assumed to be more than conventional yield, but can only be applied
to grains. The agriculture model has three green economy scenarios and one business-as-usual
scenario, which is used as the baseline. The three green scenarios test different organic yield
cases, namely: where organic yield is 65%, 75% and 100% of that of conventional yield.
11Sustainable farming practices are also used more intensively in these three scenarios. The model
results highlighted the fact that if organic yields cannot match conventional yields, then
sustainable farming will not reduce CO2 emissions sufficiently to justify the significant financial
investment required.
The biofuel model was developed as part of a project and policy evaluation to determine the
feasibility and impacts of the Western Cape Province forming part of the National Mandatory
Biofuel blending policy. The effects of establishing a bioethanol plant, producing 160 million
litres per year using triticale as feedstock was modelled and it was found that a strong business
case for such a project exists. A biodiesel facility producing 35 million litres/year, using canola
as feedstock was deemed financially infeasible. The project evaluation further looked at the
alternative scenario where biofuel is produced elsewhere in the country and transported to the
Western Cape Province for blending. All of the scenarios were evaluated based on the financial
implications and effects on emissions and employment, to ultimately recommend the way forward
for the biofuel sector in the Western Cape Province. It was concluded that a large scale
bioethanol facility using biomass as energy source could prove beneficial to the Western Cape
Province as part of the transition to a green economy.
The transport infrastructure model was developed to analyse the strategic goals identified in a
green economy transition. These included the reduction of carbon emissions from municipal
transport networks, and the need for a vast investment into the development of a more energy
efficient and sustainable infrastructure network. The transport infrastructure model investigated
the implications and impacts of improving public transport, making private transport more
efficient, and creating a modal shift in freight transportation to rail as the crux. The key findings
of the research indicate that through the investment into a better public transport system, as well
as shifting the movement of freight onto the rail network, would have positive long-term
environmental, social and economic effects. These include reduced truck and private vehicle
numbers on the roads resulting in better road conditions, lower traffic densities, lower CO2
emissions, and reduced diesel and petrol demand within the Western Cape Province. For
example, the combination of the two major intervention strategies of public transport and rail
freight yielded a significant reduction in emissions from the transport sector, up to 17.89%,
compared to the business-as-usual scenario. However, a significant investment is required to
facilitate the transition of transport infrastructure, which is manageable and achievable through
strategic development.
This study aimed to build a knowledge base of, and insight into, the different systems and
complexities within the context of a green economy transition in the Western Cape Province
12across all sectors. This involved investigating the interplays between society, economics and the
environment in identifying how each sector operates and the importance it holds on all levels.
The system dynamics model for all major contributing sectors in the economy was developed,
and the various strategies and policy changes were simulated in comparison to a business as usual
scenario. This enabled the critical analysis of the impacts and implications of such strategies into
the future.
Keywords: agriculture, biofuel, transportation, infrastructure, green economy, system dynamics,
Western Cape Province.
REFERENCES
South African Government, 2010. Green Economy Summit report. Unpublished Report. Accessed on
28 August 2015, Available at: http://www.sagreenfund.org.za/wordpress/wp-
content/uploads/2015/04/Green-Economy-Summit.pdf
Musango, J. K., Brent, A. C., van Niekerk, J. B. S., Jonker, W. D., Pienaar, A. P., York, T. A.,
Oosthuizen, J., Duminy, L., and de Kock, I.H. A system dynamics approach to understand the
implications of a green economy transition in the Western Cape Province Anonymous A system
dynamics approach to understand the implications of a green economy transition in the Western
Cape Province, 2015. Conference of the System Dynamics Society, Boston, USA.
Musango J. K., Brent, A. C., and Bassi, A. M. 2014. Modelling the transition towards a green
economy in South Africa. Technological Forecasting and Social Change, 87, 257-273.
United Nations Environment Programme (UNEP), 2010. Driving a green economy through public
finance and fiscal policy reform. V1.0 ed.
Western Cape Government., 2013. Green is Smart. Accessed on 28 August 2015, Available at:
https://www.westerncape.gov.za/110green/sites/green.westerncape.gov.za/files/documents/Green-
Economy-Strategy-Framewok-2MB.pdf
13Project Prioritisation Using System Dynamics
Nombuso L Sibeko*1, Nalini S Pillay2, Simon Higgins3
1,2
Research, Testing and Development, Eskom, South Africa.
E-mails:1 sibekonl@eskom.co.za; 2pillayna@eskom.co.za
3
Generation, Eskom, South Africa, E-mail: higginsa@eskom.co.za
INTRODUCTION
A system dynamics methodology was followed to develop a decision support tool to assist in
strategic planning and multi-criteria project prioritisation while allowing dynamic scenario
changes to assess the impact of various project prioritisation decisions within a financially
constrained organisation. Most conventional project prioritisation methods evaluate and prioritise
projects in isolation with no interdependency consideration. The simulator compares the effects
of prioritising projects in isolation versus prioritising projects based on their interdependencies
with respect to funds allocation, time-to-benefit attainment and cost benefit trade-offs.
METHODOLOGY
Part of the system dynamics methodology involved developing a causal loop diagram (Figure 1),
to assist with identifying the potential key driving forces and their cause and effect relationships.
The initial prioritisation of a suite of projects is typically based on the impact the projects are
expected to have on improving the business unit’s key performance indicators (KPIs) which
should align with the company objectives. The projects that have the highest expected benefit will
be ranked higher; this determines the initial relative importance of the project. Figure 1 analyses
the forces that interact to reinforce or reduce the relative importance of the project. Loop R1
captures the effect of resource allocation, which is dependent on the relative importance of the
project, and the impact that resource allocation will have in closing the gap between the project’s
expected benefits and the actual benefits.
14Figure 1: Causal Loop Diagram
Loop R2 looks at senior management’s need to deliver and their preference to fund and resource
projects that will deliver in a short time frame. Loop R1 and R2 are bound by the project
management abilities. Loop R3 traces the effect of return on investment as the gap between the
expected benefit of the project and its actual benefit decreases.
A literature review was undertaken to understand global best practises for project prioritisation;
this served as the base case in the simulator, for project prioritisation with no dependency
considerations. The simple multi-attribute rating technique (SMART) was selected, this technique
was chosen due to its simplified algorithm; and it not being time intensive, which is important for
those involved in the decision making process (Zardari et al, 2015). SMART is utility-based and
has the ability to handle both quantitative and qualitative data. One of the limitations of this
technique is that it ignores the interrelationships between parameters and the ratings of the
alternatives are not relative, thus changing the number of projects evaluated will not in itself
change the decision scores of the original projects.
SMART requires the decision makers to identify the criteria that they deem important for project
prioritisation as well as the evaluation methods for the criteria. The decision makers must then
assign a weight to each criterion, and the weights must sum to 100. Seven criteria were identified,
15namely: strategic alignment to company objectives, project criticality, potential return on
investment, execution risk, project time frame, project enablers, and public perception.
Figure 2 shows the system architecture map (SAM) of the simulator, which provides an overview
of the simulator structures and the overall system bounded variables. The simulator has a time
frame of 60 months, and was developed using iSee Stella software with a project suite limited to
five.
The stakeholders in the assessment of projects include:
• An oversight committee: calibrates and initialises the simulator by assigning unique ranks
to the criteria and sub-criteria, the ranks are converted to weights, using rank order
centroid method (Roszkowska, 2013).
• Project team leaders: provide the project details relating to the criteria.
The criterion ranks and project data relating to the criterion are the exogenous inputs. The
projects are evaluated against each criterion and a criterion score calculated. The simulator
calculates a weighted average score for each project. The scores may be influenced by
externalities such as regulatory or legislative priorities. An interdependency prioritisation
schedule is also determined and the simulator then compares funds allocation, time-to-benefits
attainment and cost benefits trade-offs of the two prioritisation methods.
Figure 2: System Architecture Map
RESULTS
The simulator is still under development but the first phase of the simulator, looking at project
prioritisation with no interdependency, has been completed. A suite of 5 projects with the Water
Research Portfolio was chosen as the pilot test case. The simulator was initialised by a contingent
of research strategy managers. Four of the five projects had a legislative requirement with the
same deadline of 28 February 2022. The project scores were between 62.25 and 52.49. The
16project data for project evaluation was very similar as the projects are from the same environment
and work together in fulfilling their intended purposes. However, there was still enough
variability between projects for the simulator to determine a prioritisation schedule. The project
prioritisation schedule after legislative requirements were considered normalised the ratings of 4
projects to within the same range (62.10-62.25).
CONCLUSIONS
These results will be compared to those obtained in the second phase of simulator development;
however, initial engagements with subject matter experts validated the results from experience.
The second phase of the simulator is the development of the prioritisation schedule of the projects
based on their interdependencies and to compare funds allocation, time to benefits attainment and
cost-vs-benefits for the two prioritisation methods.
Keywords: Eskom, Inter-dependency, Prioritisation, Project, System Dynamics
ACKNOWLEDGMENTS
Danie Booyens and Corne du Plooy
REFERENCES
1. Eskom, Eskom Integrated Report, 31 March 2015
2. Eskom Holdings, Corporate Plan 2015/16, Revision 3, 2015
3. E. Roszkowska, Rank Odering Criteria Weighting Methods – A comparative Overview, 2013
4. N.H Zardari, Z.B Yusop, K Ahmed, Weighting Methods and their Effects on Multi-Criteria
Decision Making Model Outcomes in Water Resources Management, Springer, 2015
17Using System Dynamics Methodology to Simulate Various
Demineralised Water Production Plants in Eskom
(Corne) J.H.C. Du Plooy*1, Nalini S Pillay2
*1,2
Research, Testing and Development, Eskom, South Africa.
E-mails:*1dplooyjo@eskom.co.za; 2pillayna@eskom.co.za)
ABSTRACT
Demineralized (demin) water is when the ions and minerals are removed from the water so that the
water can be used for a specialized process. In Eskom, this water is used in the water/steam cycle to
produce electricity. During this cycle, the liquid water in the system is heated to high pressure and
temperature steam to drive the turbines and generator. During this evaporation process, any minerals
will precipitate and potentially form scaling inside of the boiler tubes. This could easily lead to boiler
tube leaks due to insufficient cooling caused by scaling. The other possible consequence is corrosion
on the boiler tubes which could lead to boiler tube leaks (PDH). To prevent these damages in plant
that cannot be sustainably maintained, they have to negate these consequences by using demin water.
Two of the most prominent technology types used for demin water production is membrane filtration
in the form of reverse osmosis and deionization in the form of ion exchange resin (ENViCARE). The
first technology works on the principle of forcing dirty water through an extremely fine chemically
active filter through the use of high pressures. These high pressures are very energy intensive and
easily damage the membranes which then needs to replaced and are very expensive.
Ion exchange works on the principle of trading one ion type in solution with an ion located inside the
resin. One of the drivers of this process is the selectivity of the ion in the raw water to the ion in the
resin (DOWEX, 2000). This selectivity causes the ion in the solution to exchange places with the ion
in the resin. This takes place until the resin does not have significant exchange points left, or the raw
water does not have a high enough concentration of ions (which will influence the selectivity). What
gives this process the edge in its class, is that it is completely reversible. So the ions which are
absorbed by the ion exchange process can be removed through the process called regeneration. During
regeneration a very strong acid or base (depending on the type of resin) will exchange places with the
ions in the resin resulting in the ability to reuse the resin to treat the raw water again.
18There are two different classifications of ions. They are either positive referred to as cations or
negative, anions. The cations can be ions such as Sodium, Magnesium, Calcium (Na+, Mg2+, Ca2+) etc.
The anions can be ions like Sulphate, Chlorine, Carbonic acid (SO42-, Cl-, HCO3-) etc. These two types
of ions are absorbed by two types of resin. The resin are generally referred to cation or anion resin.
Cation resins have the ability to remove cations out of the raw water while the anion resin can remove
the anions inside of the raw water.
Eskom’s use of these resins varies with respect to process configurations depending on the power
station. The differences in configuration of the demin trains were investigated and then a system
dynamics model, using iSee Stella, was built for the different configurations. Station visits revealed
that depending on the water quality and age of the technology, the process configuration was
different. It was different to such an extent that separate, structural simulations had to be constructed
for each of the power stations. One set of vessels (cation, anion, mixed bed) is defined as a train. Each
train is designed to cope with the demin water consumption of the whole station. The other two are for
regeneration and one is kept on standby. In Eskom, three of each of these sets of vessels is found on
the station. This focus of the paper is to highlight the learning lessons while simulating the different
configurations.
The first difference in process is due to the initial design of vessel layout. The basic building blocks
are cation vessels, anion (weak base and strong base) vessels, mixed beds, and the degasser.
Depending on the water quality, these vessels will be selected as well as their sizes and flows
specified for operation. Besides the vessel types, there are also the inherent system choices that were
made when it was designed. There were three different types observed from three different stations at
Eskom, namely: Duvha, Kriel and Grootvlei. The first being series train operation, the second is
cross-feeding from the one train to the other and the last (oldest) is the use of common sumps between
the vessels. The workings for 2 of these systems are discussed further in this extended abstract.
All three of these systems look very different and require different structures but their outputs are
very similar. The first series train operation, the three trains are connected in such a way to keep each
train separate. This configuration can be seen in
Figure 1. The difficulty of integrating the three trains mathematically was investigated using iSee
Stella and some feedback loops were allocated to the system. One difficulty was deciding when to put
which trains online and offline. Since not all the trains should be online at the same time to prevent
synchronized exhaustion of the beds, there was System Dynamics Structure built to incorporate the
priority of the trains and current status of the trains. The user then specifies how many trains should
optimally be online at the same time and the simulation will then strive to reach this number of trains
by putting trains on standby or taking them off of standby. Another tricky part of train integration was
19the system limit of only being able to do one type of regeneration at a time. This was handled by
creating one regeneration structure for each type of vessel. It was constructed in such a way that it will
work like a bottle neck and only allows one regeneration action through at a time.
The Common Sump Configuration was where each of the trains’ cation outflows enters into the same
degasser sump. From this common sump, water is drawn to the anion vessels (A1, A2, A3 in diagram)
and then again flows into the common Anion Sump. In this case the mathematics required the vessels
to be regarded as separate production units and the train switching explained above was required for
each type of vessel.
Figure 1: Series Train and Common Sump Configuration
The sumps introduce two new state variables which require to be monitored so that demin water can
be produced. The regeneration structure uses feedback loops for the regeneration process. Another
long term system operation effect is when the Brine Washes are skipped. This will lead to the
reduction in throughput of the anions and ultimately reduce the amount of demin water that the plant
can produce in one cycle.
The final process was using the data that was available from the station to re-create the history of the
stations results and compare that to what the simulations gave. This data evaluation, interpretation and
analysis are referred to as data mining and are discussed in this project. The different configurations
required a different approach to solve the problem of simulating the system. The system is complex in
the sense of integration and regeneration of trains.
20In conclusion, using a system dynamics approach was very different than the conventional method of
linear optimization. In linear optimization regeneration would easily be done by just switching on and
off by using a discreet variable, but by using System Dynamics, a stock and flow had to be used to
simulate the process. This resulted in multiple stock-flow diagrams to simulate the different vessels
and regeneration. It was interesting to use stocks to keep track of statuses of the vessels. The feedback
effect of skipping regenerations was built into the structure and this was relatively easy to do in a
system dynamics model and the effect could be seen on the anion throughputs. Another aspect that
made the use of stocks and flows easier was that the tanks as well as vessel throughputs, these could
easily be represented as stocks. It is therefore possible to use a system dynamics tool to simulate an
operational complex system.
Keywords: Eskom, System Dynamics, Demin Water Production, Ion Exchange, Simulation
ACKNOWLEDGMENTS
Stephanie Marais, Willem Pienaar, Andre Groenewald, Sidwell Muthavhine, Nqobile Kolobe.
REFERENCES
DOWEX, 2000, Fundamentals of Ion Exchange, Dow liquid Separations, retrieved from:
http://msdssearch.dow.com/PublishedLiteratureDOWCOM/dh_0032/0901b803800326ca.pdf?filep
ath=liquidseps/pdfs/noreg/177-01837.pdf&fromPage=GetDoc, Date of Access: 27 August 2015
ENViCARE Technologies Pvt. Ltd., Demineralization (DM) Water Treatment Plants, Retrieved from:
http://www.envicaresystems.com/demineralization-water-treatment-plants-pune.html, Date of
Access: 1 Sep 2015
PDH, Boiler Water-Problems & Solutions, PDH Course M165, Retrieved from:
http://www.pdhonline.org, Date of access: 1 Sep 2015.
21Using SD Modelling to Explore the Complex Social, Biophysical and
Political Interactions Involved in Establishing Water Security within
the Selati Catchment in the Limpopo Province of South Africa.
W. Jonker*1, T. York1, J.K. Clifford-Holmes2, H. Retief2 and S. Pollard2
1
Department of Industrial Engineering, Stellenbosch University, SOUTH AFRICA
E-mails: *15608700@sun.ac.za; 16062221@sun.ac.za
2
Association for Water and Rural Development (AWARD), No. 14 Safari Junction, Hoedspruit, Limpopo, 1380,
South Africa.
E-mails: jai.clifford.holmes@gmail.com, hugo@award.org.za, sharon@award.org.za
ABSTRACT
RESILIM-O is a project implemented by the Association for Water and Rural Development
(AWARD), which aims to enhance resilience of people and ecosystems in the Limpopo River
Basin through improved water resource management and conservation of biodiversity and
ecosystems. The Selati water catchment area in the Limpopo Province is a unique area due to the
multitude of social, environmental and political factors affecting water security and direct
dependence on water in the area. The Selati River is a major tributary to the Olifants River which
flows through the Kruger National Park and into the Massinger dam in Mozambique. The key
concerns in the Selati catchment are centered on establishing water security (in terms of flow and
quality) for functioning ecosystem services in support of human activities. The recreational and non-
consumptive benefits of potable flowing water in the region are also of great relevance and
importance.
The Selati catchment can be divided into three regions (upper, middle and lower) categorised by
distinct activities within each of the regions. The upper Selati is dominated by commercial
agricultural activities which places the river system under immense pressure, as the majority of
these agricultural activities are under irrigation. The upper Selati further contains within it a
variety of socio-ecological complexities, through communities impacting and being directly
dependent on ecosystem services provided by the river system. A Land reform and restitution
programme is one of the big drivers for change in social, land use and water use dynamics in the
upper region. The middle Selati is mainly comprised of game farms, who use ground water to
sustain ecosystems and very little social interaction is present within this region. The impacting
factors in the lower Selati region are diverse and some of the country’s largest mining operations
22are situated on the banks of the Selati River. Although mines are required to comply with water
licensing requirements, the dynamics influencing the enforcement and monitoring of mining
discharge are complex and inefficient. Mining tailing dams (currently unlined) pose a serious threat
to ecosystem services downstream. The water quality is further influenced by three Waste Water
Treatment Works (WWTW) discharging into the river. Water quality regulations are in place to
monitor and regulate the quality of discharge by individual WWTW, however, the cumulative effects
of the three WWTW situated in close proximity combined with seepage and possible spills from the
mining sector, could have major downstream impacts on human health and well-being, functioning
ecosystems and ecotourism. Communities, private game farms, farmers and the Kruger National Park
are some of the parties directly influenced by poor water quality.
Land reform is causing the land use to change and results in changing water use and availability
patterns. An irrigation scheme (which sees the majority of the Selati River diverted into an irrigation
canal) in the upper Selati has severe impacts water use in the area. The Selati River, which was once
perennial, no longer achieves the flow required to sustain ecosystems and communities that are
dependent on the river. The impacts of the mining and WWTW on flow and quality of the river has
also raised some concern in the lower Selati. Various communities within the Selati catchment rely on
the ecosystem services and recreational uses provided and sustained by the river. Unforeseen or
unexpected changes in water quality and flow could be detrimental to local communities. The impact
on ecotourism within the game reserves downstream could also have major implications from an
economic perspective.
Existing land use and hydrology models can indicate the expected biophysical impacts of mining
activities, climate change and policy change scenarios with great accuracy. However, there is a need,
for a platform that can incorporate both quantitative and qualitative elements of the real world
problems in the Selati catchment with existing models. System Dynamic Modeling (SDM) is
proposed as an approach that can simulate the real world behavior of systems, where inputs can be
drawn from existing models. A system dynamic model (ResiMod) serves as a central platform to
combine the accuracy of the available biophysical models with the socio-ecological aspects of the
catchment.
Figure 2 schematically shows the iterative interaction between ResiMod and the existing models,
where ResiMod will draw both quantitative and qualitative data from the models. These models
include a Water Quality Systems Assessment Model (WQSAM) and Global Climate Models (GCMs)
which are downscaled to the Limpopo basin.
23ResiMod
Figure 2: Interaction between ResiMod, WQSAM, the land model and downscaled GCMs.
ResiMod will be built through some initial “traditional” behind the scenes modelling and then
progress to incorporate elements of group model building, participatory stakeholder engagement and
Agile SD modelling to ensure that the socio-ecological system is accurately rendered. ResiMod
comprises of multiple sub-models rather than one large model and incorporates land uses into the
following sub-models:
Water resources (surface and ground water and inter-flow);
Human population (domestic water demand);
Water-related human health and well-being;
Industrial activities (in particular, water uses of mining);
Agricultural activities (in particular, the water uses of commercial and subsistence
farming);
Wastewater and its conveyance/collection and treatment;
Potable water (including formal reticulation networks and water-treatment works
supplying urban and peri-urban settlements, as well as informal access to drinking water);
Environmental water requirements;
Water use and overall water balance.
24It is expected that the model will accurately portray the biophysical characteristics of the catchment
and its reactions and interactions with social, economic and political drivers identified in the region.
The quantitative simulation results will provide valuable insights into the complexities involved in
water resource management with regards to managerial and infrastructure capacity development and
compliance monitoring and enforcement activities.
ResiMod as a product of the SDM process will be used as a tool to facilitate learning and discussions
between the participating stakeholders. It is envisaged that the model be used as part a social learning
experience, where the impacts and effects of factors like climate change, different management
strategies, policy interventions, maintenance and investment strategies are indicated to key role
players within the system, to illustrate the value of systemic thinking. The outcomes of this study will
further provide simulation results that can be used to inform stakeholders and policy makers across all
sectors in order to approach and manage the Selati catchment in a way that will ensure water security
(quality and quantity) to sustain ecosystems, livelihoods and economies.
Keywords: catchment management; ecosystem services; integrated water resource management;
Limpopo; water security; water services.
ACKNOWLEDGMENTS
The authors would like to express appreciation for the support of the RESILIM-O programme, which
is funded by the United States Agency for International Development under USAID Southern Africa
– RFA-674-12-000016 RESilience in the LIMpopo Basin Program (RESILIM).
25System Dynamics Simulation using Non-Traditional Platforms
Danie Booyens*1, Nalini S Pillay2, Bhongo Mdunge3
*1,2
Research Testing and Development, Eskom, South Africa.
E-mail: *1booyend@eskom.co.za; 2 pillayna@eskom.co.za
3
Outage Planning, Eskom, South Africa; E-mail: mdungeba@eskom.co.za
INTRODUCTION
The South African electricity utility, Eskom SOC, is currently undergoing a shortfall in
generating capacity against a backdrop of increasing electricity demand, a problem that has
inculcated in load shedding. This problem is exacerbated by the current state of Eskom’s ageing
power stations and the need to perform scheduled maintenance, whilst retaining commitment to
deliver on the new build program. If this maintenance is not done, power stations will continue
to degrade and the unplanned capacity losses resulting from this degradation will worsen
electricity supply constraints and furthermore, potentially result in safety risks. Undertaking the
maintenance, however, means that specific power station units would be unable to generate power
for the duration of the maintenance, again adding to supply shortfall.
A simulator was developed using the system dynamics methodology as outlined in John
Sterman’s Business Dynamics to understand the complex interactions surrounding the balance
between the need for maintenance, the need to supply electricity and the long-term impacts of
short-term decisions.
Simulator development was undertaken using iSee Stella and an outage scheduling tool was
successfully constructed. The simulation time frame was selected as 10 years, from 2015 to 2025,
to run at a daily resolution. The simulator also needed to run on a “per unit” basis, modelling
each generating unit at all the Eskom power stations, as these are treated individually when
considering maintenance. This resulted in the simulator having to deal with 3650 days’ worth of
data for 91 generating units, around 33210 data points in total. While iSee Stella is able to deal
with this information, simulation time was slowed to roughly 10 minutes per scenario run and
exporting data from Stella to Excel resulted in consistent system crashes.
In order to resolve this problem, the simulation development platform was migrated from iSee
Stella, a traditional system dynamics tool using fixed structures (stocks, flows etc.), to Visual
26Basic programming in MS Excel, a platform not traditionally associated with system dynamics at
all.
INITIAL CHALLENGES
A key advantage for the use of Stella to simulate Eskom problems is the ability to create a user
interface, allowing senior management, who would be unfamiliar with the modelling
environment, to engage with the simulation and run scenarios.
Figure 1 shows how an interface page was constructed using MS Excel, with Visual Basic based
macros programmed directly into the light-grey buttons. The user is also able to enter
information into the blue cells, allowing some level of interaction and scenario analysis. This
method does not produce interfaces which are as dynamic and user friendly as is the case with
Stella, but it was a workable solution.
Figure 3 - Outage Scheduling Simulator Control Sheet
System dynamics simulation requires core concepts such as stock-flow dynamics to be observed.
This is easy to maintain in specially designed software, but required direct care to be taken when
programming in a different environment as specific cells had to be considered as stocks, equations
relating to them being treated appropriately.
27CONCLUSIONS
Moving from a programming background into a system dynamics frame simulation environment can
be challenging as system dynamics simulation software does not afford the modeller the opportunity
to use programming tools such as loops, functions and procedures. System dynamics software is
intentionally designed around structure, if the stock flow structure has not been built appropriately,
the simulation will not return reasonable results. This can prove to be both a challenge and a boon to
modellers as while it can be difficult to resolve structural problems, inconsistencies between results
and expectations point directly to problems with assumptions or structure, no time is wasted working
through complex equations or code, rather the modeller can immediately begin revising his
understanding of the system and adjusting the simulation accordingly.
The key value of a system dynamics simulation tool lies in the thinking and methodology required to
construct a stock-flow feedback system which represents a complex system. Without the initial
simulator development in iSee Stella, this thinking would never have been developed for the Outage
Scheduling Simulator Tool discussed above, and the model could not have been completed with the
required degree of functionality.
MS Excel does offer some benefits in terms of results visualisation. Figure 2 shows a graph generated
by the MS Excel based tool where planned maintenance requirements are represented as stacked bar
charts and available capacity for maintenance is represented as a red line.
Figure 4 - Stacked Bar Chart View of Planned Maintenance
28In summary, while the specific aspects of this problem necessitated the use of a modelling tool not
traditionally associated with system dynamics, it is not a methodology that this author would
recommend as a standard, and in fact would not have been possible at all without first exploring a
system dynamics tool.
Keywords: Eskom, Maintenance, System Dynamics, Project
ACKNOWLEDGMENT
Mpumi Motsoadi
REFERENCES
Sterman, J.D. 2000. Business Dynamics.
29System Dynamics Modelling of Situation Awareness
R. Oosthuizen*1 and L. Pretorius2
1,
CSIR, South Africa; E-mail: roosthuizen@csir.co.za
2
Department of Engineering and Technology Management, University of Pretoria, South Africa; E-mail:
Leon.Pretorius@up.ac.za
ABSTRACT
Theory on Sociotechnical System (STS) provides a framework to approach modelling and
analysis of Command and Control (C2) systems. A STS consists of social and cognitive humans
applying technology to perform work through a process within a social structure (organization)
towards achieving a defined objective. Work can become complex due to dynamic and context
dependent interaction between people, technology and the environment. STS tends to be
developed through piecewise replacement of subsystems with new technology with the support of
systems engineering. Systems engineering uses modelling to gain insight into complex systems
and support answering questions on system requirements.
Modelling is used to explore structural, functional, and operational elements of the problem and
solution space. Cognitive Work Analysis (CWA) and System Dynamics (SD) have been
demonstrated as a modelling methodology for complex STS. CWA is a framework to analyze the
way people perform work in an organization while taking the environmental constraints into
consideration. The outputs of CWA are constructs that support modelling the structure and
behavior of the system and environment. Functions provided by different technological elements
are linked to the functional requirements of the system to achieve its purpose. However, CWA is
limited in investigating the dynamic effect of decisions and policies on the system. The dynamic
behavior of the complex STS can be analyzed with SD which uses the structure of the system for
simulation. SD looks at the effect of feedback and delays on the operation of the system as a
result of decisions based on policies.
The purpose of C2, as a force multiplier, is to bring all available information and assets to bear on
an objective to ensure the desired effects through effective utilization of limited resources. C2
consist of planning an advantageous encounter with an adversary with appropriate resources at
the right place and time. C2 processes and systems support humans in designing courses of action
through problem solving within a military context and control their execution. Endsley defines
30situation awareness as “the perception of elements in the environment within a volume of time
and space, comprehension of their meaning and projection of their status into the near future”.
Situation awareness is seen as a critical but elusive constituent for successful decision-making in
complex and dynamic systems, such as military C2, nuclear power plants, air traffic control,
emergency response and aviation.
This paper employs a SD model to investigate the effect of different variables on situation
awareness through modelling and simulation. The situation awareness model and CWA
constructs are used to support developing a CLD as seen in Figure 1. These models are the basis
for identification of important variables and the causal relationships between them in the system.
The elements in the Values and Priority Measures layer of the ADH provide guidance to identify
the variables in the CLD. The Purpose Related Functions shows how the variables inter relate
while the functional models indicate how the loops connect.
Figure 1. Causal Loop Diagram.
The structure of the SFD in Figure 2 is derived from the CLD with inputs from Endsley’s
situation awareness model and Boyd’s OODA loop. The stock that flows through the model is
“information”. Information is gathered, distributed, processed and displayed to support planning
and decision-making. Variables are added to represent the external environment as well as to
match the variables' dimensions and units. Situation awareness also has a limited time value as it
is affected by changes due to own force actions and the environment. The purpose of the SFD is
to support simulations that assess the impact of the technology's different capabilities on the
dynamic behavior of the whole system.
31Modelling and simulation support learning about the system and the impact of a new technology
on situation awareness. The insights gained from the modelling can support planning of
experiments for measurement. Future work includes modelling the effect of different types of
information with different delays and timespans. Monte Carlo type simulations may also be used
to assess the relationships between the variables of the models.
This paper demonstrates how SD can be applied in support of a SE process. SD support learning
about the problem situation that needs to be resolved through implementation of a new
technology.
Figure 2. Stock and Flow Diagram.
Keywords: Command and Control; Cognitive Work Analysis; Situation Awareness; System Dynamics.
REFERENCES
Alberts, D. S., “The Agility Advantage: A Survival Guide for Complex Enterprises and Endeavours”,
CCRP Publication, ISBN 978-1-893723-23-8, USA. 2011
Buede, D. M., “Engineering Design of Systems - Models and Methods”, John Wiley & Sons, 2000.
Endsley, M. R., Bolté, B., Jones, G., “Designing for situation awareness: an approach to user centred
design”, CRC Press, Taylor & Frances Group, 2003.
Hitchins, D. K., “Systems Engineering: a 21st Century Systems Methodology”, Wiley.com, 2008.
32You can also read