Situation Analysis of Children in Tuvalu - Unicef
←
→
Page content transcription
If your browser does not render page correctly, please read the page content below
Situation Analysis of Children in Tuvalu
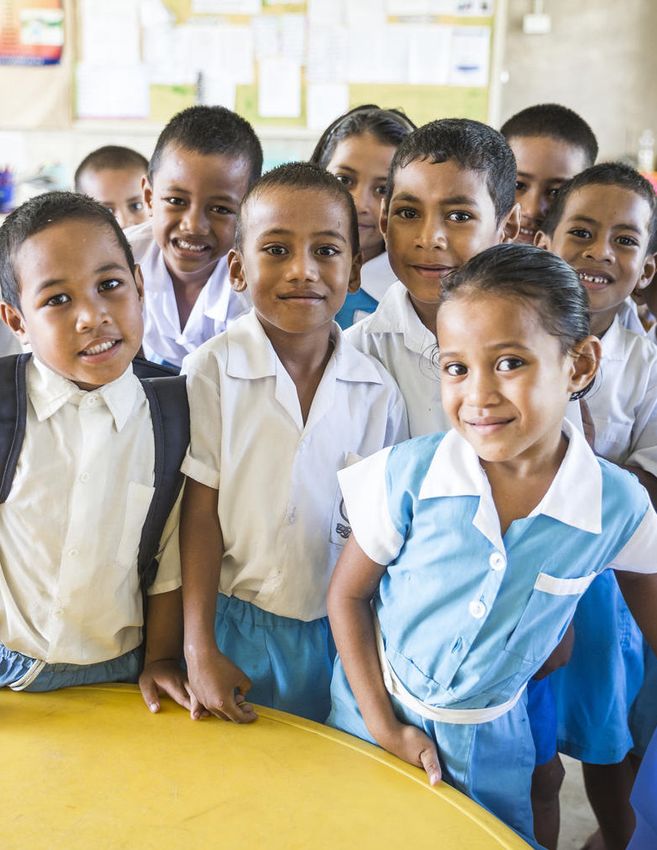
©United Nations Children’s Fund (UNICEF), Pacific Office, Suva

December 2017

This report was written by Kirsten Anderson, Ruth Barnes, Awaz Raoof and Carolyn Hamilton, with the assistance
of Laura Mertsching, Jorun Arndt, Karin Frode, Safya Benniche and Kristiana Papi. Maurice Dunaiski contributed
to the chapters on Health and WASH. Further revision to the Child Protection chapter was done by Shelley Casey.

The report was commissioned by UNICEF Pacific, which engaged Coram International, at Coram Children’s Legal
Centre, to finalise the Tuvalu Situation Analysis.

The Situation Analyses were managed by a Steering Committee within UNICEF Pacific and UNICEF EAPRO, whose
members included: Andrew Colin Parker; Gerda Binder (EAPRO); Iosefo Volau; Laisani Petersen; Lemuel Fyodor
Villamar; Maria Carmelita Francois; Settasak Akanimart; Stanley Gwavuya (Vice Chair), Stephanie Kleschnitzki
(EAPRO); Uma Palaniappan; Vathinee Jitjaturunt (Chair) and Waqairapoa Tikoisuva.

The contents of the report do not necessarily reflect the policies or views of UNICEF. UNICEF accepts no
responsibility for error.

Any part of this publication may be freely reproduced with appropriate acknowledgement.

Suggested citation. United Nations Children’s Fund, Situation Analysis of Children in Tuvalu, UNICEF, Suva, 2017

Cover Image: UNICEF Pacific/2017
Situation Analysis of Children in Tuvalu
2       S i t u a t i o n A n a l y s i s o f C h i l d r e n i n Tu v a l u

Table of Contents

Executive Summary....................................................................................................................4
Acronyms.....................................................................................................................................8

     1. Introduction.................................................................................................................... 10
        1.1. Purpose and scope................................................................................................... 10
        1.2. Conceptual framework............................................................................................. 11
        1.3. Methods and limitations..........................................................................................13
        1.4. Governance and validation ......................................................................................14

     2. Context...........................................................................................................................15
        2.1. Geography and demographics.................................................................................16
        2.2. Main disaster and climate risks................................................................................ 17
        2.3. Government and political context.............................................................................19
        2.4. Socio-economic context...........................................................................................20
        2.5. Legislative and policy framework.............................................................................24
        2.6. Treaty body monitoring............................................................................................25

     3. Health and Nutrition......................................................................................................26
        3.1. Child mortality..........................................................................................................27
        3.2. Child health, immunization and communicable diseases.........................................29
        3.3. Maternal health........................................................................................................31
        3.4. Violence against women and girls............................................................................31
        3.5. Adolescent health....................................................................................................32
             3.5.1. Fertility and contraceptive use......................................................................32
             3.5.2. HIV/AIDS and STIs........................................................................................33
             3.5.3. Substance abuse..........................................................................................34
             3.5.4. Mental health................................................................................................36
        3.6 Nutrition...................................................................................................................36
             3.6.1. Child stunting and wasting............................................................................37
             3.6.2. Low birth weight and underweight...............................................................37
             3.6.3. Anaemia........................................................................................................37
             3.6.4. Overweight and obesity................................................................................38
             3.6.5. Breastfeeding................................................................................................38
        3.7 Key barriers and bottlenecks....................................................................................40
             3.7.1. Climate and disaster risks.............................................................................40
             3.7.2. Changing lifestyles and community behaviour ............................................40
             3.7.3. Health financing and workforce....................................................................41
Ta b l e o f C o n t e n t s   3

4. Water, Sanitation and Hygiene.....................................................................................42
   4.1. Access to improved water sources..........................................................................43
   4.2. Access to improved sanitation facilities...................................................................47
   4.3. WASH in schools, menstrual hygiene management and disabilities........................52
   4.4. Barriers and bottlenecks...........................................................................................53
        4.4.1. Climate change and disaster risks.................................................................53
        4.4.2. Equity ...........................................................................................................53
        4.4.3. Data and information.....................................................................................54

5. Education........................................................................................................................55
   5.1. Context.....................................................................................................................57
   5.2. Early childhood education .......................................................................................59
        5.2.1. Access and quality........................................................................................59
        5.2.2. Barriers and bottlenecks................................................................................61
   5.3. Primary and secondary education............................................................................62
        5.3.1. Access..........................................................................................................63
        5.3.2. Quality...........................................................................................................65
        5.3.3. Barriers and bottlenecks................................................................................66
   5.4. Tertiary and vocational education.............................................................................67

6. Child Protection .............................................................................................................69
   6.1. Child protection risks and vulnerabilities..................................................................72
        6.1.1. Nature and extent of violence, abuse, neglect and exploitation of children..... 72
        6.1.2. Community knowledge, attitudes and practices...........................................75
   6.2. The child protection system .................................................................................... 76
        6.2.1. The legal and policy framework for child protection .....................................77
        6.2.2. Child protection structures, services and resourcing....................................81
        6.2.3. Mechanisms for inter-agency coordination, information management
               and accountability.........................................................................................84
   6.3. Other child protection issues...................................................................................85
        6.3.1. Birth registration...........................................................................................85
        6.3.2. Children with disabilities...............................................................................86

7. Social Protection............................................................................................................87
   7.1. Profile of child and family poverty and vulnerability.................................................89
   7.2. Bottlenecks and barriers to ensuring an effective social protection system............91

8. Conclusions ...................................................................................................................93
   8.1. Climate change and disaster risks ...........................................................................93
   8.2. Financial and human resources................................................................................94
   8.3. Geography................................................................................................................94
   8.4. Equity ......................................................................................................................94
   8.5. Gender.....................................................................................................................94
   8.6. Impacts of poverty and vulnerability........................................................................95
   8.7. Legal and policy framework.....................................................................................95
   8.8. Cultural norms and approaches................................................................................95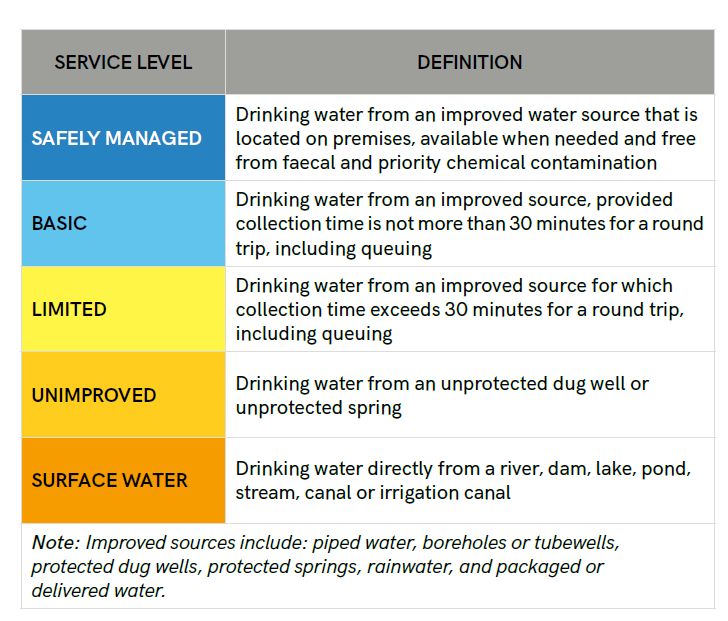
4     S i t u a t i o n A n a l y s i s o f C h i l d r e n i n Tu v a l u

Executive Summary

Introduction                                                                 Key barriers and bottlenecks

This report aims to present a comprehensive                                  The following key barriers and bottlenecks were
assessment and analysis of the situation of children                         identified from the full situation analysis of children
and women in Tuvalu. It provides an evidence base                            and children in Tuvalu.
to inform decision-making across sectors that are
relevant to children and women, and it is particularly                       Climate change and disaster risks: Tuvalu is
intended to contribute to the development of                                 vulnerable to increases in the sea level, storm
programmes and strategies to protect, respect and                            surges, coastal flooding and seasonal cyclones. A
fulfil the rights of children and women in 14 Pacific                        key finding is that climate change and disaster risks
Island Countries and Territories (PICTs): the Cook                           have a considerable impact on all sectors in relation
Islands, the Federated States of Micronesia, Fiji,                           to the realisation of children and women’s rights in
Kiribati, the Marshall Islands, Nauru, Niue, Palau,                          Tuvalu.
Samoa, Solomon Islands, Tokelau, Tonga, Tuvalu,
and Vanuatu.                                                                 Financial and human resources: Although Tuvalu
                                                                             is an upper middle-income country, financial
Tuvalu is one of the Pacific’s smallest states, made                         constraints act as a barrier to the realisation of rights
up of nine small islands in the Polynesian part of                           in several sectors. A lack of available resources
the Pacific Ocean. The 2012 census places the                                across nearly all government departments
total population of Tuvalu at 10,837 people, roughly                         translates into a lack of financial resources for the
32 per cent of whom are under the age of 15 years.                           delivery of services and systems for children, and it
Tuvalu is a classified as an upper middle income                             is also linked to a lack in human resources (training
country. As a coral atoll nation, Tuvalu is extremely                        and expertise) in several sectors. In relation to health
vulnerable to climate change-induced increases in                            services, for example, a key challenge is the lack
the sea level. Furthermore, storm surges, coastal                            of medical professionals to care for the population.
flooding, and seasonal cyclones pose significant                             In relation to education, the reliance on external
risks.                                                                       donor support and large budget allocations towards
                                                                             funding salary costs raise challenges in developing
This report covers the child outcome areas of health                         sustainable education reform, and funding much-
(including nutrition), water, sanitation and hygiene                         needed developments in infrastructure and teacher
(WASH), education, child protection (including child                         training.
justice) and social protection. By assessing and
analysing the situation for children and women in                            Equity: While several important findings in relation
relation to these outcomes and in relation to relevant                       to equity were made, a lack of disaggregated data
Sustainable Development Goals (SDGs), this report                            prevents a comprehensive equity analysis. Children
seeks to highlight trends, barriers and bottlenecks                          and women in rural areas generally experience
in the realisation of children’s and women’s rights                          reduced outcomes and access to basic services
in Tuvalu.                                                                   compared to those in urban areas. The legal and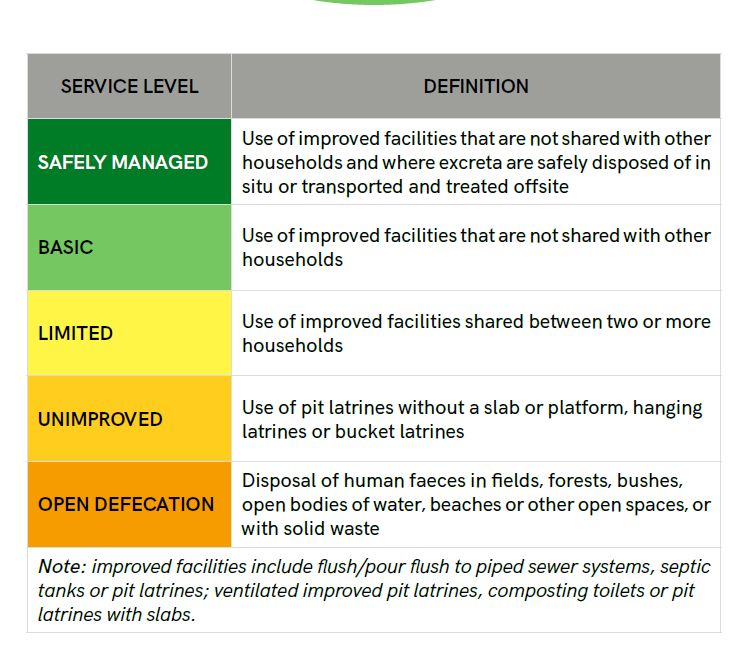
Executive Summary              5

policy framework contains specific gaps in its
protection of girls with disabilities and the protection
of boys from sexual offences.

The impacts of poverty are significant in Tuvalu,
and children and families are highly exposed to risk
and economic shocks, particularly those caused
by natural disasters. The lack of comprehensive
social protection and other social welfare services
is a significant gap and limits the ability of the
Government to lift vulnerable persons out of
poverty and support economic growth. The lack
of opportunities for adolescents and young people
perpetuates cycles of poverty and has led to
unhealthy behaviours, such as drug and alcohol
abuse, as well as mental health issues. The
indirect and direct costs of accessing education
are denying children from socio-economically
deprived families from realising their right to
education.

Cultural norms and approaches: Reliance
on and preference for informal justice leads to
underreporting of cases involving child sexual
abuse, violence against children and other crimes
against children, and to such cases being handled
within villages. Community attitudes towards
violence against children and corporal punishment
pose a particular child protection risk. Informal
practices in child justice may contribute to the
realisation of children’s rights as they represent
an informal diversion option, and working with
informal practices to support child-friendly justice
should be explored.

Data availability: There are useful data sources in
some sectors in Tuvalu. However, this report also
identified several data gaps, and the absence of this
data is, in itself, a key finding. For example, there
is limited to no information on WASH in schools,
menstrual hygiene management, and access to
WASH for vulnerable groups. There is also a lack of
data about children with disabilities, other vulnerable
groups, and out-of-school-youth.
6 S i t u a t i o n A n a l y s i s o f C h i l d r e n i n Tu v a l u
Snapshot of outcome areas
Tuvalu’s child mortality rates have been declining steadily over recent decades.
However, despite this progress, Tuvalu has not yet been able to meet
international child mortality reduction targets. Immunization coverage in Tuvalu
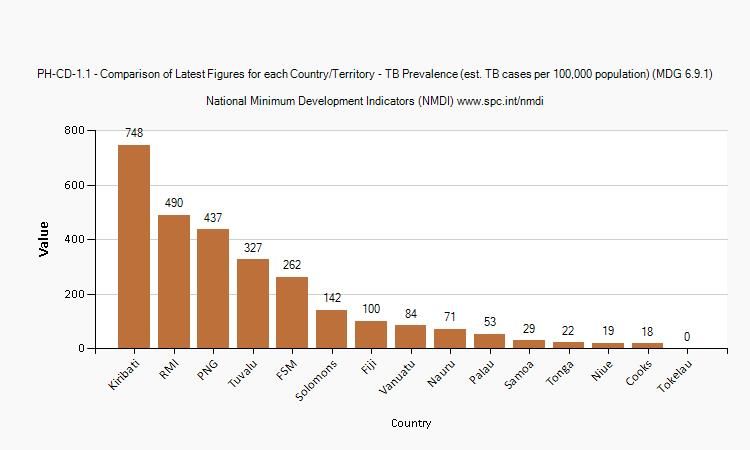
is largely adequate. As of 2013, Tuvalu had an estimated 327 tuberculosis (TB)
cases per 100,000 population: the fourth-highest TB prevalence rate in the
Pacific region (including Papua New Guinea). Tuvalu records an unadjusted
maternal mortality ratio of zero: a figure that needs to be interpreted with
caution, given the small number of vital events in Tuvalu. Antenatal coverage
for at least one visit stands at 97 per cent; 93 per cent of women deliver their
Health
babies in a health facility; and 98 per cent of deliveries are attended by a skilled
attendant, which indicates near-universal coverage. At 31 per cent, Tuvalu’s
contraceptive prevalence rate is lower than the PICTs-wide average of 35 per
cent. Some 24 per cent of married women have an unmet need for family
planning. Tuvalu has one of the highest per capita rates of HIV/AIDS in the
Pacific, and, at 21 per cent, the highest chlamydia prevalence amongst 15-24-
year olds in the PICTs region. On a positive note, alcohol use and attempted
suicide rates amongst school children aged 13-15 are some of the lowest in
the PICTs region.
In Tuvalu, around 10 per cent of children under 5 years are stunted, which
compares favourably to regional rates. Childhood wasting prevalence
stands at 3 per cent, which is amongst the lowest rates in the PICTs region.
Childhood underweight and low birth weight are relatively minor problems
Nutrition in Tuvalu. Obesity and associated non-communicable diseases represent a
significant health concern. Nearly 50 per cent of school children aged 13-15
are considered overweight, and 21 per cent are obese. Some 35 per cent of
children in Tuvalu receive exclusive breastfeeding for the first 6 months after
birth, which is the second-lowest rate in the PICTs region.
Improved water coverage in Tuvalu stands at a universal 98 per cent, which is
significantly above the PICTs average. However, access to improved sanitation
WASH facilities is more limited, at only 83 per cent. Open defecation is still practiced
by around 4 per cent of the population. Tuvalu’s rural areas have, on average,
lower improved sanitation coverage than urban areas.
Executive Summary 7
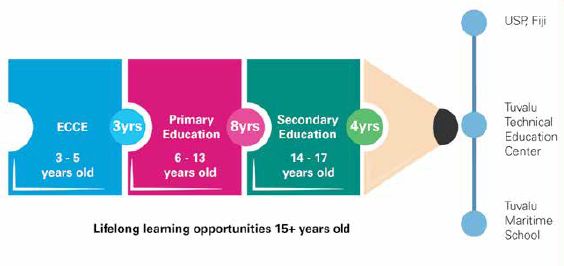
The net enrolment rate (NER) for early childhood education (ECE) in Tuvalu has
decreased in recent years, from 76 per cent in 2012 to 69 per cent in 2015. Fees
are significant barriers to accessing ECE for children from socio-economically
disadvantaged families. The primary education NER also decreased from an
Education almost universal 97.4 per cent in 2013 to 82 per cent in 2015. In contrast, the
secondary education NER increased from a low of 50 per cent in 2013 to 56
per cent in 2015. Access to primary and secondary education for children with
disabilities is an area of concern, with currently only one privately run special
needs school.
Protection against corporal punishment is weak in Tuvalu, and available data
indicates that children experience violence in several contexts, including at
home, in schools and in the community. Anecdotal evidence suggests that
Child there is still a general culture of authoritarian parenting and reliance on physical
protection methods to discipline children. However, there is a lack of up-to-date statistical
data on its nature, extent and causes. Child labour provisions do not meet
international standards as the minimum age for hazardous work is too low, at
15 years, rather than 18 years.
Some 26 per cent of Tuvalu’s population were found to be living below the
basic needs poverty line, as of 2010, with trends pointing upwards. However,
the prevalence of food poverty is very low at around 3 per cent. A social
insurance scheme exists, but only applies to (mostly male) formal public-
Social
sector employees who make up 20 per cent of the population. It excludes
protection
the majority of workers who operate in the informal economy and is therefore
not targeted towards the poorest members of society. Traditional safety
nets (including, for example, religious institutions such as churches) play an
important role, but are limited in their ability to respond to covariate shocks.
8    S i t u a t i o n A n a l y s i s o f C h i l d r e n i n Tu v a l u

Acronyms

AIDS Acquired Immune Deficiency Syndrome
ART Antiretroviral Therapy
AU Australia
CED Committee on Enforced Disappearances
CEDAW Convention on the Elimination of Violence Against Women
CESCR Committee on Economic, Social and Cultural Rights
CRC Convention on the Rights of the Child
CRMW International Convention on the Protection of the Rights of All Migrant Workers and
Members of their Families
CRPD Convention on the Rights of Persons with Disabilities
DFAT Australian Department of Foreign Affairs and Trade
DHS Demographic and Health Survey
EAPRO East Asia and Pacific Regional Office
ECCE Early Childhood Care and Education
ECE Early Childhood Education
EFA Education for All
FAO Food and Agriculture Organization of the United Nations
GADRRRES Global Alliance for Disaster Risk Reduction and Resilience in the Education Sector
GDP Gross Domestic Product
GER Gross Enrolment Rate
GPI Gender Parity Index
GSHS Global School-based Health Survey
HIV Human Immunodeficiency Virus
ICCPR International Covenant on Civil and Political Rights
ICESCR International Covenant on Economic, Social and Cultural Rights
ICT Information and Communication Technology
JMP WHO/UNICEF Joint Monitoring Programme for Water Supply, Sanitation and Hygiene
MDG Millennium Development Goal
MHM Menstrual Hygiene Management
MoEYS Ministry of Education Youth and Sport
NACCRC National Advisory Committee on the Convention on the Rights of the Child
NCD Non-Communicable Disease
NER Net Enrolment Rate
NGO Non-Governmental Organization
NMDI National Millennium Development Indicator
ODA Official Development Assistance
PICTs The 14 Pacific Island Countries that are the subject of the Situational Analyses
PNG Papua New Guinea
Acronyms   9

SDG Sustainable Development Goal
SitAn Situational Analysis
SOWC State of the World’s Children
SP Strategic Programme
SPC Pacific Community
STI Sexually Transmitted Infection
TB Tuberculosis
TESP II Tuvalu Education Strategic Plan 2011-2015
TVET Technical Vocational Education and skills Training
UN United Nations
UNAIDS The Joint United Nations Programme on HIV/AIDS
UNDP United Nations Development Programme
UNESCAP United Nations Economic and Social Commission for Asia and the Pacific
UNESCO United Nations Educational, Scientific and Cultural Organization
UNFPA United Nations Population Fund
UNICEF United Nations Children’s Fund
UNICEF SitAn Procedural Manual UNICEF’s ‘Guidance on Conducting a Situation Analysis of
Children’s and Women’s Rights’ (March 2012)
UNISDR United Nations International Strategy for Disaster Reduction
UK United Kingdom
US United States
US$ United States Dollar
VAWG Violence against Women and Girls
WASH Water, Sanitation and Hygiene
WHO World Health Organization
10       S i t u a t i o n A n a l y s i s o f C h i l d r e n i n Tu v a l u

1.
Introduction

1.1. Purpose and scope

This report aims to present a comprehensive assessment and analysis of the situation of children
in Tuvalu. It is intended to present an evidence base to inform decision-making across sectors
that are relevant to children and to be instrumental in ensuring the protection and realisation of
children’s rights. It is particularly intended to contribute to the development of programmes and
strategies to protect, respect and fulfil the rights of children in the Pacific Island Countries and
Territories (PICTs).

In accordance with the approach outlined in the UNICEF Procedural Manual on Conducting a
Situational Analysis of Children’s and Women’s Rights (‘UNICEF SitAn Procedural Manual’), the
specific aims of this Situation Analysis (SitAn) are as follows:

     •    To improve the understanding of all stakeholders of the current situation of children’s
          rights in the Pacific, and the causes of shortfalls and inequities, as the basis for develop-
          ing recommendations for stakeholders to strengthen children’s rights.

     •    To inform the development of UNICEF programming and support national planning and
          development processes, including influencing policies, strategies, budgets and national
          laws to contribute towards establishing an enabling environment for children that ad-
          heres to human rights principles, particularly in regard to universality, non-discrimination,
          participation and accountability.

     •    To contribute to national research on disadvantaged children and leverage UNICEF’s con-
          vening power to foster and support knowledge generation with stakeholders.
Introduction 11
• To strengthen the knowledge base to enable assessment of the contribution of devel-
opment partners, including UNICEF and the UN, in support of national development
goals.1
This SitAn report focuses on the situation of children (persons aged under 18 years old), adolescents
(aged 10-19) and youth (aged 15-24).2 In addition, an assessment and analysis of the situation
relating to women is included, to the extent that it relates to outcomes for children (for example,
regarding maternal health).
1.2. Conceptual framework
The conceptual framework is grounded in the relationship between child outcomes and the
immediate, underlying and structural determinants of these outcomes, and is adapted from the
conceptual framework presented in UNICEF’s SitAn Procedural Manual. A rights-based approach
was adopted for conceptualising child outcomes, which are presented in this SitAn according
to rights categories contained in the UN Convention on the Rights of the Child (CRC). These
categories also correspond to UNICEF’s Strategic Programme (SP) Outcome Areas. Child outcomes
are therefore grouped into: Health/nutrition; WASH (‘survival rights’); Education (‘development
rights’); Child protection; and Social protection (‘protection rights’).
The aim of the child outcomes assessment component of this SitAn was to identify trends
and patterns in the realisation of children’s rights and key international development targets, and
any gaps, shortfalls or inequities in the realisation of these rights and targets. The assessment
employed an equity approach, and highlighted trends and patterns in outcomes for groups of
children, identifying and assessing disparities in outcomes according to key identity characteristics
and background circumstances (e.g. gender, geographic location, socio-economic status, age and
disability).
A number of analytical techniques were employed to analyse immediate, underlying and structural
causes of child outcomes. These included:
• Bottlenecks and barriers analysis: A structured analysis of the bottlenecks and barriers
that children and groups of children face in the realisation of their rights, with reference
to the critical conditions and determinants3 (quality; demand; supply and enabling envi-
ronment) needed to realise equitable outcomes for children.
The analysis is also informed by:
1 UNICEF. 2012. Guidance on Conducting a Situation Analysis of Children’s and Women’s Rights, pp. 5-6
http://www.unicefinemergencies.com/downloads/eresource/docs/Rights%20based%20equity%20focused%20
Situation%20Analysis%20guidance.pdf [30.01.17].
2 These are the age brackets used by UN bodies and agencies for statistical purposes without prejudice to other
definitions of ‘adolescence’ and ‘youth’ adopted by Member States.
3 Based on the 10 critical determinants outlined in Table 3 on page 20 of UNICEF’s SitAn Procedural Manual.12 S i t u a t i o n A n a l y s i s o f C h i l d r e n i n Tu v a l u
• Role-pattern analysis: The identification of stakeholders responsible for and best placed
to address any shortfalls and inequities in child rights outcomes.
• Capacity analysis to understand the capacity constraints (e.g. knowledge; information;
skills; will and motivation; authority; financial and material resources) on stakeholders
who are responsible for or best placed to address the shortfalls and inequities.
The analysis did not engage in a comprehensive causality analysis, but immediate and underlying
causes of trends, shortfalls or inequities are considered throughout.
The analysis was deliberately risk-informed and took an equity approach. An equity approach
seeks to understand and address the root causes of inequality so that all children, particularly
those that suffer the worst deprivations in society, have access to the resources and services
necessary for their survival, growth and development.4 In line with this approach, the analysis
included an examination of gender disparities and their causes, including: a consideration of the
relationships between different genders; relative access to resources and services; gender roles;
and the constraints faced by children according to their gender.
A risk-informed analysis requires an analysis of disaster and climate risks (hazards; areas of
exposure to the hazard; and vulnerabilities and capacities of stakeholders to reduce, mitigate
or manage the impact of the hazard on the attainment of children’s rights). This is particularly
relevant to the PICTs where climate change and other disaster risks exist. A risk-informed analysis
also includes an assessment of gender and the vulnerabilities of particular groups of children to
disaster and climate risks.
A rights-based framework was developed for measuring child outcomes and analysing role-
patterns, barriers and bottlenecks. This incorporates the relevant rights standards and development
targets (particularly the Sustainable Development Goals [SDGs]) in each of the child outcome
areas. This is set out briefly below.
Table 1.1: Assessment and analysis framework by outcome area
Outcome area Assessment and analysis framework
Health and • CRC (particularly the rights to life, survival and development and to
nutrition health)
• SDGs (particularly SDG 3 on ensuring healthy lives and promoting
well-being)
• Global Strategy for Women’s, Children’s and Adolescents’ Health
(2016–2030)
• WHO’s Global Nutrition Targets (child stunting; anaemia; low
birthweight; obesity/overweight; and breastfeeding)
4 UNICEF NYHQ. 2010. Re-focusing on Equity: Questions and Answers, p. 4.Introduction 13
WASH • CRC (Article 24)
• SDGs (particularly SDG 6 on ensuring availability and sustainable
management of water and sanitation for all)
Education • CRC (Articles 28 and 29)
• Article 13 of International Covenant on Economic, Social and Cultural
Rights (ICESCR)
• SDGs (particularly SDG 4 on ensuring inclusive and quality education
for all and promoting lifelong learning)
• Comprehensive School Safety Framework1
Child protection • CRC (Articles 8, 9, 19, 20, 28(2), 37, 39 and 40)
• SDGs (particularly SDGs 5, 8, 11 and 16)
Social protection • CRC (Articles 26 and 27)
• ICESCR rights to social security (Article 9) and adequate standard of
living (Article 11)
• SDG target 1 (end poverty in all its forms everywhere)
1.3. Methods and limitations
This SitAn includes a comprehensive review, synthesis and examination of available data from a
variety of sources. The assessment of child outcomes relied primarily on existing datasets from
household surveys, administrative data from government ministries and non-governmental
organizations (NGOs) and other published reports.5 Key datasets were compiled from the UNICEF
Statistics database (available at: https://data.unicef.org/) and Secretariat of the Pacific Community
(SPC) National Minimum Development Indicators (NMDI) database (available at: https://www.spc.int/
nmdi/).6 The compilation of the 2016 State of the World’s Children (SOWC) report was utilised as the
latest available reliable data (available at: https://www.unicef.org/sowc2016/). SPC’s NMDI database
also compiles data produced through national sources.7 Other institutional databases such as from
the World Bank, UNICEF/WHO Joint Monitoring Programme, WHO and United Nations Educational,
Scientific and Cultural Organization (UNESCO) Institute of Statistics were used where relevant.
The analytical techniques used for the analysis phase required a synthesis and analysis of
secondary data and literature, including small-scale studies and reports. It also included a mapping
and analysis of relevant laws, policies, and Government/SP Outcome Area strategies.
One of the limitations of the methodology is the lack of recent, quality data in relation to some
of the areas covered by the analysis. These gaps are noted throughout the report. The analysis
5 These datasets were reviewed and verified by UNICEF.
6 Data from national sources and other reputable sources is compiled and checked for consistency before being
registered in UNICEF Statistics database and used for the annual SOWC’s Report.
7 The database is updated as new data becomes available.14 S i t u a t i o n A n a l y s i s o f C h i l d r e n i n Tu v a l u of causes and determinants of rights shortfalls relied heavily on existing published reports and, therefore, some areas in the analysis have not been the subject of robust and recent research. Again, gaps are highlighted as necessary. A further limitation was the tight timeframe and limited duration according to which this SitAn has been produced. This required the authors to determine priority areas of focus and to exclude some matters from the analysis. This also led to limitations to the extent of, for example, the causality analysis (which is considered but does not include problem trees), and the role pattern and capacity gap analyses, which inspire the presentation of the information but have not necessarily been performed formally for all duty-bearers. 1.4. Governance and validation The development and drafting of this SitAn has been guided by a UNICEF Steering Committee (comprising Andrew Colin Parker; Gerda Binder; Iosefo Volau; Laisani Petersen; Lemuel Fyodor Villamar; Maria Carmelita Francois; Settasak Akanimart; Stanley Gwavuya [Vice Chair], Stephanie Kleschnitzki; Uma Palaniappan; Vathinee Jitjaturunt [Chair] and Waqairapoa Tikoisuva), which supported the assessment and analysis process by providing comment, feedback and additional data and validated the contents of this report. This governance and validation provided by the Steering Committee was particularly important given the limitations in data gathering and sourcing set out above.
Context           15

                                                                                         2.
                                                                                   Context

Map 2.1: Map of Tuvalu

Source: Pacific Community, 20168

8   Pacific Community. 2016. Human Rights in the Pacific: A Situational Analysis. Available at: http://rrrt.spc.int/images/
    PDF_Files/Human_Rights_In_The_Pacific_A_Situational_Analysis.pdf.
16 S i t u a t i o n A n a l y s i s o f C h i l d r e n i n Tu v a l u
2.1. Geography and demographics
Tuvalu is located in the western Pacific, and is one of the Pacific’s smallest States, made up of nine
small islands, including the main island and capital, Funafuti,9 and other islands of Nanumanga,
Nanumea, Niulakita, Niutao, Nui, Nukufetau, and Vaitupu.10 Prior to achieving independence from
the United Kingdom (UK) on 1 October 1978, Tuvalu was known as the Ellice Islands, and separated
from the Gilbert Islands after a referendum in 1975.11
Figure 2.1: Population of Tuvalu (total), (2017)
11,500
11,001
11,000
10,531
10,500
10,000
9,500 9,420
9,000
8,500
2000 2001 2002 2003 2004 2005 2006 2007 2008 2009 2010 2011 2012 2013 2014 2015 2016 2017
Source: World Bank Data, 201712
The most recent World Bank data placed the total population at 11,000 people13 in 2015, roughly
4,000 of whom were under 18 years of age, and 1,000 of whom were under one year of age.14 There
was a population growth rate of 0.4 per cent, and the predicted growth rate for 2015 to 2030 is 0.5
per cent.15 Life expectancy in Tuvalu is 67.4 for men and 71.9 for women.16
9 Commonwealth, Tuvalu, Overview, Available at: http://thecommonwealth.org/our-member-countries/tuvalu.
10 Ibid.
11 Tuvalu Government, About Tuvalu, Available at: http://www.tuvaluislands.com/about.htm.
12 World Bank Data, Tuvalu, Population, total, 2015, Available at: http://data.worldbank.org/indicator/SP.POP.
TOTL?end=2015&locations=TV&start=2000.
13 Ibid.
14 UNICEF, State of the World’s Children, 2016.
15 Ibid.
16 2010 statistic, https://www.cia.gov/library/publications/the-world-factbook/geos/tv.html.Context 17
The official languages of Tuvalu are Tuvaluan and English, with Samoan and Kiribati being spoken
in certain areas.17 Tuvalu’s ethnic makeup is largely homogeneous: 94 per cent are Polynesian and
the remaining 4 per cent are Micronesian.18 The country is majority Christian. Some 98.4 per cent
of Tuvaluans identify as Protestant, with 1.4 per cent of these Seventh-Day Adventists, while a
further 1 per cent identify as Bahai, and 0.6 per cent as ‘other’.19
2.2. Main disaster and climate risks
Situation
Analysis
of
Children
in
Tuvalu
Climate change is one of the greatest threats to Tuvalu. As a coral atoll nation, rising temperatures
and sea levels pose a serious threat to the population.20 As illustrated in Figure 2.2, annual and
seasonal
maximum
seasonal maximum and
minimum
and minimum temperatures
temperatures have have
increased
increased in
Funafuti
in Funafuti since 1950.since
These 1950.
These
2122
increases
are
consistent
with
the
global
pattern
of
warming.
Significantly,
sea
levels
increases are consistent with the global pattern of warming. Significantly, sea levels have have
also
risen
also
risen as a result of melting glaciers and ice23sheets. In addition, the islands experience increased
as
a
result
of
melting
glaciers
and
23ice
sheets.
In
addition,
the
islands
experience
increased
risk
from
22
risk from 24 tropical cyclones.
tropical
cyclones.
Figure
2.2:
AFigure
verage
2.2: temperature
increase
(1950-‐2010)
Average temperature increase (1950-2010)
25
Source:
Pacific
Source: Climate
PacificCClimate
hange
Change
Science
Program,
Science Program, 2016.
201624
In
view
of
this,
scientists
predict
that
temperatures
will
continue
to
increase
in
Tuvalu.
By
2030,
this
increase
is
predicted
to
be
in
the
range
of
0.4-‐1.0°C.26
Sea
levels
are
also
predicted
to
continue
rising.
17 Ibid.
As
shown
in
18Figure
2.3,
by
2030,
under
a
high
emissions
scenario,
levels
will
rise
by
4
to
14
cm,
http://www.spc.int/prism/images/downloads/2015_Pocket-Statistical-Summary.pdf.
increasing
the
19 CIA likelihood
and
World Factbook. severity
of
storm
surges
and
coastal
flooding.
Furthermore,
less
Op. cit.
frequent
but
more
intense
tropical
cyclones
are
predicted.27
20 Tuvalu Government, Tuvalu and Global Warming. Available at: http://www.tuvaluislands.com/warming.htm.
21 International climate change adaption initiative. 2011. Pacific Climate Change Science Program, Current and future
climate of Tuvalu. Available at: http://www.pacificclimatechangescience.org/wp-content/uploads/2013/06/4_PCCSP_
Figure
2.3:
Sea
level
rise
relative
to
1990
(cm),
(1950-‐2100)
Tuvalu_8pp.pdf.
22 Ibid.
23 For example, Cyclone Pam (2015), See: http://www.worldbank.org/en/news/press-release/2015/09/15/tuvalu-gets-
continued-support-for-cyclone-pam-recovery.
24 Pacific Climate Change Science Program. Op. cit.18 S i t u a t i o n A n a l y s i s o f C h i l d r e n i n Tu v a l u
In view of this, scientists predict that temperatures will continue to increase in Tuvalu. By 2030,
this increase is predicted to be in the range of 0.4-1.0°C.25 Sea levels are also predicted to continue
rising. As shown in Figure 2.3, by 2030, under a high emissions scenario, levels will rise by 4 cm to
14 cm, increasing the likelihood and severity of storm surges and coastal flooding. Furthermore,
less frequent but more intense tropical cyclones are predicted.26
Figure 2.3: Sea level rise relative to 1990 (cm), (1950-2100) June
2017
Source:
Pacific
Climate
Change
Science
Program,
2016.2827
Source: Pacific Climate Change Science Program, 2016.
Tuvalu’s
current
policy
to
address
climate-‐related
threat
is
the
Te
Kaniva,
the
Tuvalu
Climate
Change
Policy,
which
details
the
strategic
policies
to
be
undertaken
from
2012
to
2021
to
mitigate
the
effects
Tuvalu’s current
of
climate
change.29
policy to address climate-related threat is the Te Kaniva, the Tuvalu Climate
Change Policy, which details the strategic policies to be undertaken from 2012 to 2021 to mitigate
2.3
Government
the effects of a nd
political
climate change.28context
Tuvalu
achieved
is
a
constitutional
monarchy
with
a
parliamentary
democracy.
The
British
sovereign
is
head
of
state
and
is
represented
by
the
Governor-‐General,
who
must
be
a
citizen
of
Tuvalu
and
is
appointed
by
the
head
of
state
on
the
recommendation
of
the
Prime
Minister.30
The
unicameral
25 Ibid. Parliament,
called
Fale
I
Fono,
has
the
power
to
make
laws.
It
has
15
elected
members,
26 cIbid.
omprised
of
two
members
each
from
seven
islands,
and
one
member
from
the
smallest
populated
27 island,
Ibid. Nukulaelae.31
Tuvalu
operates
a
‘first
past
the
post’
electoral
system,32
with
elections
held
every
four
years,
or
sooner
if
Parliament
is
dissolved
by
the
Governor-‐General
in
28 Te Kaniva, Climate Change Policy 2012, Accessible at: https://www.pacificclimatechange.net/document/te-kaniva-
tuvalu-climate-change-policy-2012-tuvaluan-version.
accordance
with
the
constitution.33
The
voting
age
is
18
years
of
age
and
members
of
parliament
are
elected
by
universal
suffrage.
Context           19

2.3. Government and political context

Tuvalu is a constitutional monarchy with a parliamentary democracy. The British sovereign is head
of state and is represented by the Governor-General, who must be a citizen of Tuvalu and is
appointed by the head of state on the recommendation of the Prime Minister.29

The unicameral Parliament, called Fale I Fono, has the power to make laws. It has 15 elected
members, comprised of two members each from seven islands, and one member from the
smallest populated island, Nukulaelae.30 Tuvalu operates a ‘first past the post’ electoral system,31
with elections held every four years, or sooner if Parliament is dissolved by the Governor-General
in accordance with the constitution.32 The voting age is 18 years of age and members of parliament
are elected by universal suffrage.

There are no political parties in Tuvalu. The current Prime Minister is The Rt. Hon. Enele Sopoaga,
who was elected on 4 August 2013, following a vote of no confidence against the previous Prime
Minister, Willy Telavi. Prime Minister Enele Sopoaga was re-elected uncontested in the 2015
election.33

Equal gender representation in Pacific national parliaments has not yet been achieved. As of
March 2017, women members represent 7 per cent of Pacific Island parliaments. In Tuvalu, only 1
of the 15 elected members of parliament is a woman: Dr. Puakena Boreham.34

Tuvalu’s main effort to include young people in governance and decision-making processes comes
in the form of the Tuvalu National Youth Council. The Council was established as part of the wider
Pacific Islands network of National Youth Councils, following Tuvalu’s declaration of independence
in 1978, and seeks to “encourage young people to take an active role in the development of
their respective island communities and at the national level.”35 The Council is mandated to work
alongside the Government’s youth department within the Ministry of Home Affairs and Rural
Development.36 The vision of the Tuvalu Pacific Youth Council is “to foster the spiritual, mental,
physical and social development of the young people of Tuvalu.”37

29   Commonwealth, Tuvalu: Constitution and Politics, available at: http://thecommonwealth.org/our-member-countries/
     tuvalu/constitution-politics.
30   Tuvalu Government, Basic Information and Electoral History, available at: http://www.tuvaluislands.com/gov_info.
     htm.
31   Regional Rights Resource Team, Human Rights in the Pacific, 2016. Available at: http://rrrt.spc.int/publications-media/
     publications/item/download/313_3695645ff8e36dd9b8c5ff8b2fd05c31.
32   Tuvalu Government, Basic Information and Electoral History. Op. cit.
33   Commonwealth, Tuvalu: Constitution and Politics. Op. cit.
34   Pacific women in politics http://www.pacwip.org/women-mps/national-women-mps/.
35   Tuvalu National Youth Council, available at: http://www.pacificyouthcouncil.org/tuvalu.php.
36   Ibid.
37   Ibid.
20 S i t u a t i o n A n a l y s i s o f C h i l d r e n i n Tu v a l u
2.4. Socio-economic context
The most recent national development plan for Tuvalu is the TE KAKEEGA III National
Strategy for Sustainable Development 2016 to 2020. This has, as its vision “a more
protected, secure and prosperous Tuvalu; healthier people and more engaged in
national, regional and international forums; and a government fully committed to
honouring Tuvalu’s international commitments and respecting its partnerships.”38
Tuvalu is classified as an upper middle-income country, and the most up-to-date figures place
its Gross Domestic Product (GDP) at US$32,673,278.39 As illustrated in Figure 2.4, following a
substantial period of growth, Tuvalu’s economy has experienced decline since 2012, with GDP
dropping from US$39,875,750.67 to US$32,673,277.74 in 2015.40 However, growth rates have
been positive in recent years, increasing from 0.2 per cent in 2012 to 2.6 per cent in 2015.41
June
2017
Figure
2.4:
GDP
(current
US$)
Figure 2.4: GDP (current US$)
43
Source:
World
Bank
Data,
2015.
Source: World Bank Data, 201542
In
2014,
Tuvalu
received
US$49.6
million
in
Official
Development
Assistance
(ODA).44
As
illustrated
in
Figure
2.5,
most
bilateral
aid
came
from
New
Zealand
(US$12.21
million).
Significant
contributions
were
also
made
by
Japan
(US$9.94
million),
Australia
(US$7.55
million)
and
the
International
Development
Association
(US$6.41
million).45
38 Government of Tuvalu, TE KAKEEGA III National Strategy for Sustainable Development 2016 to 2020, https://www.
adb.org/sites/default/files/linked-documents/cobp-tuv-2017-2019-ld-02.pdf [4.8.17].
39 World Bank Data, GDP (current US$), 2015, Tuvalu, Available at: http://data.worldbank.org/indicator/NY.GDP.MKTP.
CD?locations=TV; World Bank list of economies (March 2017) http://databank.worldbank.org/data/download/site-
content/CLASS.xls.
40 Ibid.
41 World Bank Data, GDP Growth (annual %), 2012-2015, Tuvalu, http://data.worldbank.org/indicator/NY.GDP.MKTP.
KD.ZG?end=2015&locations=TV&start=2012&year_high_desc=false.
42 Ibid.
Context 21
In 2014, Tuvalu received US$49.6 million in Official Development Assistance (ODA).43 As
illustrated in Figure 2.5, most bilateral aid came from New Zealand (US$12.21 million). Significant
contributions were also made by Japan (US$9.94 million), Australia (US$7.55 million) and the
International Development Association (US$6.41 million).44
Situation
Analysis
of
Children
in
Tuvalu
Figure 2.5: Top Ten Donors of Gross ODA for Tuvalu (2014-2015 average, US$ 46million)45
Figure
2.5:
Top
Ten
Donors
of
Gross
ODA
for
Tuvalu
(2014-‐2015
average,
US$
million)
Source:
OECD,
Aid
charts
at
a
glance,
2014-‐2015.4746
Source: OECD, Aid charts at a glance, 2014-2015
As
illustrated
in
Figure
2.6,
bilateral
aid
received
by
Tuvalu
was
allocated
mainly
to
economic
infrastructure
development
(31
per
cent)
and
to
multi-‐sector
development
projects
(26
per
cent).
Asper
illustrated 48
Ten
cent
was
inspent
Figure on
2.6, bilateralservices.
education
aid received
by Tuvalu was allocated mainly to economic
infrastructure development (31 per cent) and to multi-sector development projects (26 per cent).
Figure
Ten per 2.6:
cent
Bilateral
was spentODA
bon
y
Seducation
ector
for
Tservices.
uvalu
(2014-‐2015,
47 US$
million)
Tuvalu’s economic resources and sources of revenue are extremely limited, partly owing to its
size. Tuvalu’s main sources of revenue are fishing licenses, small-scale copra exports, the sale of
postage stamps and coins, the sale of passports and the resale of rights to international telephone
codes, as well as overseas remittances.48
Consequentially, the country relies heavily on international aid and the Tuvalu Trust Fund.
Established in 1987, the Trust Fund contained an initial value of AU$27.1 million, contributed
to mainly by New Zealand, Australia and the UK, along with Tuvalu. The most recent valuation
valued the fund at AU$127 million in 2012.49 The Trust Fundhas been a significant source of
economic stability for Tuvalu, especially during periods of economic decline. It is intended to
Source:
OECD,
Aid
charts
at
a
glance,
2014-‐2015.49
Tuvalu’s
economic
resources
and
sources
of
revenue
are
extremely
limited,
partly
owing
to
its
size.
43 OECD, ODA, Tuvalu, available at: http://www.oecd.org/dac/financing-sustainable-development/development-finance-
Tuvalu’s
main
sources
of
revenue
are
fishing
licenses,
small-‐scale
copra
exports,
the
sale
of
postage
data/aid-at-a-glance.htm.
stamps
44 Ibid. and
coins,
the
sale
of
passports
and
the
resale
of
rights
to
international
telephone
codes,
as
well
overseas
remittances.50
45as
Ibid.
46 Ibid.
Consequentially,
47 Ibid. See Figure the
5. country
relies
heavily
on
international
aid
and
the
Tuvalu
Trust
Fund.
Established
in
48 The Commonwealth, 1987,
the
Tuvalu:
Trust
Economy,
Fund
contained
available at:an
http://thecommonwealth.org/our-member-countries/tuvalu/
initial
value
of
AU$27.1
million,
contributed
to
mainly
by
New
Zealand,
Australia
and
the
UK,
along
with
Tuvalu.
The
most
recent
valuation
valued
economy.
49 Ibid.
46
Ibid.
47
Ibid.
22 S i t u a t i o n A n a l y s i s o f C h i l d r e n i n Tu v a l u
underwrite the costs of local government,
Source:
OECD,
Aid
charts
at
a
glance,
2014-‐2015.
encourage
47 decentralisation, enhance capacity and
achieve development finance for the country. 50
As
illustrated
in
Figure
2.6,
bilateral
aid
received
by
Tuvalu
was
allocated
mainly
to
economic
infrastructure
development
(31
per
cent)
and
to
multi-‐sector
development
projects
(26
per
cent).
Ten
per
cent
was
spent
on
education
services.48
Figure 2.6: Bilateral ODA by Sector for Tuvalu (2014-2015, US$ million)
Figure
2.6:
Bilateral
ODA
by
Sector
for
Tuvalu
(2014-‐2015,
US$
million)
49
Source:
OECD,
Aid
charts
at
a
glance,
2014-‐2015.
Source: OECD, Aid charts at a glance, 2014-2015.51
Tuvalu’s
economic
resources
and
sources
of
revenue
are
extremely
limited,
partly
owing
to
its
size.
Tuvalu’s
main
sources
of
revenue
are
fishing
licenses,
small-‐scale
copra
exports,
the
sale
of
postage
stamps
and
coins,
the
sale
of
passports
and
the
resale
of
rights
to
international
telephone
codes,
as
50
well
on
Data as
opoverty
verseas
rin
emittances.
Tuvalu is limited.
However, according to the most recent Household Income
and Expenditure Survey (2010), 26.3 per cent of the population lives below the national basic
Consequentially,
the
country
relies
heavily
on
international
aid
and
the
Tuvalu
Trust
Fund.
needs poverty
Established
in
line,
1987,
and
the
rates
Trust
are higher
Fund
in thean
Outer
contained
initial
Islands
value
of
than in Funafuti.
AU$27.1
52
million,
contributed
to
mainly
by
New
Zealand,
Australia
and
the
UK,
along
with
Tuvalu.
The
most
recent
valuation
valued
Levels of inequality appear to be moderate in comparison with the PICTs; according to the
2010
46
Ibid.
Household and Income Expenditure Survey, the Gini coefficient in Tuvalu was 0.34. This
47
measurement
Ibid.
is generally thought to represent a reasonable level of inequality (with 0.30 to 0.35
48
Ibid.
See
Figure
5.
generally
49
Ibid.
accepted as being ‘reasonable’).53
50
The
Commonwealth,
Tuvalu:
Economy,
Available
at:
http://thecommonwealth.org/our-‐member-‐
countries/tuvalu/economy.
As illustrated below, inequality as measured by the Gini coefficient has dropped significantly from
1994, though it rose between 2004 and 2010, and this has been attributed to the decline in world
22
trade
between 2008 and 2010 due to the global economic crisis, and a decline in the number
of Tuvaluan seamen working abroad.54 Between 2004 and 2010, the share of expenditure by
households in the lowest quintile fell from 10.2 per cent of all expenditure in 2004 to 8.1 per cent
in 2010.55 Interestingly, no significant difference in the degree of inequality was found between
Funafuti and the Outer Islands.
50 Pacific Islands Forum Secretariat, The Forum Principles: Tuvalu, available at: http://www.forumsec.org/resources/
uploads/attachments/documents/PIFS_Good_Leadership_Report_Tuvalu.pdf.
51 Ibid.
52 World Bank Group. 2016. Systematic country diagnostic for eight small Pacific Island Countries: Priorities for ending
poverty and boosting shared responsibility, p. 14.
53 UNDP. 2014. State of Human Development in the Pacific: A report on vulnerability and exclusion at a time of rapid
change.
54 Government of Tuvalu, Millennium Development Progress Report 2010/11, p. 19.
55 Ibid.You can also read