MOROCCO Skills Development for Employment The Role of Technical and Vocational Education and Training
←
→
Page content transcription
If your browser does not render page correctly, please read the page content below
Public Disclosure Authorized   Public Disclosure Authorized                        Public Disclosure Authorized   Public Disclosure Authorized

May 2020
                                                                                                MOROCCO

                                                  Education and Training
                                                                                   Skills Development for Employment

                                            The Role of Technical and Vocational
TABLE OF CONTENT
EXECUTIVE SUMMARY ............................................................................................................................ 1
INTRODUCTION ....................................................................................................................................... 3
I REGIONAL AND COUNTRY CONTEXT ................................................................................................. 5
   1.1   Exploiting the opportunities of a youthful population ........................................................... 9
   1.2   Why focus on TVET skills? ..................................................................................................... 14
II GENERAL EDUCATION AND TVET SYSTEM IN MOROCCO................................................................ 17
   2.1   Recent improvements and challenges in education ............................................................. 17
   2.2   Structure of Morocco’s education system ............................................................................ 21
   2.3   Government’s strategy for TVET ........................................................................................... 22
   2.4   Initial TVET tracks and program modalities .......................................................................... 23
   2.5   TVET system in numbers ....................................................................................................... 26
III DESIGN FEATURES AND IMPLEMENTATION CHALLENGES .............................................................. 29
   3.1   Fragmentated TVET governance structures ......................................................................... 29
   3.2   Main TVET provider: OFPPT .................................................................................................. 32
   3.3   Public versus private TVET provision .................................................................................... 32
   3.4   Regionalization of TVET ........................................................................................................ 35
   3.5   Financing of TVET .................................................................................................................. 37
   3.6   Relevance of TVET programs ................................................................................................ 39
   3.7   Role of social partners .......................................................................................................... 40
   3.8   Summary: Key issues facing TVET Institutions in Morocco................................................... 42
IV RECOMMENDATIONS AND AREAS FOR DISCUSSION ...................................................................... 44
   A. Direct recommendations .......................................................................................................... 45
   B. Areas for discussion .................................................................................................................. 47
V CONCLUSIONS .................................................................................................................................. 55
REFERENCES ............................................................................................. Error! Bookmark not defined.
ANNEX 1: OPERATING IGDS IN MOROCCO ........................................................................................... 62
ANNEX 2: EMPLOYMENT PROMOTION PROGRAMS IN MOROCCO ..................................................... 63
LIST OF TABLES

Table 1. Levels of the TVET system ....................................................................................................... 24
Table 2. Specializations under the Baccalauréat Technique................................................................. 25
Table 3. Women’s enrollment in initial TVET per diploma courses in 2017/2018 ............................... 27
Table 4. Enrollment by type of training ................................................................................................ 27
Table 5. Graduates by type of training ................................................................................................. 28
Table 6. TVET enrollment by level ........................................................................................................ 28
Table 7. Graduates by level of training ................................................................................................. 28
Table 8. Number of graduates by level and region............................................................................... 29
Table 9. Departments/agencies providing TVET in Morocco ............................................................... 30
Table 10. Enrollment by ownership of TVET institutions (2017) .......................................................... 33
Table 11. Graduates by ownership of TVET institutions (2017) ........................................................... 34

                                                                   LIST OF BOXES

Box 1. Morocco’s HCI 2018 ................................................................................................................... 19
Box 2. Levels in the Moroccan TVET system ......................................................................................... 25
Box 3. The emergence of alternative credentials ................................................................................. 49
Box 4. The National Skills Development Corporation ........................................................................... 52
Box 5. National Agency for Employment and Skills Promotion ............................................................ 54

                                                                 LIST OF FIGURES

Figure 1. Economic growth rates in select MENA countries ................................................................... 5
Figure 2. GDP growth in Morocco and MENA......................................................................................... 5
Figure 3. Structural transformation in the Moroccan Economy ............................................................. 6
Figure 4. Unemployment and youth unemployment rate in world regions........................................... 7
Figure 5. Youth unemployment rates in MENA, by country ................................................................... 7
Figure 6. Performance by gender in recent international assessments ................................................. 8
Figure 7. Regional labor force participation rates by gender ................................................................. 9
Figure 8. Unemployment, youth unemployment, and real GDP growth (%) ....................................... 10
Figure 9. Unemployment by education level in Morocco .................................................................... 11
Figure 10. Unemployment by education level and gender in Morocco ............................................... 12
Figure 11. Number of students enrolled in TVET 2000–2018 ............................................................... 14
Figure 12. TVET acceptance rate, 2016–2017....................................................................................... 14
Figure 13. Enrollment by age ................................................................................................................ 14
Figure 14. Total population of 15-year-olds enrolled in grade 7 or above, international comparison 15
Figure 15. Labor market absorption rate of graduates after nine months by level of training 2012–
2015 ...................................................................................................................................................... 16
Figure 16. Employment status for age group
Figure 25. Annual budgetary allocations to the DFP and OFPPT .......................................................... 37 Figure 26. Employer satisfaction level by TVET graduate skills ............................................................ 40 Figure 27. Strengthening the Private Sector’s Role in TVET ................................................................. 51 Figure 28. NSDC-funded affiliation ....................................................................................................... 52
ABBREVIATION AND ACRONYMS

ANAPEC      National Agency for Employment and Skills Promotion (L'Agence Nationale de
            Promotion de l'Emploi et des Compétences)
ATS         Specialized Technician Assistant (Adjoint Technique Specialisé)
BTS         the Higher Technician Certificate (Brevet de Technicien Supérieur)
CAP         Certificate of Professional Aptitude (Certificat d’Aptitudes Professionnelles)
CBA         Competency-based Approach
CFA-IE      Training Center by Inter-Enterprise Apprenticeship (Centre de formation par
            apprentissage inter-entreprise)
CGE         Conseil de gestion de l'établissement
CGEM        General Confederation of Moroccan Enterprises (Confédération Générale des
            Entreprises du Maroc)
CMC         Cités des Métiers et des Compétences (City of Trades and Skills)
CNC         National Framework for Certification (Cadre National de Certification)
CNSS        National Social Security Fund (Caisse nationale de sécurité sociale)
CSEFRS      Higher Council for Education Training and Scientific Research (Conseil Supérieur
            de l’Éducation de la Formation et de la Recherche Scientifique)
CSF         Special Training Contract (Système des Contrat Spéciaux de Formation)
DFP         Secretary General of Vocational Training (Département de la Formation
            Professionnelle)
DIA         Diploma in Applied Engineering (Diplôme d’Ingénieur d’Application)
DSP         Diplôme de Specialisation Professionnelle
DT          Diplôme de Technicien
DTS         Diplôme de Technicien Spécialisé
DQP         Diplôme de Qualification Professionnelle
ECI         Economic Complexity Index
ETF         European Training Foundation
FMEP        Moroccan Federation of Private Professional Education (Fédération Marocaine de
            l'Enseignement Professionnel Privé)
GDP         Gross Domestic Product
GIAC        Advisory Support for Interprofessional Groups (Groupements Interprofessionnels
            d’Aide au Conseil)
GoM         Government of Morocco
HCI         Human Capital Index (Indice du capital Humain)
HCP         High Commission for Planning (Haut-Commissariat au Plan)
IAP         Industrial Acceleration Program
IGD         Delegated Management Institutes (Institutes à Gestion Déléguée)
INE         National Evaluation Body (Instance Nationale d’Evaluation)
MENA        Middle East and North Africa
MNEFPESRS   Ministry of National Education, Vocational Training, Higher Education and
            Scientific Research (Ministère de l’Education Nationale, de la Formation
            Professionnelle, de l’Enseignement Supérieur et de la Recherche Scientifique)
MSME        Micro, Small and Medium Enterprise
NEET        Not in Employment, Education or Training
NGO         Nongovernmental Organization
NQF         National Qualification Framework (Cadre National Marocain de Qualification)
NSDC        National Skills Development Corporation
OFPPT       Vocational Training and Occupational Promotion Bureau (Office de le Formation
            Professionnelle et de la Promotion du Travail
PISA        Programme for International Student Assessment
PNEA        Programme National d'Evaluation des Acquis
PPP Public-Private Partnership
REC Répertoire des Emplois Compétence
REM Répertoire Emplois Métiers
RUT Rol Unico Tributarios
SEFP State Secretariat for Vocational Training (Secrétariat d’Etat chargé de la
Formation Professionnelle)
SMEs Small and Medium Enterprises
TESDA Technical Education and Skills Development Authority
TFP Vocational Training Tax or Levy (Taxe de la Formation Professionnelle)
TVET Technical and Vocational Education and TrainingEXECUTIVE SUMMARY
Morocco has experienced a rapid expansion in the supply of education services over the last two
decades resulting in impressive improvements in access to education, enrolment, and attainment.
Between 2000 and 2016, the gross enrolment rate in primary education increased from 85 to 98
percent, in lower secondary education from 60 to 88 percent, and in upper secondary education from
37 to 66 percent. The Government of Morocco (GoM) allocates about 30.4 percent of its total budget
and 6.4 percent of gross domestic product (GDP) to education. This is higher than the Middle East and
North Africa (MENA) average at 17 percent of budget allocation and 5 percent of GDP.
The two key challenges of Morocco’s education system are low learning outcomes and the large share
of 15- to 24-year-olds not in employment, education or training (NEET). Although the education sector
has expanded over the past two decades, this has not resulted in improvements in learning, illustrated
by weak results in national and international student learning assessments (TIMSS 2015, PISA 2019,
etc.). Recent PISA results show that the performance of 15-year-old students in Morocco is
significantly below the participating MENA countries average and represents nearly four years of lost
schooling1 compared to the Organisation for Economic Co-operation and Development (OECD)
country average. At the same time, 30 percent of 15-year-olds in Morocco are not enrolled in any type
of education or training. At the lower secondary education level, there is a 38-point difference in the
net enrollment rate between rural and urban areas (37 versus 75 percent in 2017). Furthermore, 28
percent of 15- to 24-year olds are considered to be NEET, and youth unemployment is three times
higher than employment for the overall working-age population.
Within this context, technical and vocational education and training (TVET) has emerged as an option
that could integrate students more quickly into the workforce. The number of students enrolled in
TVET in Morocco has almost tripled from 136,132 in 2000 to 462,700 in 2017. Nevertheless, in 2015,
TVET’s share of the total enrolment at the upper secondary level was only 13.5 percent. The GoM
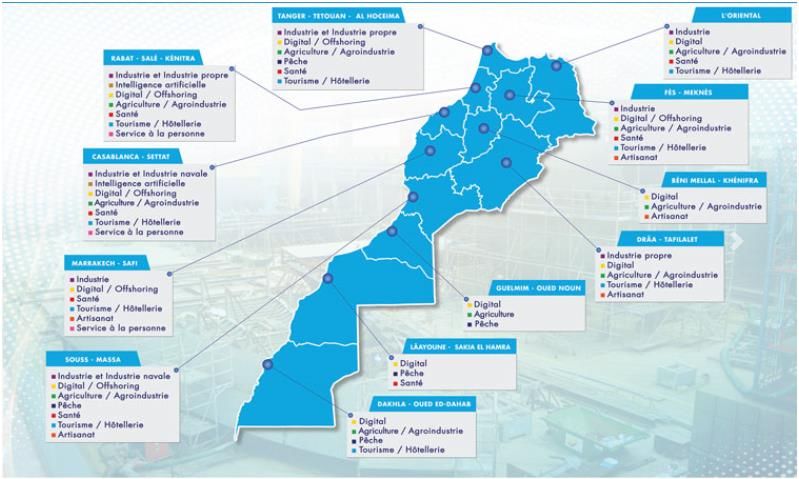
plans to further expand TVET opportunities for the youth. The National TVET Strategy aims to intensify
the cooperation between TVET institutions and employers to determine the skills needed in different
geographical areas of the country. The National TVET Strategy also includes the creation of 12 new
regional TVET centers to helpl coordinate TVET activities, build collaboration with the private sector,
help manage specific regional programs, and evaluate the effectiveness of these measures.
This note (a) presents an overview of Morocco’s TVET system in the context of the larger Moroccan
education system, (b) maps the policies and institutions involved in the delivery of TVET, and (c)
assesses the design features and implementation challenges that constrain the effective delivery of
TVET. The note is based on interviews with clients and stakeholders—including Vocational Training
and Occupational Promotion Bureau (Office de la Formation Professionnelle et de la Promotion du
Travail, OFPPT), the main provider of TVET in Morocco, and TVET centers—and a review of secondary
reports and materials. The note also seeks to identify a few areas where reform efforts could help
improve the effectiveness and efficiency of TVET.
The report also identifies a number of areas for further improvements, including (a) expanding the
application of competency-based approaches (CBAs) to training, (b) ensuring monitoring and
evaluation for evidenced-based decision-making, (c) strengthening the quality framework for TVET,
(d) enhancing the role for the private sector, and (e) adopting an ‘all of government’ approach to
address these key concerns by involving all critical stakeholders in the process of delivering training.
1 30 points in PISA scale ≈ 1 year of schooling.
1Since this note was finalized, an unprecedented crisis has substantially disrupted education at all
levels. To prevent the spread of COVID-19, educational institutions at all levels in Morocco were closed
on March 16, 2020, until further notice. While general K-12 schools remain closed till September 2020,
decision regarding colleges and universities are still being taken. The Ministry of Education declared
that educational continuity should be maintained through distance education/learning and has taken
measures to facilitate continuing education service delivery. However, the degree to which learning
can still take place outside the classroom, including in TVET, is often limited by lack of access to
electricity, internet connectivity, digital devices, and learning platforms or the inadequate preparation
of teachers and students for remote education (Hoftijzer et al. 2020). First simulations on the impact
of school closures on learning reveal that learning-adjusted years of schooling are expected to
decrease on average by 0.4 years of schooling and the average annual earning per student is expected
to decrease by 3.4 percent (Azevedo et al. 2020).
In TVET, with its focus on practical skills and improving work readiness, remote learning is particularly
challenging. Since practical skills are often acquired through learning-by-doing approach and rely on
specific equipment and laboratories, distance learning is particularly challenging. How are TVET
programs and students doing during the COVID-19 crisis? How are countries planning to adapt TVET
to what comes next? The World Bank has joined forces with the ILO and UNESCO to collect this
information from TVET providers, policy makers, and social partners (Hoftijzer et al. 2020). Survey
results were not yet available at the completion of this report.
2INTRODUCTION
1. The GoM’s overriding concerns are steady economic growth, structural transformation
toward economic competitiveness, job creation, and youth2 unemployment. These issues have
compelled the government to obtain a better understanding of its policies in the area of education
and skills development and to make changes to improve service delivery through strategies such as
adopting school-based management (De Grauwe 2005), decentralizing government structures,
strengthening financial flows, and improving the efficiency in using these resources to achieve desired
outcomes (IMF 2017).
2. Morocco plans to develop a more coordinated and integrated structure for education,
training, skills development, employment, labor laws, and social protection programs. For Morocco to
be competitive in all areas of the economy, individuals must be able to access knowledge flows and
develop the necessary skills needed to spur the economy and understand their role in a globalized
world. The country is keenly aware that low quality of education in general terms translates into a
low- or poorly skilled labor force. According to the 2018 Investment Climate Statement, “despite the
significant improvements in business environment, the lack of skilled labor, weak intellectual property
rights protection, inefficient government bureaucracy and the slow pace of regulatory reform remain
challenges for Morocco.” While many Moroccan graduates are unable to find jobs commensurate with
their educational training, employers complain of skills shortages and mismatches. Industrial skills that
could benefit the needs of growing sectors are not prioritized, and skills that graduates acquire are
often not transferrable to any real-world working environment, causing gaps between skills supply
and demand (US Department of State 2018).
3. In Morocco, as in many other countries, the TVET system at times has struggled to sync well
with both ends of the education spectrum—the schooling system on the lower end and the higher
education system. In most countries, the reason for this difficulty often lies in the fact that the
jurisdiction over these different systems is spread across several different ministries. Morocco has
taken a bold step in integrating the responsibilities for the supply side of skills development under one
roof of the Ministry of National Education, Vocational Training, Higher Education and Scientific
Research (Ministère de l’Education Nationale, de la Formation Professionnelle, de l’Enseignement
Supérieur et de la Recherche Scientifique [MNEFPESRS]). While this has significantly helped improve
coordination on the supply side, challenges still remain. For example, programs are not very flexible
in terms of entry and exit requirements, could be modularized and better articulated with basic
schooling and general higher education, and most importantly, need to have multiple pathways that
cater to students of different needs.
4. TVET has always struggled to garner the same importance as general schooling or higher
education in the minds of both policy makers and key stakeholders—particularly parents and students.
Job-oriented training has typically been considered as the option for those who have not
demonstrated capacity to pursue general higher education or complete general secondary schooling.
This negative perception of the TVET sector has resulted in a situation where TVET is seen as ‘schooling
of last resort’ and not to improve access to the job market. However, this perception is beginning to
change in Morocco. The TVET sector has managed to carve out a critical niche for itself in Morocco by
improving coordination with the private sector, employers, social partners, and so on; by promoting
the critical role played by TVET in Morocco’s economy; and perhaps by illustrating that a large number
of students graduate from tertiary programs with no demonstrable skills constitute a significant share
of the unemployed.
2 Youth is typically defined as individuals between 15 and 24 years of age.
35. The GoM increasingly believes that the TVET sector has an important role to play in helping
address the issues identified earlier. It has significantly increased its attention to this sector by opening
new training institutions in the country. These institutions play a pivotal role in the economic sector
as they straddle the space between education and skills development and the desired labor market
outcomes for these students. Recent years have seen dramatic increases in participation in the TVET
programs in the country. The GoM has vastly improved and expanded communication around TVET
and has managed to give it an aspirational view. Furthermore, the broadening of course offerings and
the changing role and nature of technology in TVET programs have helped revive interest in TVET.
6. Finally, employers are beginning to realize that certificates and degrees do not necessarily
imply skills acquisition. Technology is rapidly changing the landscape for skills certification and there
is a move toward better, nimbler, more easily verifiable, and narrowly defined skills certification,
which might be a better approach to getting the workers that employers need. Over the next two
decades, Morocco too will benefit from these newer approaches to qualifications, such as micro
certification, nanodegrees, and web badges which are revolutionizing the world of education and skills
and are beginning to challenge the orthodoxy of higher education. The TVET sector and the programs
and skills it imparts are particularly well suited to these emerging trends as they are key to these
educational reforms and needed adjustments within the labor market.3
7. This report seeks to present an understanding of the needs of trainees and learners and
expectations of employers in Morocco. Key measures to support effective, efficient, high-quality TVET
programs closely articulated with the needs of the labor market are highlighted as well as the
governance and institutional structures for TVET in Morocco. Improving the performance of the TVET
sector and overall skill levels of graduates emerging from the system could have knock-on effects on
labor market outcomes and the functioning of the overall economy as more and more people are able
to access jobs. This would help Morocco become a more competitive economy in the medium to long
term and play a more active role in MENA, African, and global affairs from a position of strength.
3For example, Pearson’s Acclaim Badges give learners a wide variety of opportunities to acquire skills and share evidence
of their competence in specific areas to prospective employers.
4I REGIONAL AND COUNTRY CONTEXT
8. The young form the largest share of the population in the Arab states. Over half the population
in the region is under the age of 24 and an estimated two-thirds are below 30 years (Amin et al. 2012).
In fact, one undeniable reason behind the ‘Arab Spring’ is that the youth in these countries have been
disproportionately affected by the lack of democratic processes and participation, decades of sluggish
economic growth, and alarmingly low levels of job opportunities and creation in some countries.
Figures 1 and 2 illustrate the sluggishness of economic growth in Morocco and across a select set of
comparator countries. While Morocco performs better than some neighboring or comparator
countries, and although the International Monetary Fund (IMF) had predicted favorable growth
prospects in the medium term (IMF 2019), the real concern for Morocco has been that growth in
recent years has failed to create jobs, leading to high levels of underemployment and unemployment.
The current situation brought about by the COVID-19 crisis lays bare the enormous policy challenges
and deficits facing Morocco and the region more broadly.
Figure 1. Economic growth rates in select MENA countries
Figure 2. GDP growth in Morocco and MENA
9. The Moroccan economy has also exhibited a slow structural transformation process, which
will be needed for the country to achieve higher growth. Global evidence illustrates that for strong
economic performance, what matters is not how much of a product is exported but what the product
5itself is (World Bank 2006). Morocco needs to move toward exporting more sophisticated products
compared to its current product mix. Product diversification will require Morocco to enhance its
infrastructure and human capital, improve the country’s competitiveness, and move toward higher
value-added products. While GDP mainly stems from the service sector, employment is mostly found
in the primary sector.
10. The complexity of the Moroccan economy grew steadily over the years between 1970 and
2017. However, Morocco’s rank in terms of its economic complexity has continued to fall relative to
other countries, illustrating that the process of structural transformation of the Moroccan economy
has been relatively slow. It is only in recent years that the structure of Moroccan exports has become
more sophisticated, having spent several decades in producing low-complexity products—knitted
products, textiles, and food processing.4 However, in the most recent phase of transformation, the
country has moved toward some products that require higher technological content. For example, in
recent years Morocco has acquired the reputation of being the largest assembler and exporter of cars
in Africa, overtaking South Africa in the process.5 This was the result of deliberate policy measures
adopted by the government and required a new set of skills to be developed. These plans were
enshrined in Morocco Industrial Acceleration Plan 2014–2020.6
Figure 3. Structural transformation in the Moroccan Economy
(a) (b)
11. High levels of unemployment, particularly youth unemployment, characterize the entire
MENA region. Figure 4 illustrates that MENA has had persistently high youth unemployment rates for
over two decades and is estimated to be 25 percent, which is the highest in the world. The high levels
of youth unemployment also show a level of persistence due to years of tepid economic and job
growth (HCP 2018).
4 This was referred to Phase II of the process of industrialization for Morocco where the focus was on low complexity,
export-oriented, and labor-absorbing sectors such as textiles and food processing. Knitted products, such as carpets, have
been the mainstay of the Moroccan economy for years and continues to be so though their contribution to the overall
economy has declined over the years.
5 Please refer to https://www.moroccoworldnews.com/2018/05/246127/morocco-surpasses-south-africas-car-
production/.
6 Please refer to http://www.mcinet.gov.ma/en/content/industrial-acceleration-plan-2014-2020.
6Figure 4. Unemployment and youth unemployment rate in world regions
Source: Ramos 2017.
Figure 5. Youth unemployment rates in MENA, by country
Source: Kabbani 2019.
12. High levels of youth unemployment have many implications, for example, the youth spend
years searching for the right jobs before they can find opportunities. Amin et al. (2012) note that “…in
the mid-1970s, 80 percent of first-time job seekers found employment in a formal wage or salary job;
by the mid-2000s, only 30 percent did.” The youth, individuals, and families have had to deal with this
enormous change in just one generation. Delays in finding a job or transitioning from school to work
also has other (negative) knock-on effects. It results in transitioning more slowly to other important
aspects of adulthood, such as marriage and household formation. Regional governments have placed
high priority on addressing this issue of high youth unemployment, and the urgency to address this
issue is only growing.
713. However, the MENA region is not a monolithic set of countries, and it would be a mistake to
look at the region through a single lens. There is considerable variation across and within MENA
countries.
• Oil exporting countries—for example, Qatar, Saudi Arabia, and the United Arab Emirates (or
more generally, the Gulf Cooperation Council countries)—have created more jobs than can
be effectively met by local labor supply. They have addressed this gap for decades by having
significant inflow of migrant labor from the region and beyond. A key challenge for this set of
countries has been the need to diversify their economy away from oil and petrochemical
industries in general. This too has contributed significantly to their decision to import labor
(and hence the necessary skills) as needed.
• Oil importing countries—for example, Tunisia, Morocco, and the Arab Republic of Egypt—
have struggled to generate domestic jobs over many years and have found it particularly
difficult to meet the growing demands to help their youth transition into work and productive
lives. However, the fact that their economies have not been dependent on oil has allowed
them to organically grow the importance of other sectors of the economy7 and thereby focus
on developing a broader range of skills in the workforce.
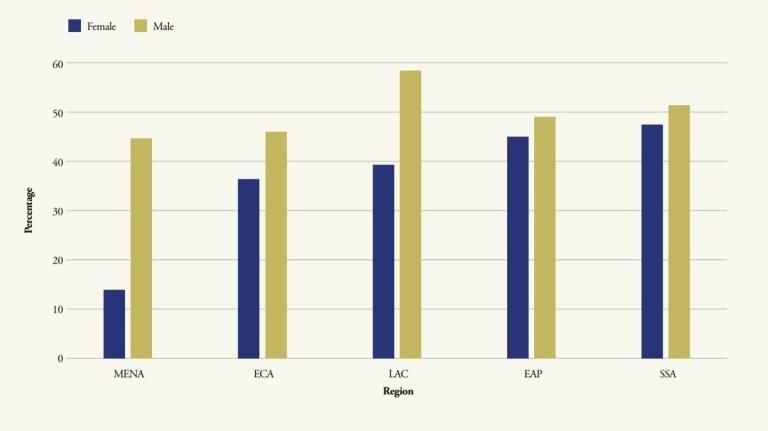
14. One key characteristic of MENA labor markets compared to the rest of the world is that there
is a significant gender dimension to youth unemployment in this region. Women’s labor force
participation rates in the region remain incredibly low, even as young women continuously
outperform young men in the schooling system and having made considerable gains in educational
attainment in recent years. Figure 6 illustrates the performance of girls relative to boys in recent
international assessments and Figure 7 shows the female labor force participation rates by region and
gender.
Figure 6. Performance by gender in recent international assessments
500
480
460
Average Scale Score
440
420
400
380
360
340
320
300
Grade 4
Grade 8
Grade 4
Grade 8
Grade 4
Grade 8
Grade 4
Grade 8
Grade 4
Grade 8
Grade 4
Grade 8
Grade 4
Grade 8
Grade 4
Grade 8
Grade 4
Grade 8
Morocco Saudi Oman Jordan Bahrain Kuwait Iran Qatar UAE
Arabia
Girls Boys
Source: Kabbani 2019.
7 Though economic concentration and complexity still remain a challenge.
8Figure 7. Regional labor force participation rates by gender
Source: Kabbani 2019.
1.1 Exploiting the opportunities of a youthful population
15. The regional characteristics with respect to demographics, unemployment, and youth
unemployment are mirrored in the context of Morocco. The youth share is large and accounts for
about 17 percent of the population.8 Unemployment and youth unemployment rates are very high,
with nearly a tenth of the working-age population of the country, or approximately a million
individuals, being unemployed (World Bank 2018a). Average youth unemployment rates mask
significant intra-country differences, for example, youth unemployment rates are approximately 20
percent nationally, but rise to almost twice the level in select urban areas. The share of NEET is also
high, estimated to be 27.9 percent in 2015 for the 15–24 age group and with men accounting for about
11.4 percent and women for about 45.1 percent9 (ETF 2016a).
16. The impacts of the Arab Spring reverberated and were fully manifested in Morocco. Protests
took place across the country, youth groups emerged on the streets to demand change, fulfil their
democratic aspirations, and improve the set of opportunities available to them. Unlike in Egypt and
Tunisia where similar protests had significant negative impacts, they were less disruptive in Morocco.
A combination of higher levels of transparency, and an existing and ongoing dialogue between the
state and its citizens on a wide range of issues helped Morocco moderate the negative impacts of
these protests and provided multiple avenues for political, constitutional, and social reforms (Sater
2011).
8 Morocco’s total population in 2018 was estimated at 35 million and the working-age population was estimated at 26
million.
9 Approximately 1,685,000 youth between ages 15 and24 based on data from the HCP (OECD 2017).
9Figure 8. Unemployment, youth unemployment, and real GDP growth (%)
45
40
28.2
35 27.4
30 22.8
19.6 19.7 20.0
18.3 18.8
25 17.9 18.2 18.1
20
15
9.7 10.6 9.9
10 9.5 9.0 9.2 8.7 9.5 9.2 9.0
8.5
4.2 3.0 4.5 4.6 4.1
5 2.7 1.2 3.0
5.9 3.8 5.3
0
2008 2009 2010 2011 2012 2013 2014 2015 2016 2017 2018
Unemployment Youth Unemploymment Real GDP Growth
Source: Moroccan Authorities, IMF World Economic Outlook (April 2019).
17. A paradoxical feature of the Moroccan labor market is that returns to education, especially to
higher education, are not particularly high. Unemployment rates do not differ between individuals
having completed a 3 or 4-year License (higher education degree) versus those having completed
merely general secondary education. Da Silva (2017) identifies four possible factors that contribute to
this issue of skilled unemployment in Morocco. These include, among others, (a) oversupply of skilled
labor caused by fairly rapid increase in access to tertiary programs; (b) the degree of openness of the
economy that has a positive impact on the demand for skilled workers; (c) the creation of more and
better jobs, with a greater skills component and employment; and (d) further exacerbation of skilled
unemployment by a skills mismatch created by the supply side with the tertiary system producing a
large number of graduates in sectors that are not as much in demand or marketable. Da Silva (2017)
finds that youth with science, technology, engineering, and mathematics backgrounds are more likely
to be employed after completing a basic degree compared to those who complete a basic degree in
humanities or other similar subjects which have less market appeal.
18. There are other important indicators of how youth in Morocco are constrained in their
participation in the labor market. A study by the World Bank (2012) finds that nearly 88 percent of the
youth work in the informal sector, which is a sizeable part of the Moroccan economy. Othmane and
Mama (2016) estimate the size of the informal economy in Morocco to be 45 percent10 and identify
urbanization, tax burden,11 and corruption as the main causes for the size of the informal economy.
Morocco is urbanizing rapidly. Between 2005 and 2015, Morocco’s urban population grew by about 5
percent per year from about 55.1 percent to about 60.2 percent.12 This rapid increase in urban
populations makes absorption into the labor market difficult for all new migrants and contributes to
the growth of informal sector. However, Morocco also offers an example of an informal sector that
10 See https://www.researchgate.net/publication/306528117_An_Estimation_of_the_Informal_Economy_in_Morocco.
11 The authors find that an increase of 1 percent in the tax burden results in an increase of the informal economy by as
much as 0.11 percent.
12 See https://www.statista.com/statistics/455886/urbanization-in-morocco/.
10has significant economic potential if carefully harnessed. Nearly 70 percent of enterprises in Morocco
work in this informal space. These are typically unregistered establishments with fewer employees.13
As in most countries, informal sector entities tend to have no structured benefits and have limited
access to financing. Although there are clearly some undesirable characteristics in the informal
sector,14 it offers opportunities for poorly qualified or trained young workers with almost half the
youth in the informal sector never having been to school and about 70 percent with no qualification.
Male workers form the largest share of the young workers in the informal sector, though women also
find opportunities that offer less security from termination and are typically poorly paid.
Figure 9. Unemployment by education level in Morocco
25
22.4
20.2 19.8
20 18.9
17.1
Unemployment Rate
15.9
15.1
15
10
7.7
5 3.9
0
Source: Dadush and Saoudi 2019.
13 Simply from the viewpoint of exposition, it has been estimated that if each of these entities could be made to absorb just
one additional employee per year, Morocco would be able to eliminate unemployment and this would benefit semi- and
unskilled workers disproportionately. https://moroccoonthemove.com/2018/01/12/informal-economy-africa-can-make-
sustainable-impact-jean-r-abinader/.
14 Only 11.4 percent of employed youth contribute to social security and only 9.7 percent have health insurance.
11Figure 10. Unemployment by education level and gender in Morocco
60
50
Youth Unemployment
40
30
20
10
0
None Elementary Secondary Higher Secondary Tertiary
Girls Boys
Source: UN ECANA 2013.
19. Informality in the workplace continues to support skills development through informal
apprenticeships. In a country like Morocco, with a large share of people working in the informal sector,
informal apprenticeship programs at home or with a relative are likely to be the main source of skills
development. This reinforces and crystalizes low-level basic skills, leaves individuals with limited
ability for further upskilling since their foundational skills are poor, and limits the prospects for
productivity improvements. Even for those who can make it to formal vocational or TVET programs,
the absence of pathways between TVET and general education results in an unattractive dead end,
which limits future career options for the individual.
20. A World Bank report ‘Labor Market in Morocco: Challenges and Opportunities’ (2017)
identified three key challenges facing the labor market in Morocco: (a) lack of inclusion, (b) slow job
growth, and (c) poor quality of jobs. Specifically, the report15 stated the following:
• Lack of inclusion: Youth and women are less integrated into the labor market. Female labor
force participation is particularly low (23%). Youth participation has declined as the share of
youth staying in school has more than doubled.
• Slow job growth: Job creation has not been sufficient to absorb the inflow of working-age
population. Formal employment is concentrated in older and larger firms while small and
medium enterprises face numerous constraints to operate and expand.
• Low quality of jobs: Informality dominates the labor market. The growth of nonagricultural
employment is slow and employment in the services sector is concentrated in low-skilled
services. Productivity is low, and workers lack sufficient mechanisms for protection and social
dialogues.
21. The report notes that formal employment is concentrated in older and larger firms and that
newer smaller and medium enterprises (SMEs) have not traditionally played a major role in creating
15The three points have been copied verbatim from an article noting the publication of the report. This can be found at
https://www.worldbank.org/en/country/morocco/publication/labor-market-in-morocco-challenges-and-opportunities
12formal sector jobs in Morocco.16 However, recent results from a World Bank-financed project between
2012 and 2017, the Moroccan Micro, Small and Medium Enterprise (MSME) Development Project,
provides some contradictory evidence. The Implementation Completion and Results Report for this
project notes that “MSMEs are the job creators in Morocco.”17 This leads to the concern over quality
of jobs as most of the jobs are created in the informal sector.
22. Job creation and the skills needed to sustain such creation are closely linked to the
government’s industrial policy. Morocco has gone through several distinct phases in terms of its
industrial policy and this can be classified into three distinct phases: (a) Phase I: 1960–1980, (b) Phase
II: 1980–2005, and (c) Phase III: since 2005. The first phase focused on a period of self-reliance, with
an emphasis on establishing a production base and on import substitution policies.18 Although this
phase supported a base for industrial production, it did not achieve the goals envisioned at the start.
The second phase was characterized by a move from self-reliance to export growths, and this allowed
Morocco to move toward sectors that needed labor and helped absorb workers. While this allowed
progress in the textiles sector and food sector, it did not translate to a comprehensive industrialization
in many sectors. The final phase is characterized by a more structured move to support
industrialization (el Mokri 2016).
23. Such policies have direct implications for the skills mix needs in the country. For example, the
Industrial Acceleration Program (IAP)19 (2014–2020) has focused on eliminating three constraints of
the Moroccan economy: (a) access to finance for the development of the industrial economy; (b)
access to critical inputs, such as land, and other integrated platforms; and (c) building up of the human
resource capacity of the country to support key sectors. The IAP placed emphasis on a select number
of sectors: automotive, aerospace, textile and leather, chemical and parachemical, heavy goods
vehicles and bodywork, construction materials, and the pharmaceutical industry.20
24. Growth in each of these sectors places an increasing demand for skills and the portfolio mix
will generate differential demands for skills across sectors. However, by using the Economic
Complexity Index (ECI) approach, policy makers can begin to think about the ‘capacity gap’ which
shows the gap between the productive capacity of the country and the productive capacity needed to
develop a new product. The ECI helps reveal the set of productive and human capital abilities available
in a country through a glimpse of the complexity or sophistication of its exports and the diversified
nature of its export structures. The ECI of Morocco has steadily declined over the years and in 2017
stood at 99 out of 129 countries on the list.
16 There is an ongoing debate on whether or not small businesses are the most important generators of jobs and indeed
form the backbone of a nation’s economy. In the context of Morocco, given the high degree of informality and the
extremely small size of the formal sector, this may indeed be true. Refer to https://thereader.mitpress.mit.edu/small-
business-job-creation-myth/ for more on the measurement issues associated with such an analysis.
17 World Bank. 2018. “Implementation Completion and Results Report (Loan No. 8182-Ma)” on a loan in the amount of EUR
37.9 million (US$50 million equivalent) to the Kingdom of Morocco for the MSME Development Project (P129326) June 7,
2018. http://documents.worldbank.org/curated/en/855841539102439892/pdf/ICR4419-PUBLIC-Morocco-
ICR.pdf
18 Such policies were common during that period across numerous countries with some of the major economies in the
world today—China, India, the Republic of Korea, and so on focusing on self-dependence and becoming self-reliant to the
extent possible.
19 IAP.
20 The demand in skills is partly driven by growth in these sectors while also being subject to the demands of the service
and primary sectors of the economy. For example, tourism and the related hospitality sector generated about MAD 70
billion in 2017, even though the total GDP growth was a bit more sluggish. Another area for potential growth is in the gig
economy in Morocco. While in most advanced economies, the size of the gig economy ranges between 1 and 4 percent of
the economy, the size of the economy was larger in the context of developing countries. The higher share of gig economy
worker in the context of developing countries is not surprising given the high levels of labor market informality.
131.2 Why focus on TVET skills?
25. Within this context, TVET has emerged as an option that may offer quicker student integration
into the workforce and more directly meets the needs of the labor market. Enrollment in TVET has
significantly increased in Morocco since 2000. The number of enrolled students tripled since 2000 and
doubled since 2008. TVET students currently represented only 13.5 percent of enrolled students at
upper secondary education level, but demand is increasing. There are more students demanding
access to TVET than can currently be absorbed by the TVET providers.
Figure 11. Number of students enrolled in TVET Figure 12. TVET acceptance rate, 2016–2017
2000–2018
500000 100 96
450000 90
400000 80
350000 70
300000 60
250000 50 44 42 41
200000 40
150000 30
100000 20
50000 10
0 0
SpécilisationQualification Technicien Technicien
Spécialisé
26. Enrollment significantly drops at ages 13–14, when students in Morocco complete lower
secondary education. Overall, the transition from lower secondary education to upper secondary
education, or TVET, is challenging in Morocco. Transitioning from lower secondary education to
general upper education is generally more challenging than transitioning to TVET education, as the
entry requirements are often lower at that level. Therefore, TVET can also be a catalyzer to increase
enrollment in education, beyond lower secondary education.
Figure 13. Enrollment by age
100
96 97 97 96 94
90 92 91
85
80 77
70 69
66
60 62
50 53
45 47
40 39
31.44 34.34
30
20
14.79
10
0
3 4 5 6 7 8 9 10 11 12 13 14 15 16 17 18 19 20 21
Age
Source: Morocco Population and Housing Census 2014 - Recensement General de la Population et de l'Habitat de 2014 (RGPH
2014).
Note: These data are also available by gender and by province.
1427. PISA data reveal that only about 30 percent of 15-year-olds are not enrolled in education,
which is the third lowest enrollment rate of all countries participating in PISA. Also, at lower secondary
education level, there is a 38 point difference in the net enrollment rate between rural and urban
areas (37 versus 75 percent in 2017). There is no comprehensive analysis explaining the factors behind
early school leaving in Morocco, and students who leave school early often experience interrelated
economic, schooling, and home environment challenges.21 Some of these factors are endogenous to
the education system, such as the perceived relevance of the curricula, teacher behavior and limited
student support, or hostility within the school environment. Others, such as poverty and inequality,
are exogenous to the education system, yet can still affect an individual’s ability to benefit from his or
her schooling experience. These factors are not mutually exclusive and, in fact, closely influence one
another.
Figure 14. Total population of 15-year-olds enrolled in grade 7 or above, international comparison
1
0.9
0.8
0.7
0.6
0.5
0.4
0.3
0.2
0.1
0
Costa Rica
Malaysia
Albania
Philippines
Turkey
Chile
Georgia
B-S-J-Z (China)
Morocco
Colombia
Mexico
Indonesia
Romania
Thailand
Italy
Ukraine
Jordan
Croatia
Bulgaria
Panama
Peru
Macao (China)
Kosovo
Dominican Republic
Uruguay
Baku (Azerbaijan)
Source: PISA 2018; ANNEX A PISA 2018 Technical Background, Table I.A2.2. 25 Countries are sorted by enrollment level.
28. When analyzing employment returns to TVET, one challenge is that the education track
individuals choose to follow is endogenous.22 Hence, differences in employment patterns may be the
result of selection into these tracks. Also, while vocational education may facilitate the transition from
school to work, especially for students who are less academically inclined, it also entails the risk that
the demand for the student’s specific skill may decrease due to changes in the labor market in the
long term (Golsteyn and Stenber 2017; Hanushek et al. 2017). In other words, the skills generated by
vocational education may facilitate the transition into the labor market but may become obsolete at
a faster rate. Because of the lack of time series information and the nonrandom selection of the
general and technical tracks, there are few studies that have conducted rigorous evaluations of the
effectiveness of TVET versus general secondary education tracks.23
29. Overall, in the context of Morocco, unemployment among TVET graduates remains high. The
High Commission for Planning (Haut-Commissariat au Plan [HCP]) recently presented a report on the
employability and employment of different categories of entrants to the labor market (HCP 2018). The
report found that for TVET higher levels of education correspond with lower likelihood of
21 For a detailed overview of factors, see Almeida, Fitzsimons, and Rogers (2015).
22 Individuals choose their academic path based on a number of idiosyncratic characteristics which are not observable to
the analyst and therefore analysis of this nature has to address the issue of selection into a particular course of study.
23 For more information on evaluations of this nature, refer to Moenjak and Worswick (2003), Malamud and Pop-Eleches
(2010), Hanushek, Woessmann, and Zhang (2011), Goldsteyn and Stenberg (2017), and Woessmann (2018).
15employment. The unemployment rate was 21 percent for initial professional vocational training
graduates, 26 percent for those with ‘specialization’ diploma, 29 percent for those with ‘qualification’
diploma, and 27 percent for ‘specialized technician’. The HCP also observed that for young people
with secondary education, only 22 percent were unemployed, for graduates with a master’s degree
15.9 percent were looking for a job, for those with a Licence (degree equivalent to three years of
tertiary education) 19 percent, for engineers 7.7 percent, and for medical graduates 4 percent (HCP
2018). Higher education graduates, however, represented only 20 percent of unemployed workers
ages 15–34, while one-third of the unemployed population had no education beyond secondary
school. OFPPT—the leading public TVET provider—estimates that 70 percent of the graduates have
found employment within one year of graduation.24 Most laureates are employed (self-employed) in
the private sector.
Figure 15. Labor market absorption rate of graduates after nine months by level of training 2012–2015
80
70
60
50
40
30
20
10
0
Certificate of Specialization Qualification Technician Specialized National
Professional Technician
Aptitude
2012 2013 2014 2015
Source: CSEFRS 2019.
30. However, when comparing students with a TVET degree to students who have merely
completed lower secondary education, employment benefits can be observed. Students having
completed any type of TVET have a higher employment rate compared to students who have merely
completed lower secondary education (general track). Therefore, the returns to TVET education are
positive compared to not continuing education at all beyond lower secondary education.
24 Statement by OFPPT representative during an interview in June 2018.
16Figure 16. Employment status for age group
harmonized test scores (as a measure of quality or achievement). The HCI finds that a child who enters
school at the age of 4 in Morocco can expect to complete about 10.6 years of school by the 18th
birthday (as described in Box 1). In terms of harmonized test scores, the HCI analysis illustrates that
Moroccan children score 367 on a scale where a score of 300 represents minimum attainment and
625 represents advanced attainment. These harmonized scores illustrate that Moroccan girls
outperform boys with the girls scoring 376 compared with boys scoring 35926. The HCI reveals that
although the expected years of schooling is on average 10.6 years in Morocco, adjusted for learning,
the effective years of schooling or the quality adjusted years of schooling is about 6.2 years. Therefore,
Moroccan children are effectively losing 4.4 years of schooling during their schooling lifetime.27 The
HCI reveals that a child born today in Morocco will only be 50 percent as productive when s/he grows
up, as s/he could be if s/he had the full complement of education and health benefits.28

35.      The Trends in International Mathematics and Science Study for grade 8 mathematics and
science is illustrated in Figures 18a and 18b. The figures clearly illustrate that of all participating
countries, the MENA region is clustered toward the lower end of the score distribution. Morocco finds
itself even at the bottom of the MENA cluster. While Morocco has done well in terms of improving
overall access to schooling, there is a clear learning deficit in Morocco and this needs to be addressed
urgently to support the country’s developmental aspirations.

26
   World Bank (2018). Morocco HCI. https://databank.worldbank.org/data/download/hci/HCI_2pager_MAR.pdf
27 Stochastic frontier analysis of the relationship between the HCI’s harmonized test score and average per student
spending per year, computed over G1 to G9 in over 93 countries, suggests that given Morocco’s level of spending, the
country’s theoretical maximum student achievement is 470. However, Morocco achieved only 367 points on the HCI’s
harmonized test score.
28 A full description of the HCI for Morocco can be found in

https://databank.worldbank.org/data/download/hci/HCI_2pager_MAR.pdf.

                                                           18
Box 1. Morocco’s HCI 2018
Figure 17. Human Capital Index The HCI measures the amount of human capital that
a child born today can expect to attain by age 18.
The indicator illustrates the expected productivity of
the next generation of workers compared to a
benchmark where people get a full complement of
education and health interventions. Five indicators
help define the HCI: (a) the probability of survival to
age 5, (b) a child’s expected years of schooling, (c)
harmonized test scores as a measure of quality of
learning, (d) adult survival rate (fraction of 15-year-
olds that will survive to age 60), and (e) the
proportion of children who are not stunted. A child
born in Morocco today will be 50 percent as
productive when s/he grows up as s/he could be if
s/he enjoyed a full complement of education and
health interventions. The third and fourth lines of
Figure 17 illustrate that a child born in Morocco
today can expect to be in school on average for
about 10.6 years and that Moroccan students score
367 on a scale where 300 represents minimum
attainment and 625 represents advanced
attainment. Even though children can be expected
to be in school for over 10 years, evidence also
illustrates that about a third of Moroccan 15-year-
olds are not in school.
19Figure 18. Grade 8 Math and Science Scores TIMSS
(a) Mathematics for grades 8: averages (b) Science for grades 8: averages
Singapore1 Singapore1
Korea, Rep. of Japan
Chinese Taipei-CHN Chinese Taipei-CHN
Hong Kong-CHN Korea, Rep. of
Japan Slovenia
Hong Kong-CHN
Russian Federation
Russian Federation
Kazakhstan
England-GBR
Canada2, 3
Kazakhstan
Ireland
Ireland
England-GBR
United States2
United States3
Hungary
Slovenia
Canada2, 3
Hungary
Sweden
Norway (9)4
Lithuania1
Israel5
New Zealand2
Lithuania1
Australia
Australia
Norway (9)4
Sweden
Israel5
TIMSS scale…
TIMSS scale…
Malta
Italy1
Italy1
Turkey
New Zealand3
Malta
Malaysia
United Arab Emirates
United Arab Emirates
Malaysia
Turkey
Bahrain
Bahrain Qatar
Georgia1, 2 Iran, Islamic Rep. of
Lebanon Thailand
Qatar6 Oman
Iran, Islamic Rep. of6 Chile
Thailand Georgia1, 3
Chile6 Jordan
Oman6 Kuwait
Egypt6 Lebanon
Kuwait6 Saudi Arabia
Jordan7 Morocco
Morocco Egypt
Saudi Arabia
0 200 400 600
0 200 400 600 800
Source: National Center for Education Statistics 2015.
20You can also read