NZ Search and Rescue Environmental Scan - 2020 update - NZSAR
←
→
Page content transcription
If your browser does not render page correctly, please read the page content below
NZ Search and Rescue
 Environmental Scan

      2020 update

                       1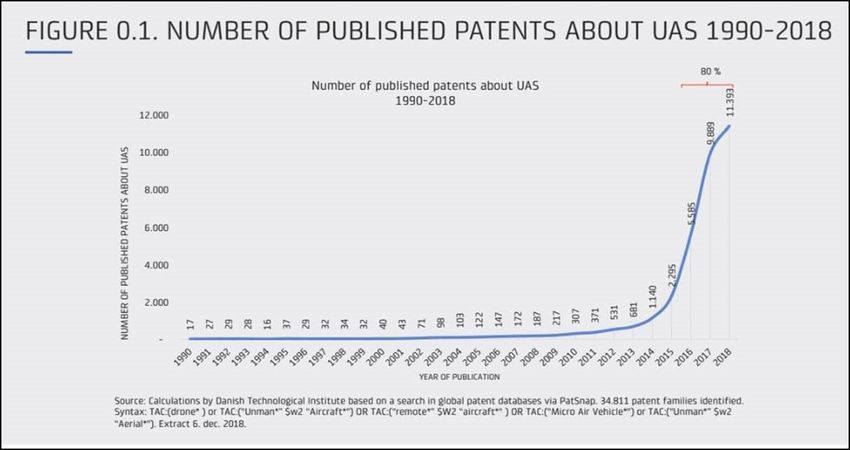
Table of Contents
 1.   Executive summary............................................................................................................ 3
 2.   Demand trends update ...................................................................................................... 7
 3.   Demography update .......................................................................................................... 9
      3.1        The population is still growing ................................................................................................... 9
      3.2        We are still ageing (though there are still plenty of young people too) .................................. 10
      3.3        Women are outliving men ....................................................................................................... 11
      3.4        The prevalence of dementia is increasing ............................................................................... 11
      3.5        Disability generally is also increasing ....................................................................................... 13
      3.6        We are becoming still more diverse ........................................................................................ 14
 4.   Economy update .............................................................................................................. 18
      4.1        Overall, the economy is still growing, and unemployment declining ...................................... 18
      4.2        Urbanisation, due to economic realities, is still hollowing out rural NZ .................................. 21
      4.3        Tourism, particularly outdoors, remains lucrative for New Zealand ....................................... 23
      4.4        The marine economy is also still growing ................................................................................ 24
 5.   Social trends update ........................................................................................................ 25
      5.1        New Zealanders feel busier than in the past ........................................................................... 25
      5.2        We’re spending more time on the couch ................................................................................ 26
      5.3        We are beginning to understand that safety when outdoors matters .................................... 27
 6.   Technology update .......................................................................................................... 30
      6.1        “Always on” technology may still be giving a false sense of security ...................................... 30
      6.2        Implications of the explosion of electric-assisted transport options ....................................... 31
      6.3        Accelerating computing power continues, unlocking new future capabilities ........................ 33
 7.   Environment / climate update ......................................................................................... 36
      7.1        Climate change is accelerating................................................................................................. 36
 8.   Close up on volunteering ................................................................................................. 38
      8.1        Demographic changes and volunteering ................................................................................. 38
      8.2        The SAR sector still relies heavily on white, middle-aged men as volunteers ......................... 38
      8.3        In reality, NZ is not about to run out of white, middle-aged men ........................................... 39
      8.4        But the SAR sector needs to diversity its volunteer base anyway ........................................... 40
      8.5        How to attract a more diverse voluntary workforce ............................................................... 43
      8.6        Steps in the right direction ...................................................................................................... 46
      8.7        Economic and social changes: impacts on volunteering.......................................................... 46
      8.8        Urbanisation may challenge the current recruitment model .................................................. 46
      8.9        Changing economic realities and social attitudes .................................................................... 47
      8.10       Why the reluctance to commit? .............................................................................................. 48
      8.11       Glimmers of hope .................................................................................................................... 49
      8.12       How might the SAR sector respond to these changing social trends? .................................... 50
      8.13       Understanding and influencing potential volunteers .............................................................. 50
      8.14       Exponential changes and volunteering .................................................................................... 53
      8.15       Converging trends are driving increased uncertainty .............................................................. 56
 9.   Bibliography .................................................................................................................... 57
 10. Appendix – Comparing the 2017 environmental scan and 2020 update ........................... 63

                                                                                                                                                      2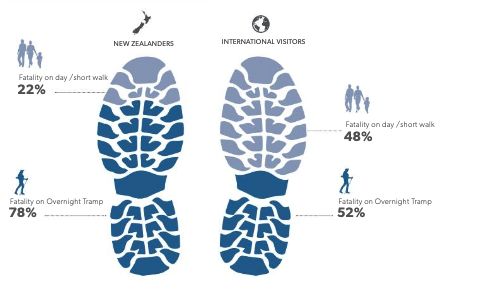
1. Executive summary
The following is an update of an environmental scan conducted for the Search and Rescue
(SAR) sector in New Zealand back in 2017. In it, you will find:
    1. a brief review of how demand for search and rescue has changed since 2017;
    2. updates on demographic, economic, social, technological and environmental trends
        relevant to the search and rescue sector; and
    3. an exploration of the possible impacts of these trends on volunteering in the search
        and rescue sector.

In the 2017 environmental scan, we noted that some macro-level environmental trends were
likely to increase demand for search and rescue, while others might ease it. For example, we
noted that increased sedentary behaviour, more urbanisation, increased diversity, changing
recreation patterns and increased ethnic diversity were all likely to dampen participation in
the outdoors, potentially reducing demand for search and rescue. We also observed that
technology would be likely to continue improving, offering the potential to keep people safer
and more locatable by Search and Rescue (SAR) teams.

By contrast, below we suggest that factors likely to increase the need for search and rescue
include population growth, increased wandering, more tourists and more extreme weather
due to climate change. We first consider how demand has changed since 2017, before trying
to understand the individual drivers at play.

Rather than simply updating key figures to 2020, we have tried to identify particularly
relevant or important trends, and to explore what these changes might mean for the sector.
One key takeaway should be that some of the environmental trends (e.g. demographic and
economic changes) are generally slow-moving, while other changes (e.g. technological
innovation and climate change) are accelerating.

On the demographic front, the population is still ageing, women are still outliving men,
urbanisation is continuing and we are still becoming more diverse. These changes, while not
rapid, do throw up some real strategic challenges for the SAR sector in the medium to longer
term. In particular, they relate to issues such as workforce planning and culture, rather than
how to manage immediate spikes in demand.

Since the 2017 environmental scan, we have not seen a major change in demand for search
and rescue. A ‘glass half full’ view of this is that, while there has been a slight uptick in
land- and aviation-based SAR operations, it could hardly be called a ‘spike’. By contrast, a
‘glass half empty’ perspective might be that prevention efforts have so far failed to
significantly reduce overall demand either.

The social trends explored in the update below appear to be moving somewhat faster than the
demographic and economic ones. Of particular relevance is the growing sense among most
New Zealanders that life is ‘moving faster’ and therefore people are feeling under time
pressure.

                                                                                                3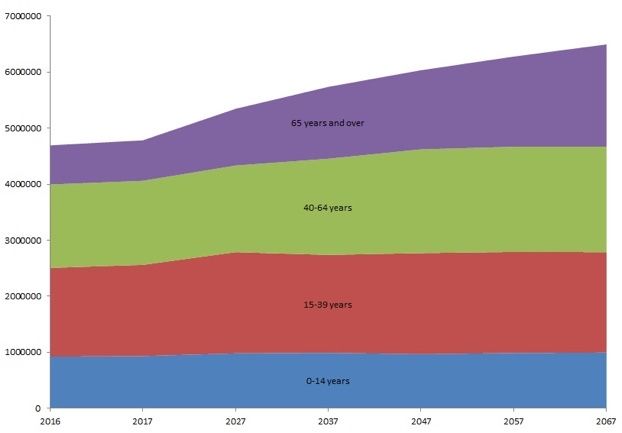
Of course, there are just as many hours in a day as 40 years ago, but most people feel there
are more demands on their time. This is particularly the case for younger people, people,
those struggling to get by economically, and people in full time work or with full-time caring
responsibilities. The challenge this presents for the SAR sector is that even a perceived lack
of time can substantially reduce the public’s willingness to volunteer, or to commit to longer-
term volunteering in the SAR sector.

The other major social trend explored below is related to attitudes when people venture into
the outdoors. There is some evidence that SAR partners’ efforts to raise awareness are
working: people are more prepared when venturing outdoors in some respects. However, the
fact that some people still stubbornly refuse to pack life jackets when going boating or to
prepare properly before going tramping, suggests that there is still work to do in this area.
Furthermore, raising awareness should only be seen as part of an overall behaviour change
strategy. There may yet be room to systematically consider necessary changes to laws,
regulations and enforcement to complement awareness-raising efforts.

We also explore below some of the less obvious links between recent economic and social
changes and the SAR sector. Economic growth, tourism and the expansion of the marine
economy are all continuing more or less as they were back in 2017. The most notable recent
changes appear to relate to the policy decisions successive recent governments have made
and the impacts of those decisions on income distribution. For the first time in 5 years, real
wages are increasing at the same time as unemployment is falling, and inequality is reducing.
While the links to the SAR sector may not be obvious, these changes are particularly relevant
for attracting volunteers generally, and particularly for those from diverse and/or deprived
backgrounds (two things that unfortunately still correlate quite closely).

This update also explores the question of whether anything has notably changed in terms of
relevant technology since the last scan. The pace of technological change is continuing to
accelerate. Without trying to be exhaustive (a hopeless endeavour when it comes to
technological change), the scan identified a couple of key trends worth monitoring. For
example, better ability to solve the ‘travelling salesman’ problem and developments in
artificial intelligence may well offer significant opportunities for speeding up search and
rescue in future and improving the chances of success.

Perhaps more challenging than the SAR sector adopting useful new technology itself is
working out how to influence the public to adopt helpful technologies. A key part of this is
likely to be making it both easy for the public to adopt useful technologies that will help them
to be located quickly, and making it less attractive to be blasé about venturing outdoors
without a means of being found. In particular, it is likely that ongoing and long-term effort
will be needed to convince the public that simply carrying a mobile phone is often
insufficient preparation.

The news on the environmental front since the last scan is less positive. While the world is
increasingly understanding the reality of climate change, progress to actually curtail it
appears to be well short of what is needed to avoid global temperatures increasing.
Even worse, the future projections in terms of sea level rise and extreme weather events due
to this warming are getting ever more dire. This is likely to drive higher demand for search
and rescue (possibly exponentially more) in the medium to long term, including for mass
rescue.

                                                                                               4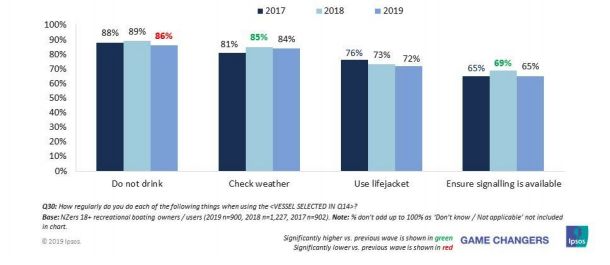
This update includes a deep dive on volunteering. In particular, several demographic trends
are likely to have a significant ongoing impact on the SAR sector’s ability to recruit and
retain volunteers:
• population growth, driven by ongoing immigration (both a contributor to demand for
    search and rescue, and possible SAR volunteers if diversity is tapped appropriately);
• population ageing and increased disability rates (affecting the physical capabilities of
    some volunteers, but also offering a source of potential new volunteers);
• ongoing urbanisation, leading to ‘hollowing out’ of some rural areas (potentially putting
    strain on a purely locally-led model of volunteering over time); and
• people feeling increasingly time poor and choosing to spend less time outdoors (which
    could both reduce demand for search and rescue, but also make it harder to attract
    volunteers).

It appears that there is no immediate volunteering crisis for the SAR sector. In particular,
many of the demographic trends described above will continue to occur gradually. This said,
just because some trends are gradual does not mean no immediate action is required. Quite
the opposite; if action to address them is not taken in a timely manner, more drastic steps are
likely to be needed later. This particularly applies to the challenge around getting a more
diverse and representative SAR workforce and ensuring it is sufficient as the environment
continues to evolve.

Investing to attract a more diverse workforce may also help the SAR sector to navigate an
environment that is increasingly volatile, uncertain, complex and ambiguous. This is because
having more diverse thinkers can enable a step-change in an organisation’s or network’s
strategic thinking ability and adaptability. However, to realise this significant strategic
benefit, the SAR sector will need to actively welcome new perspectives and skills, and be
open to doing things differently.

Of course, before it can benefit from the new perspectives of diverse volunteers, the SAR
sector needs to actually attract them. People tend not to volunteer for activities that are
irrelevant to their lives; so promoting outdoor participation and volunteering for SAR are
likely to be highly complementary activities. Also, attracting new kinds of volunteers will
require work to understand the differing values and priorities of different generations,
genders and ethnic groups. It will also mean pitching the value proposition or ‘offering’
around volunteering to each demographic in a way that resounds authentically with each.

Some questions SAR agencies may wish to explore as part of trying to attract a more diverse
volunteer workforce include:
   • What SMART1 commitments to action might each agency (and/or the sector as a
       whole) usefully make in relation to securing a volunteer workforce that better reflects
       New Zealand?
   • What does the SAR sector need to know about the demographic groups who do not
       usually volunteer for the SAR sector (e.g. the values of different ethnic groups, older
       people, women etc) in order to attract and retain them better in future?
   • How might the SAR sector ensure that there are sufficient numbers of volunteers all
       across NZ, as certain local areas face population decline?

1
    Specific, Measurable, Achievable, Realistic, Time-bound.

                                                                                              5
In this scan, we also observe that there does appear to be an increased preference for shorter-
term and episodic volunteering, particularly among younger generations. This seems to be
driven by a combination of factors: people seem to feel they are juggling more priorities, are
more economically-stretched and have a much greater array of options for filling their free
time enjoyably. This suggests that the challenge around attracting people to participate in the
outdoors, and to volunteer in the SAR sector, may well be two sides of the same coin. It is
also notable that non-NZ Europeans are both less likely to participate in the outdoors and to
volunteer for SAR agencies at present (might these things be linked?).

However, available data (particularly from overseas) does not suggest that a decline in
volunteering, including for the SAR sector, is inevitable. A targeted and personalised
approach to recruiting new volunteers will likely be the best way to attract and retain a
diverse workforce. This approach will need compelling answers to the following kinds of
questions for potential recruits:
   • Why should I care about search and rescue – why would my decision to volunteer for
       this sector make a real difference in the world?
   • What will I (and/or my community) get out of volunteering for the SAR sector? (e.g.
       training/qualifications/skills, new friends, life satisfaction, recognition etc)?
   • How much of my time (e.g. per week) will be needed when I volunteer, and how easy
       will it be to juggle volunteering for SAR with other commitments?

Finally, it is important to note that while trends can give an indication of the way things are
headed, surprises happen. A particularly useful economic concept comes into play here: that
of bounded rationality. It says simply that you cannot make decisions on the basis of
information you do not have. Hopefully the following environmental scan update slightly
widens the current information base available, while acknowledging that the only real
constant is change.

                                                                                              6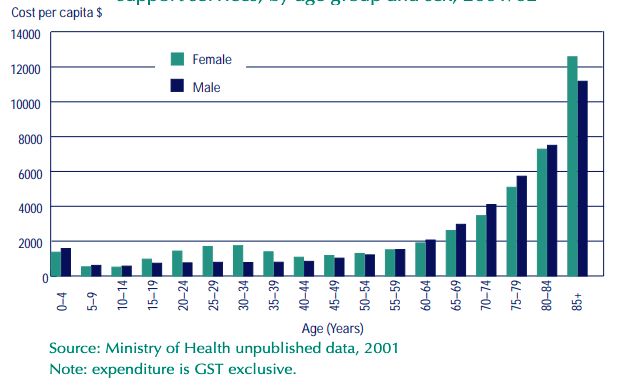
2. Demand trends update
In the figure below, it is clear that demand has not changed dramatically since 2017. This is
perhaps not surprising given only 3 years has passed since then.

                  Change in SAR incidents 2016/17 to 2018/19
 3000
 2500
 2000
 1500
 1000
  500
    0
             Land              Marine           Aviation      Undetermined    Total

                                  2016/17      2017/18     2018/19

(New Zealand Search and Rescue 2018)

We can learn more by looking at how demand has changed over a longer timeframe.
Extending the time series back ten years, we can see that the total number of SAR operations
has mostly slowly tracked upwards in line with population growth.

              Change in SAR incidents 2008/2009 to 2018/19
 6000

 5000

 4000

 3000

 2000

 1000

    0
        2008/09 2009/10 2010/11 2011/12 2012/13 2013/14 2014/15 2015/16 2016/17 2017/18 2018/19

           Land       Marine        Aviation        Undetermined      Total   Population (100,000)

(NZSAR Annual reports 2008/09 – 2018/19)

While demand has grown at a relatively stable rate over the last 10 years, it is important to
avoid so-called ‘straight line extrapolation’ about the future. In simple terms, it is dangerous
to simply place a ruler on the trend lines and assume they will continue. This is for several
reasons.

                                                                                                     7
The first reason is that the link between population growth and growth in participation
outdoors may weaken in future. For example, changing age, ethnic composition and attitudes
may also impact on the link between population growth, participation outdoors and ultimately
the need for search and rescue. Secondly, some of the contributors to SAR demand are
endogenous; i.e. people can influence them through mechanisms like safety and prevention
campaigns, which we hope will reduce the need for searches and rescues over time.
Thirdly, some of the exogenous factors, such as climate change and technological innovation,
are characterised by exponential or sudden step-changes, both of which could easily disrupt
the slow and steady growth in demand to date. Finally, major events such as wars, storms
and asteroids happen and can create unforeseen impacts that disrupt historic trends.
With these warnings about straight-line extrapolation in place, we can now look at what has
changed since the original 2017 environmental scan and refresh our analysis of what might
impact on the SAR sector in the years ahead.
83. Demography update
Demography refers to changes in the characteristics of human populations, such as overall
size, age, ethnic composition, and distribution around a country. Broadly, we can say that the
demographic trends identified in the 2017 environmental scan have continued. But there are
a few areas in which we can provide a little more detail about what these changes might mean
for the SAR sector.
3.1 The population is still growing
In the earlier scan, we noted that NZ’s population was projected to increase to over 4.9
million people by 2020 and 5.5 million by 2025. At that stage, we had to use somewhat
outdated projections since the 2018 Census had not yet been conducted. However, we can
now refresh our estimates given the new Census data. The 2018 Census population count
was 4,699,755; an increase of 457,707 people since the 2013 Census. In other words, the
population has grown consistently by about 2.1 per cent a year, with the last two years being
no exception.
In the future, the population is not guaranteed to grow, and certainly not necessarily at the
same rate. In New Zealand, population growth is mostly driven by immigration settings.
This means different governments could speed up or slow down population growth in future
depending on their policy preferences. For example, senior New Zealand First Minister
Shane Jones was recently quoted as seeking a discussion on “the changing nature of New
Zealand's societal culture through immigration.” (NZ Herald 2019)
Furthermore, even if the population does keep growing, this does not necessarily guarantee
demand for search and rescue operations will increase at the same rate. In our last scan, we
noted that only 0.05 % of the population is involved in a SAR operation each year.
Overall, we do not expect sudden changes in demand for search and rescue services due to
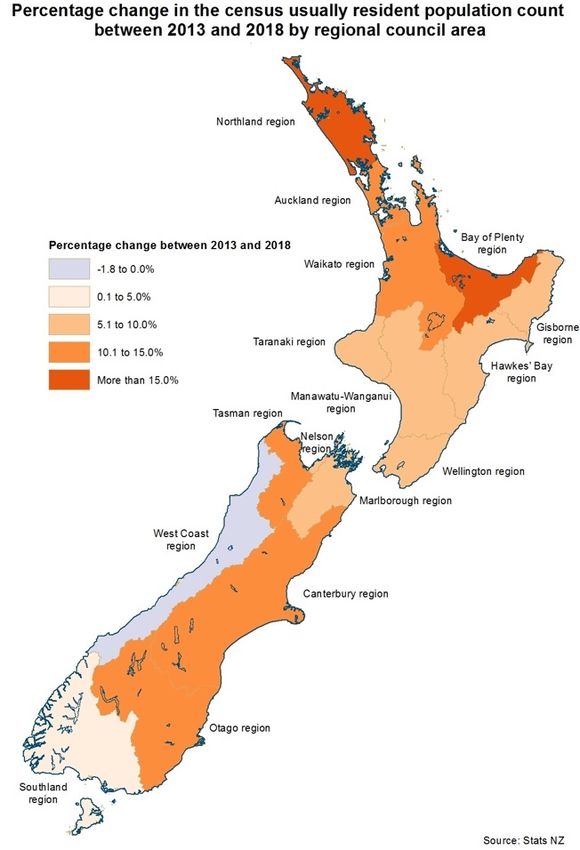
population changes at a national level. However, it is worth noting that recent population
growth has been particularly concentrated in three different areas. The Bay of Plenty and
Northland have seen more than 15% increases in population between 2013 and 2018. By
contrast, the population has shrunk in the West Coast region by between 0 and -1.8 percent
(Statistics NZ 2019).
9In reality, changes in the regional distribution of population are probably more relevant to the
question of where to source future SAR volunteers than to that of what will drive future
demand for search and rescue. This is because people do not just participate in outdoor
recreation near where they live. Recent work by the Mountain Safety Council has
highlighted this point. By exploring where ‘hotspots’ for injuries and fatalities occur around
New Zealand, it has been able to start clarifying the links between where and how people
participate in the outdoors, and demand for land-based search and rescue.
The Mountain Safety Council has found that 14% of all land-based searches and rescues
occurred in Tongariro National Park that 22% of all tramping search and rescue events were
on a Saturday and in the central north island (Mountain Safety Council 2018). They also
found that key South Island tramping destinations such as Tasman, Westland and Southland
experienced much higher fatality rates than their usual resident populations would suggest.
This is perhaps not very surprising given that these are all major tourist destinations.
3.2 We are still ageing (though there are still plenty of young people too)
In the 2017 environmental scan, we noted that one in five New Zealanders (20%) would be
aged 65+ by 2031 versus the 13% who were in 2009. Through the most recent census we can
see that the ageing of the population is progressing broadly as projected, with the number of
older people having risen from 13% to 15% of the total population by 2019. This population
ageing is good news insofar as it reflects improvements in both population health and life
expectancy. A person born in the mid 1980s has, on average, a life expectancy that is 2 years
longer than someone born in 1960 (Statistics NZ 2019).
10We are just at the beginning of a long period of population ageing. It is important to note that
this change is going to happen gradually over the next 40 years as shown in the graph below
and while there will be more older people, there will also be more 40-64 year-olds over time.
(Ministry of Social Development 2019)
3.3 Women are outliving men
Women tend to live longer than men, which is gradually being reflected in the relative
proportions of each gender as the population ages. As demonstrated in the graphs below,
there will be significantly more women than men aged 65+ by 2043.
NZ population 2018 Projected NZ population
1000000 2043
800000 1000000
600000 800000
600000
400000
400000
200000 200000
0 0
0-14 15-39 40-64 65+ 0-14 15-39 40-64 65+
Male Female Male Female
(Statistics NZ 2019)
3.4 The prevalence of dementia is increasing
The ageing population is likely continue driving more dementia, which may add to demand
for searches and rescues unless effective preventative action is taken. Already, statistics
suggest that more than 1 in 5 land searches currently involve people with dementia or other
impairment (Lawrence 2019). As one Senior Constable put it recently:
11“Back in the first days when I joined, most of our searches were people getting lost in
the bush. But with GPS now, those bush searches are reducing, but because we have
an ageing population, it’s changed to the elderly going missing.” (Lawrence 2019)
The Ministry of Health has estimated an increase from 50,000 people with dementia to
78,000 by 2026 (Ministry of Health 2014). Alzheimer’s NZ has also developed the
projections out to 2050 suggesting solid ongoing growth in dementia for the next 30 years.
Of course, such projections need to be treated with caution, given that they exclude
consideration of possible future advances in the prevention and treatment of dementia.
People with dementia are much more likely to be involved in ‘wandering’ incidents, whereby
disoriented people leave places of safety and don’t necessarily know how to return home.
Most of those who wander go missing from either their homes or rest homes (Halton 2010).
Wanderer incidents were steady at around 23% of category 1 land incidents each year
between 2010/11 and 2017/18 (LandSAR New Zealand 2019).
To respond to the expected increase in wandering, the NZSAR Council has been supporting
the ‘Safer Walking Framework’, which brings together agencies not typically involved in the
search and rescue sector, such as Alzheimer’s NZ, IHC and Autism NZ. This partnership
aims to:
• Reduce the likelihood that people with cognitive impairment will leave a safe
environment;
• Ensure whānau, carers and response agencies are ready should a response be required;
and
• Help locate and return the affected person to a place of safety as quickly as possible.
Arguably, if this framework is successful, over time we should see the number of wandering
incidents reduce, or at least staying stable over time, even if there are more people with
dementia. So far, the signs since 2017 are promising, though of course one year of reduced
incidents does not constitute a clear trend yet.
(New Zealand Search and Rescue 2018)
The organisations involved in the Safer Walking Framework have also been exploring the
best technologies available to help track people who wander. NZSAR has also funded a
research project to investigate alternatives to the existing Wander Search system currently
used throughout New Zealand. The work undertaken by WanderSearchNZ and NZ
12LandSAR so far provides some thoughtful guidance on both the practical options available to
track and find people who wander. They are also currently considering the ethical issues
associated with using technology such as GPS tracking systems, and even microchipping, to
track and find people who wander.
3.5 Disability generally is also increasing
Cognitive impairment is just one of several many different disabilities that become more
common as we age. In 2013, 24 percent of the New Zealand population were identified as
having a disability: a total of 1.1 million people (Statistics NZ 2014). As noted in the 2017
environmental scan, New Zealanders are living longer than ever before and spending more
time in good health. But as the population ages, large numbers of people identified as living
with a disability grow too. This is demonstrated in the graph below.
Estimated per capita expenditure on health and disability support services, by age
group and sex, 2001/02
(Ministry of Health 2002)
New Zealand’s disability statistics have not been updated since the previous environmental
scan. However, between 2001 and 2013, there was an increase of 20 percent in the number
of people identifying themselves as having a disability. If this trend continues (and the
ageing population suggests it is), we can expect at least 1.3 million people to have a disability
by 2023. This makes how to deal with disability a major issue for all New Zealanders and for
the SAR sector, both in terms of demand and supply of search and rescue services.
Studies overseas (Burns and Graefe 2007), Sport NZ’s Active NZ data, and the New Zealand
Office for Disability Issues have suggested that having a disability currently reduces
participation in the outdoors. So, in the absence of other interventions, we might expect
rising disability rates to reduce numbers of people participating in outdoor activities, and
ultimately demand for search and rescue services.
However, with rising understanding of the importance of physical activity for the mental and
physical wellbeing of those with (and without) disabilities, there is rising awareness and
focus on ensuring that having a disability does not prevent people from enjoying the outdoors
(Williams, et al. Summer 2004) (Jaarsma, et al. 2014).
On 11 October 2019, the New Zealand government announced an action plan to improve the
wellbeing of New Zealanders with disabilities by addressing inequalities in play, active
13recreation and sport. The initiative involves $7 million with the aim of “establishing equity
and ensuring disabled people across Aotearoa New Zealand can be just as active as non-
disabled people.” (Sport NZ 2019).
If the government is successful, many more people with disabilities could be empowered to
participate in the outdoors, improving their health and wellbeing. While this could be an
excellent outcome, it could also mean that search and rescue services in future may have to
consider the particular needs that those with disabilities may have when being rescued. This
could, for example, have implications for both the kinds of equipment and training needed.
3.6 We are becoming still more diverse
The only reason the New Zealand population is continuing to increase is because net
migration is positive; that is, there are more people entering the country than leaving or
dying. As the graph below illustrates, the number of people arriving continued to
consistently outstrip those leaving the country between 2013 and 2019.
Over the year ended June 2019, around 56,000 new people were added to New Zealand’s
population, which now stands at over 4.9 million. In other words, in the past year, migrants
increased New Zealand’s population by about 1.1% (Statistics New Zealand 2019).
But is a 1.1% population increase per year due to net migration a big amount or not? To
explore this, we need to compare New Zealand’s migration rate to that of other countries.
1.1% was about the same as Australia’s immigration rate in 2017-18, but more than triple
recent migration rates to the United States and United Kingdom. Countries like New Zealand
and Ireland tend to have larger swings in net migration rates because they have small
populations (see the graph below).
14Net migration rate by selected countries, year ended June, 2002-19
This immigration is fundamentally changing what it means to be a New Zealander. As at
September 2019, 27% of New Zealanders (or nearly 1.3 million people) were born overseas
(Statistics NZ 2019). This has increased from 25.2 percent back in 2013.
Statistics NZ has developed a new infographic which gives a useful illustration of how New
Zealand looks today. As mentioned in the 2017 environmental scan and further confirmed in
the most recent 2018 Census data, New Zealand continues to become less populated with
people of European descent, and more people of Asian, Māori and Pacific origins. The
proportion of New Zealanders who identified as NZ European fell from 74% in the 2013
census to 70% in 2018 (Statistics NZ 2019). On current projections, fifty-one percent of
New Zealanders will be Asian, Māori or Pasifika by 2038 (New Zealand Recreation
Association 2018).
(Statistics NZ 2019)
15While New Zealand is becoming more ethnically diverse, participation in the outdoors is not.
In the 2017 environment scan, we highlighted that Asian and Pacific people were less likely
to be physically active, particularly outdoors, than their non-Asian counterparts, including in
the outdoors. This trend has not changed significantly since then. The figure below shows
that, in the vast majority of outdoor recreation pursuits, NZ Europeans still tend to participate
more. The couple of notable exceptions are hunting and fishing, where Māori rates of
participation are higher.
(Sport NZ, 2017)
One explanation for the different outdoor participation rates is that different ethnic groups
face different constraints and community-defined priorities. For example, research from the
NZ Recreation Association found:
“Asian migrants wanting to access outdoor recreation, identified cost, time, transport
and ‘nobody to go with’ as the constraints. They value the social opportunities of
spending time with family, socialising and creating contacts.” (New Zealand
Recreation Association 2018)
The meaning of participating outdoors can be very different for people from different ethnic
backgrounds. For example,
For Māori, mountaineering can be perceived as an insult to the oldest ancestors, the
mountains, and Māori people are more likely to go hunting or fishing in the outdoors
– a purposeful activity. NZ Pacific Islanders may gather food and do other family-
related activities, but the cost of outdoor activities, and a recent history of working in
hard physical jobs may be part of the reasons that Pacific Island peoples rarely
tramp/hike (New Zealand Recreation Association 2018).
16Not only do NZ Europeans participate more in the outdoors, but they also get into trouble
outdoors more often. NZ Europeans are disproportionately more likely to be involved in a
search or rescue (79%) and to be injured (83%) or killed (73%) while outdoors (Mountain
Safety Council 2016). By contrast, people identifying as from a Pacific Island, Asian or
Māori were all relatively less likely to require a SAR operation.
174. Economy update
In the 2017 environmental scan, we treated the economy and government policy settings
separately. However, clearly these two things are highly inter-related, since different
governments make different decisions about things like how much tax to collect, who to
distribute it to, and how to regulate the economy and society.
While usually the influence is indirect, the economy has the potential to impact on both
demand and supply of search and rescue services. The level of economic growth generally,
unemployment rates, real wages and distribution of government benefits all impact on both
how much leisure time people have available and how they choose to spend it.
On the supply side, economic growth means government is able to collect more revenue
through taxes, which can then be distributed to various government agencies like those in the
SAR sector, to fulfil their core functions. There is also a strong link between higher incomes
and educational status, and volunteering rates. In particular, those who have higher real
wages, who are more educated, and who own a house are all more likely to volunteer.
Increases in economically-productive activities like tourism can also result in increased
demand for search and rescue downstream. This was demonstrated poignantly both after the
recent volcanic eruption on White Island, and a major hot air ballooning accident a few years
ago. Of course, disasters like these are rare, but there is plenty of demand that arises when
more people go tramping, boating or taking trips to remote places in small planes.
So, has anything changed in relation to economic and social settings since the 2017
environmental scan, and if so, how might such changes impact on the SAR sector?
4.1 Overall, the economy is still growing, and unemployment declining
In the 2017 environmental scan, we noted that annual real GDP growth was projected to rise
to a peak of 3.8% before slowing to 2.4% by 2021. The expected spike in GDP never
happened and instead it gradually slowed to its current rate of 2.4%. That said, according to
the OECD, New Zealand’s employment rate has remained high relative to most OECD
countries, rising from 75% of the working age population to 77% by 2019. (OECD 2019)
Alongside this, the unemployment rate has dropped to 4.2%, slightly below the 4.25% that
was projected at the time of the 2017 environmental scan (Statistics NZ 2019).
Unemployment rate by sex, seasonally adjusted, Sep 2007 – 2019 quarters
(Statistics NZ 2019)
18Real wages have increased since 2017
While economic growth and low unemployment are generally considered good things, there
is some evidence to suggest that full time employment may displace some other civically-
beneficial activity, such as volunteering.
Furthermore, higher employment rates do not necessarily translate to higher wages and
disposable income. The 2017 environmental scan observed that, adjusting for inflation, real
wages had shown a downward trajectory for the previous 5 years. This concern has driven a
desire by some governments (including New Zealand’s) to start seeing economic and social
improvement in a more balanced way. This is partly why there has been a recent move in
New Zealand and other countries to prioritise ‘gross national wellbeing’ rather than just
‘gross domestic product’ (Samuel 2019).
So, has there been an ongoing reduction in average real wages since the 2017 environmental
scan? In short, no. Real wages are endogenous; that is, able to be affected by changes in
government policy. For example, on 1 April 2018, the Government raised the minimum
wage by 75 cents, to $16.50 an hour and it will continue to rise in increments to $20 an hour
by 2021 (at time of writing it has already risen again to $17.70). Analysis by Statistics NZ
has found that this very first increase pushed wages and salaries up “with some of the biggest
increases coming from some of the lowest paid industries”. For example, average hourly
earnings for accommodation and food services, and retail trade increased 2.1 and 1.6 percent
respectively, for the June 2019 quarter (Statistics NZ 2018).
In the graph below, you can see that, since July 2017, unemployment has continued to track
downward, but average real wages have started growing again. This is good insofar as
increased real wages mean the average New Zealander has more money to pay for things like
participating in outdoor recreation. In short, if people have a good job and plenty of income,
they are both more likely to spend money on recreation (often outdoors) and to volunteer,
both of which impact on the SAR sector, but in different ways.
Unemployment and average hourly earnings, 2006-
2024
10.0
5.0
0.0
Aug-07
Mar-08
Oct-08
Aug-14
Mar-15
Oct-15
Jun-06
Jan-07
May-09
Dec-09
Jul-10
Feb-11
Sep-11
Apr-12
Nov-12
Jun-13
Jan-14
May-16
Dec-16
Jul-17
Feb-18
Sep-18
Apr-19
Unemployment rate Average ordinary time hourly earnings (all sectors, RHS)
(The Treasury 2019)
19NZ governments have been making inroads into inequality
Not everybody automatically benefits from economic growth. This is relevant for the search
and rescue sector because rising inequality may indirectly create challenges for securing a
sufficient number and diversity of volunteers. If people spend more time working to get
enough income to live, they tend to have less time available for volunteering. This is
particularly the case for people from economically-disadvantaged households, such as many
Māori and Pacific families, who disproportionately find themselves working multiple jobs.
As measured by the gini coefficient (where a higher coefficient means more inequality), New
Zealand had a consistently higher level of inequality than the OECD average between 1990
and 2014, as illustrated below.
(Bryan Perry 2015)
So, what affects how equal or unequal a country is? Household income levels and rates of
taxation and transfers (more often called ‘benefits’) to poorer families have a particularly
strong impacts. For example, between the late 1980s and early 1990s, poverty rates
(measured in multiple different ways) more than doubled “due to rising unemployment,
falling average real wages, benefit cuts and the introduction of market rents in social housing
(Ministry of Social Development 2019).
Over the last three decades, housing costs also have continued to take a much larger
proportion of household income, especially for low-income households. This is
demonstrated by the size of the population in low-income households being significantly
higher once housing costs are taken into account (ACH = ‘After Housing Costs’ low income
household line, whereas BHC means ‘Before Housing Costs’).
20While challenges remain in addressing high housing costs for many New Zealanders,
successive governments’ efforts to reduce inequality appear to be starting to work. Poverty
steadily fell through to 2007 with improving employment, a rising average wage, rising
female employment, the introduction of income-related rents and the Working for Families
package (Ministry of Social Development 2019).
This said, there remain indications that there are some persistent and lingering effects from
the poverty and inequality that characterised New Zealand between the late 1980s and early
2000s. For example, a survey of 900 people by the Council of Trade Unions in 2019 found
that “56 percent struggled to pay for basic necessities like rent, power and petrol” (Radio
New Zealand 2020).
"Low wages and high rents are a bad mix, and that's what a lot of working people are
caught in the middle of." – Council of Trade Unions (Radio New Zealand 2020)
Those at the bottom of the income distribution typically spend a higher proportion of their
incomes. This means that any reduction in inequality is likely to have a disproportionately
positive impact on their ability to participate in the outdoors, and to volunteer. In short,
reducing inequality is good news for more volunteering. It is also good news in terms of
enabling people from more ethnically diverse backgrounds to volunteer, since a greater
proportion of non-NZ Europeans suffer economic deprivation.
4.2 Urbanisation, due to economic realities, is still hollowing out rural NZ
In the 2017 environmental scan, we noted that the population outside Auckland was projected
to be static or decline over the next 30 years. In this update, we can demonstrate that
urbanisation has been a remarkably stable feature of New Zealand’s population change over
the past 60+ years, and is projected to continue through 2050.
Statistics New Zealand classifies 402 places as rural settlements. Of those, 146 decreased in
population between 1996 and 2018; 20 remained the same; and 43 increased by less than 10
per cent. Over that period, the proportion of New Zealand's population living in major urban
areas increased by 8 per cent, while the proportion living in rural settlements dropped 25 per
cent (New Zealand Herald 2019).
21Author and well-known economist Shamubeel Eaqub explains why urbanisation is
continuing, saying:
“Movement towards cities is driven by access to jobs, and jobs - especially in service
industries - tend to be in cities because that's where most people are.” (New Zealand
Herald 2019)
New Zealand's ongoing urbanisation
Historical data Forecast
100%
90%
80%
70%
60%
50%
40%
30%
20%
10%
0%
55
60
65
70
75
80
85
90
95
00
05
10
15
16
17
18
19
20
25
30
35
40
45
50
19
19
19
19
19
19
19
19
19
20
20
20
20
20
20
20
20
20
20
20
20
20
20
20
Urban Pop % Rural Pop (%)
(Statistics NZ)
This is not to say that the rural centres will not grow at all, but rather that the rate of their
growth is projected to be up to three times slower than that of major urban areas. For
example, over 2017 and 2018, all of the main urban centres continued to grow while West
Coast was the only region where GDP decreased (Statistics NZ 2019). Statistics NZ also
forecasts that rural centres will continue growing by an average of just 11%, compared to
37% in the main urban areas out to 2043.
Year at 30 June 2013 2018 2023 2028 2033 2038 2043 Increase
Main urban area 3,227,600 3,554,900 3,789,900 3,975,300 4,142,800 4,289,000 4,420,600 37%
Secondary urban area 249,000 266,300 275,300 282,700 289,200 294,200 298,300 20%
Minor urban area 351,700 380,800 393,700 402,600 408,900 412,400 414,100 18%
Rural Centre 75,400 79,500 81,400 82,800 83,500 83,800 83,800 11%
Other 538,500 583,100 617,600 646,300 670,600 690,500 706,400 31%
4,442,200 4,864,600 5,157,900 5,389,700 5,595,000 5,769,900 5,923,200
(Statistics NZ 2019)
Economic growth and jobs tend to work hand in hand. Consequently, over the next 30 years,
economists expect a scenario of: “many of these small communities essentially not having
enough people to be viable” (New Zealand Herald 2019). This is likely to drive ongoing
urbanisation, which may well have significant impacts for the search and rescue sector,
particularly in terms of recruiting and retaining volunteers in small rural communities.
224.3 Tourism, particularly outdoors, remains lucrative for New Zealand
Tourism has continued to contribute strongly to the New Zealand economy since 2017. The
number of international visitors increased 1.3 percent (47,939) in the year ended March 2019,
following an increase of 7.8 percent in the previous year (Statistics NZ 2019). 3.9 million
tourists arrived in the year to ended September 2019, up 95,319 from the year ended
September 2018, with visitors from Australia hitting a record high of 1.5 million (Trading
Economics 2019).
Tourism expenditure contributed $12.9 billion to the New Zealand economy in 2016. By
March 2019 this had reached $16.2 billion (Statistics NZ 2019). The following graph gives
an indication of the main source of visitors to New Zealand.
Overseas visitor arrivals by selected country of residence, year end March 2016-2019
(Statistics NZ 2019)
While the total number of visitors to New Zealand has continued to increase, as illustrated in
the graph below, the growth rate has begun to taper off over the past 3 years. This has been
driven by a drop in visitors from Asia, and particularly from China.
(Statistics NZ 2019)
Walking and hiking have been popular draw cards for international visitors for a long time.
For example, 73% of holiday visitors participated in walking or hiking in the last 3 years – an
average of 1.1 million people per year. (Tourism NZ 2019) Another 1.53 million adults took
part in recreational boating over the 2018-2019 summer (Maritime New Zealand 2019).
23The way international visitors participate in the outdoors tends to be quite different from that
of New Zealanders. Most international visitors (75%) participate in short walks of 3 hours or
less. Only 3% of them participate in an overnight trek or tramp (Tourism NZ 2019).
Whereas many more New Zealanders are killed in overnight tramps, for international visitors
the split between short walks and overnight tramps is much more even. This may suggest
that kiwis are often over-confident when it comes more ambitious tramping expeditions,
whereas international visitors are perhaps less well-prepared for short walks (Mountain
Safety Council 2018).
(Mountain Safety Council, 2018)
4.4 The marine economy is also still growing
In the 2017 environmental scan, we pointed out that global merchandise trade has increased
massively over the past 20 years. In the year ended March 2017, the marine economy
contributed $3.8 billion to New Zealand’s economy. Over the same period, shipping
contributed around $1.4 billion (Statistics NZ 2019). Fishing revenue is also estimated to
have contributed around 2% of New Zealand’s annual GDP, or approximately 1.8 billion in
the year to October 2019.
In short, the marine economy is big business and still growing. In the year ended June 2019,
there were 322,000 cruise ship passengers, up 24 percent from 2018 (Statistics NZ 2019).
More than two thirds of this increase came from Australian passenger numbers and three
quarters of them were aged 50 or over. Over this time, cruise ship expenditure in New
Zealand totalled $569.8 million, an increase of 28.2 percent since the previous year (Statistics
NZ 2019).
As predicted in the last environmental scan, we are now starting to see unmanned seafaring
vessels in our seas as well. An unmanned surface marine vessel, called a Saildrone, has
become the first to circumnavigate ca (sailing 22,000 kilometers) over 2018 (The Maritime
Executive 2019). Furthermore, in December 2017, China unveiled what it claims to be the
world’s fastest unmanned surface sea vessel with a top speed of over 50 knots or 92.6 km/h
(BelTA - People's Daily 2017).
The continued increase in sea-based trade, fishing and recreation (e.g. more people on cruise
ships), along with more unmanned vessels, means we should continue to expect more marine
traffic in the years ahead. This does not necessarily translate to more people needing search
and rescue (demand is reasonably stable at present). However, it does suggest the task of
keeping people safe in more congested seas will become increasingly complex over time.
245. Social trends update
In the 2017 environmental scan, we noted that the top five activities New Zealanders spent
most of their time on had stayed stable since 1998/1999. Those activities were sleeping, paid
work, watching television, eating and drinking, and socialising with others. The Statistics NZ
research underpinning these results has not been updated since that time. However, we can
glean further insights on by looking at recent research on volunteering and time use.
5.1 New Zealanders feel busier than in the past
In its research on the search and rescue sector, Volunteer NZ noted that around 500
respondents submitted comments, many of which highlighted the theme that they felt time
poor. Do we actually have less time available to us than previous generations? Of course
not: we all have exactly the same number of hours available in a day and arguably because
we live longer lives, we actually have more time.
When we say we are busy or time poor, what we are really saying is that we are trying to
juggle many competing priorities in the same amount of time. There is a hint that New
Zealanders are feeling more pressure to juggle various priorities in a day, including meeting
the expectations of our workplaces, communities, friends and family. In particular, younger
people appear to feel particularly pulled in different directions. For example, recent research
by Sport NZ suggested that young people are much more likely to see ‘time’ or ‘other
commitments’ as a barrier to participating in active recreation, relative to adults.
(Sport NZ 2016)
Volunteering NZ has also interviewed a wide range of people about their perceptions of
being time-poor and found that there are likely to be quite different pressures on different
demographics. They comment that:
“Older New Zealanders are retiring later in life, which reduces the length of time
they could engage in volunteering following their paid working career. New
Zealanders are having children later in life which reduces the amount of time middle-
aged adults have available for volunteering. Young people are fully engaged in the
25workforce and leading busy lives often focusing on paid work rather than making
voluntary contributions.” (Volunteering NZ 2017)
Volunteering NZ also found a mix of sentiments around people being genuinely time-poor
due to work and family life pressures and people who simply perceived they were too busy to
volunteer (i.e. more a question of relative priorities).
5.2 We’re spending more time on the couch
One reason we seem to struggling to get enough done in a day is that the range of
entertainment options available has expanded significantly. So has the quality and ease of
access to entertainment. For example, a 2016 study found that 3.2 million New Zealanders
watched more than 23 hours of television a week, excluding time spent on devices.
Furthermore, New Zealanders were found to spend a further 15 hours a week using the
internet, with this figure predicted to rise due to the rising prominence of internet-based
television (Burrows 2016).
“I think it’s getting more difficult to attract volunteers because people are more time poor
and/or there are so many distractions or entertainments that people prefer in what little
spare time they have.” (Volunteering NZ 2017)
Currently three quarters of the New Zealand population are active Facebook users, second
only to YouTube, which had an additional one percent using it actively. Furthermore,
according to the NZ E-sports federation, in New Zealand 67% of the population play video
games and 48% of those players are now female (New Zealand eSports Federation 2019).
(Statista 2019)
In view of an ever-expanding array of non-physical entertainment options available, it is
perhaps not surprising that the trend towards kiwis being sedentary has continued unabated
since the 2017 environmental scan. As demonstrated in the graph below, over the last 3
years, the number of adults either ‘physically active’ or ‘highly physically active’ originally
increased marginally, then fell again.
26In other words, there has been no sustained increase in physical activity levels (Ministry of
Health 2019). Around 1 in 3 adults (aged 15 and over) were again found to be obese in the
latest New Zealand Health Survey (Ministry of Health 2019). The prevalence of obesity for
children has also risen from 11% in 2016/17 to 11.3% in 2018/19. Obesity also remains
higher for Pacific Islanders (15.5%) and Māori (9.9%) (Ministry of Health 2019).
Physical activity levels for NZ adults, 2006-12 to 2018-
19
60
40
20
0
2006/07 2011/12 2012/13 2013/14 2014/15 2015/16 2016/17 2017/18 2018/19
Physically active Highly physically active
Insufficient physical activity Little or no physical activity
(Statistics NZ)
5.3 We are beginning to understand that safety when outdoors matters
Another social trend relevant to the SAR sector relates to attitudes regarding participation in
the outdoors. There is plenty of evidence that links attitudes regarding how to be safe in the
outdoors and the number of injuries, fatalities, and demand for search and rescue. So, how
have attitudes to outdoor participation changed since the 2017 environmental scan?
Water safety attitudes
In 2018, over 1,515,500 people took part in recreational boating (Maritime NZ 2019). Over
the past few years, the recreational boating death toll has dropped from 32 in 2014/15 to 15 in
2018/19 (Maritime NZ 2019). This is a nearly 53 percent reduction in deaths. So, annual
variation notwithstanding2 (e.g. due to colder or hotter summers), things seem to be
improving.
There are also some positive signs that the efforts to ensure people prepare before heading
outdoors, carrying the appropriate safety equipment, are beginning to pay off. For example,
as at 31 May 2019, the number of New Zealanders carrying a locator beacon when heading
into the wilderness had reached an all-time high, with 114,000 in use nationwide, 87,600 of
which were registered with the Rescue Coordination Centre NZ (Maritime NZ 2019). This
said, further improvements remain possible. For example, Maritime NZ notes that the
majority of the 15 fatalities over 2018/19 might have been avoided if lifejackets had been
worn, two forms of waterproof communication were taken to call for help, weather
conditions were properly checked before going out, and alcohol consumption was avoided.
2
19 - 20 boaties, on average, die each year (based on last five years); 19 in 2017, down to 4 in 2018 and 18 so
far in 2019 (Maritime NZ 2019)
27Of course, fatalities in the water do not just happen when people are participating in
recreational boating. New Zealand has one of the highest drowning rates in the OECD, most
of which relate to swimming. In 2017 there were 92 preventable deaths involving water
(Water Safety NZ 2018). However, as the graph below highlights, the number of fatal
drownings is reducing over time overall, though there is still work to do on reducing near-
drowning hospitalisations.
1980 – 2018 View of Drownings
(Water Safety NZ 2018)
So, does this downward trend in fatalities for both boaties and swimmers mean the SAR
sector has unequivocally succeeded in its public messaging? Unfortunately, we cannot
conclude this. It appears that for many boaties, the safety messages are still not getting
through as illustrated below.
While there was a decrease in the proportion of non-drinking boaties in 2019 (86% versus
89% in 2018), there was also a decline in boaties who make sure there are at least two ways
that they are able to call or signal for help (65% in 2019 versus 69% in 2018). Weather-
checking and lifejacket use have remained stable (Maritime NZ 2019). There has also been
little change in the number of boaties who have completed formal boating education courses:
just 1 in 5 (Maritime NZ 2019). Most worryingly, there has been a significant decrease in the
number of boaties who say they ensure there are enough lifejackets for all their passengers
‘every time’ (Maritime NZ 2019).
28You can also read