One Report 2016 - Southwest One Report
←
→
Page content transcription
If your browser does not render page correctly, please read the page content below
2016
One
Report
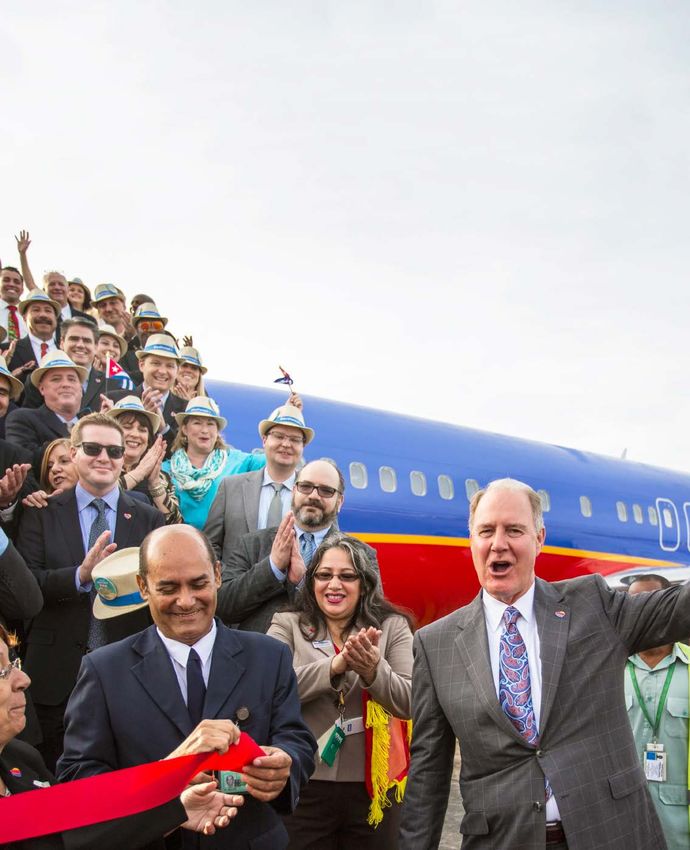
Table of                                                     03     About the Report

                                                                  04   A Word from Gary
                                                                  08   30,000 Foot View

     Contents
                                                                  10   Reporting Approach
                                                                  11   Awards
                                                                  12   Our Leadership and
                                                                       Policies & Procedures

                                                                  13     Performance

                                                                  14   Key Accomplishments
                                                                  15   Financial Results
                                                                  22   Strong Financial Position
                                                                  26   Growing Our Robust Network
                                                                  32   Looking Forward
                                                                  33   Performance Data Table

                                                                  36
     The One Report
                                                                         People

                                                                  37   Key Accomplishments
     Our triple bottom line                                       38   Employees
     The One Report is our comprehensive, integrated              48   Customers
     report that includes information on our financial            51   Communities
     performance, our Citizenship efforts, the key events of
                                                                  60   Looking Forward
     2016, and what’s on the horizon for Southwest Airlines.
                                                                  61   People Data Table
     It highlights our commitment to consider the triple
     bottom line of Performance, People, and Planet when
     looking at our business. It’s a commitment that we hope      63     Planet
     makes us a leader in global citizenship and supports our
                                                                  64   Key Accomplishments
     Purpose to connect People to what’s important in their
                                                                  65   Energy Use
     lives through friendly, reliable, and low-cost air travel,
     and our Vision to become the world’s most loved,             71   Greenhouse Gas (GHG) Emissions
     most flown, and most profitable airline.1                    78   Waste
                                                                  82   Looking Forward
     All information is as of March 31, 2017 unless
     otherwise noted.                                             83   Planet Data Table

                                                                  85     GRI Content Index

2016 Southwest Airlines One Report™
About this Report Performance People Planet GRI Content Index
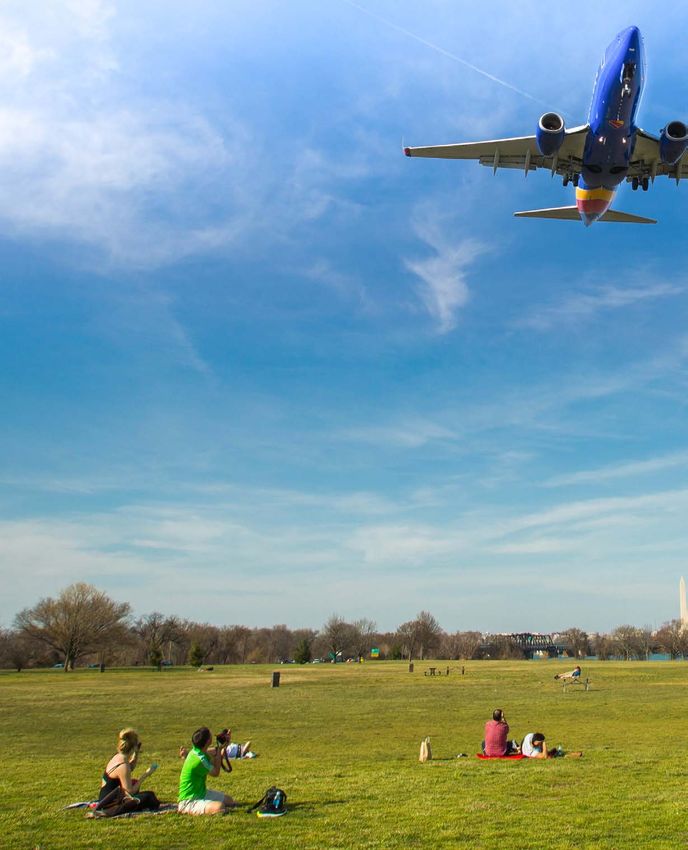
New Records,
New Adventures
A Word from Gary 04 In 2016, we took advantage of some unique
30,000 Foot View 08 growth opportunities that led to flying to new,
Reporting Approach 10
exciting destinations, including Cuba and Long
Awards 11
Our Leadership and 12 Beach, California. You’ll find information about
Policies & Procedures our expanded route map in our eighth One
Report, along with perspectives from Chairman
and CEO Gary Kelly, our 2016 financial
data, and a 30,000 foot view of everything
Southwest. Welcome. Feel free to stay awhile.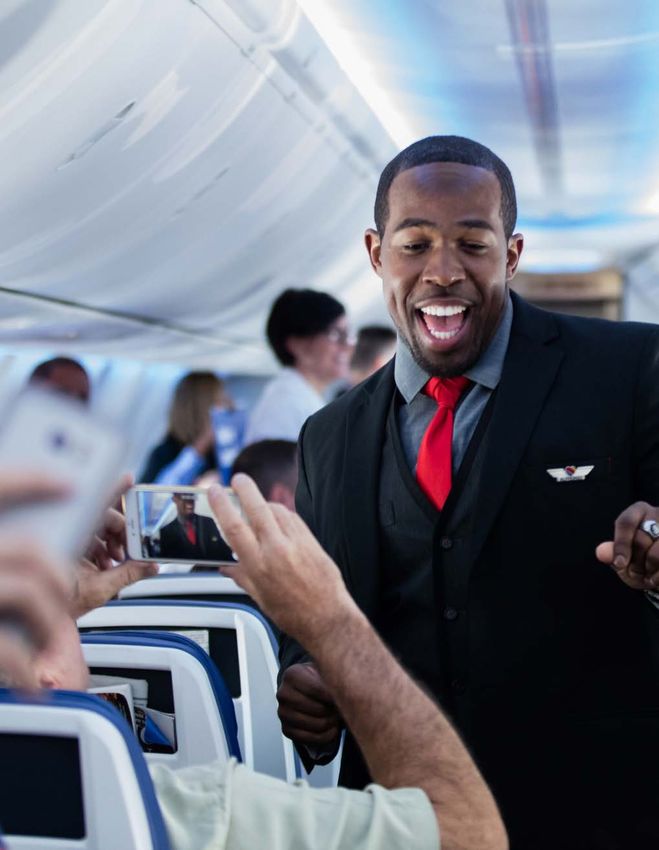
About this Report       Performance          People         Planet         GRI Content Index

     To Our Shareholders,1
     Following record years in 2014 and 2015, 2016 was another          slowed to 5.7 percent, as several of our strategic growth
     record year. It is remarkable that we were able to sustain, and    opportunities were realized (Dallas Love Field; Washington
     in some cases, improve upon the dramatic results achieved          Reagan National; Houston Hobby International). Our goal
     in 2015. The foundation was laid with strategic initiatives that   was to grow revenues in line, or better, than capacity versus
     transformed Southwest during the five years ended 2014.            a year ago. Operating revenues per available seat mile4 fell
     Our results were further boosted by the significant reduction      slightly, by 1.6 percent, due to significant low fare competition
     in energy prices, generally range-bound in the $45-$55             and industry domestic capacity growth outpacing the
     a barrel range for Brent crude oil. The result was another         sluggish economic growth. As a result, our average passenger
     year of record traffic, record load factors, record revenues,      fare5 fell 3.7 percent versus a year ago. Given that jet fuel
     record profits, and a record year-end stock price (LUV).           prices fell further, year-over-year, the net profit result was
     For the second year in a row, and for only the second time         still quite exceptional.
     in our history, our annual pre-tax return on invested capital
                                                                        We were not planning to add any new cities in 2016;
     (ROIC)2 was 30 percent or better. It was our 44th consecutive
                                                                        however, as I reported in last year’s Annual Report to
     year of profitability, a record unmatched in the domestic
                                                                        Shareholders, slots6 became available in Long Beach,
     airline industry, and a continued display of our leadership
                                                                        California, and flights resumed between the United States
     in corporate America.
                                                                        and Cuba. We reacted swiftly to these opportunities and
     Our 2016 net income was a record $2.24 billion, or $3.55           launched service to Long Beach Airport; Varadero, Cuba;
     per diluted share, 2.9 percent and 8.6 percent higher than         Havana, Cuba (our 100th destination); and Santa Clara, Cuba.
     2015, respectively. Excluding special items,2 our record 2016      We serve Long Beach with short-haul flights in California
     earnings were $2.37 billion, or $3.75 per diluted share, 0.6       and Cuba from Ft. Lauderdale and Tampa. We also launched
     percent and 6.5 percent higher than a year ago, respectively.      service from Los Angeles International Airport to Cancun,
                                                                        Puerto Vallarta, and Los Cabos, Mexico. Additional routes
     Total operating revenues topped $20 billion for the first time,    and frequencies within our existing network rounded out
     up 3.1 percent versus a year ago. On the heels of 2015’s           the balance of our 2016 expansion. It was another successful
     healthy year-over-year available seat mile3 (capacity) growth      year in network development.
     of 7.2 percent, our 2016 year-over-year capacity growth

2016 Southwest Airlines One Report™                                                                                                         4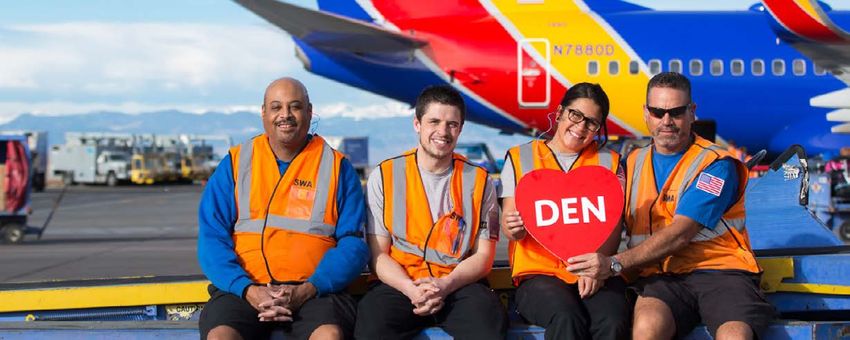
About this Report       Performance          People         Planet         GRI Content Index

     Our operating expenses grew slightly faster than capacity.          We ended the year with 723 aircraft in our all-Boeing 737
     Average 2016 jet fuel prices declined 7.2 percent on an             (B737) fleet. Currently, our firm aircraft commitments and
     “economic basis” from a year ago.2 Operating expenses               options would grow the fleet to 750 airplanes by year-end
     per available seat mile (CASM)7 increased 0.4 percent,              2018. We have several significant fleet events planned for
     year-over-year. Excluding fuel and oil expense and special          2017. First, we are the launch customer with Boeing for the
     items,2 CASM increased just 1.6 percent, year-over-year.            B737-8 (MAX) aircraft. We currently plan to launch this new
                                                                         airplane in commercial service October 1, 2017, and acquire
     Our cash flow from operations was a record $4.29 billion,           a total of 14 for the year. Second, we plan to retire the
     and our free cash flow2 was a record $2.25 billion. Our             79 remaining B737-300 (Classic) airplanes in our fleet
     financial position strengthened, sustaining our solid               between now and October 1, 2017. Finally, we plan to
     investment grade credit ratings with all three credit rating        acquire 39 new B737-800 (NG) aircraft this year. Due to
     agencies. Debt to total capital (including aircraft leases)         the accelerated retirement of the Classics, we plan to end
     declined to 32.5 percent as of year-end 2016. Our liquidity         2017 with 703 aircraft in our fleet, down from the 723 to
     increased, as well, with year-end cash and short-term               start this year. By the end of 2018, all retired Classics will
     investments of $3.3 billion plus our fully-available $1.0 billion   have been replaced with new deliveries from Boeing. The
     bank line of credit. We returned a record $1.97 billion to          Classics have served us well, but with Boeing’s support, along
     Shareholders in 2016, through $222 million in dividends             with expected reduced maintenance, fuel consumption,
     and $1.75 billion in share repurchases. In May 2016, in             and out-of-service time, we expect a substantial financial
     recognition of our exceptionally strong results, our Board          benefit, prospectively, once the Classics are retired. This is an
     of Directors authorized a $2.0 billion share repurchase             important part of our fleet modernization initiative, which has
     program and increased the quarterly dividend by
                                                                         been underway since 2011. It is exciting to see these long-
     33 percent to $.10 per share.                                       held plans come together in 2017!

     It was our 44th consecutive year of profitability,
        a record unmatched in the domestic airline
          industry, and a continued display of our
             leadership in corporate America.

2016 Southwest Airlines One Report™                                                                                                          5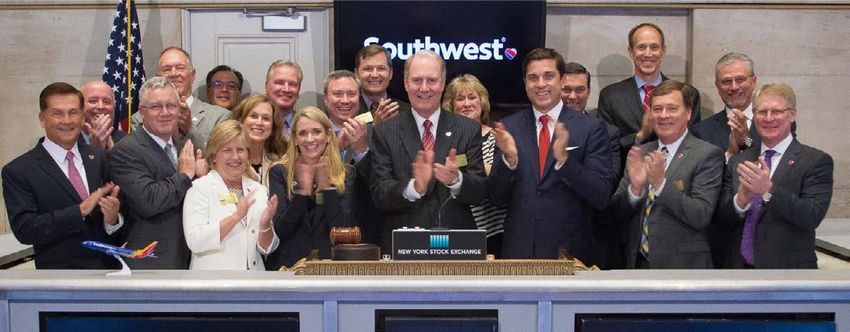
About this Report     Performance            People     Planet            GRI Content Index

                                                              KEY HIGHLIGHTS

                                                                                                              44
              California
                           4     new
                                 destinations
                                       Varadero
                                                                                101
                                                                                 destinations in
                                                                                  9 countries
                                                                                                           consecutive years
                                                                                                             of profitability

                              Havana          Santa Clara

                                                                                      Ranked

                                                                                   #1
                                                                                                             Carried more than

           Long Beach                                       Cuba

                                                                                 in lowest number of
                                                                                                              124
                                                                                                              million
                                                                               Customer complaints per          Customers with
                                                                                100,000 enplanements           an annual record
                                                                                      (U.S. DOT)               84% load factor11

     Another long-term effort scheduled to come to fruition            from FLL, but plan to add service to Belize, Jamaica, and
     in 2017 is the completion and deployment of our new               Mexico along with our newest destination, Grand Cayman.
     Amadeus Altéa reservation system on May 9, 2017. Our              This is a much-anticipated and much-needed enhancement
     current reservation system dates back to the 1980s. It, too,      to our FLL franchise.
     has served us well, but it is not well suited to our current
                                                                       Overall, our outlook continues to be upbeat. Once again,
     or future needs. The effort to replace it is significant and
                                                                       we are off to a very strong start to the year, in terms of
     strategic, and has been years in the making. We announced
                                                                       operational reliability, Customer satisfaction, and travel
     the first phase of the deployment into production in
                                                                       demand. There appear to be high expectations for tax reform,
     December 2016. The project is on track, and we look
                                                                       regulatory reform, and air traffic control modernization.
     forward to the next important milestone in this effort.
                                                                       In turn, there appear to be high expectations for domestic
     Once implemented, the system provides the foundation
                                                                       GDP growth. We welcome all of that. In the meantime,
     for future planned releases with further enhancements.
                                                                       while economic growth is still lackluster, energy prices are
     We expect to derive benefits ranging from improved
                                                                       stable at moderate prices, and travel demand is strong in
     Customer Experiences to improved revenue management.
                                                                       a very competitive environment. We are positioned and
     We look forward to giving our Employees better tools that
                                                                       poised to compete vigorously and well. With the fleet
     allow us to better serve our Customers and Shareholders.
                                                                       plan I outlined previously, we currently plan to grow our
     Another significant long-term effort scheduled for 2017 is        capacity approximately 3.5 percent in 2017, split roughly
     the completion of a new five-gate international terminal at       two-thirds to our domestic network and the remainder to
     the Ft. Lauderdale-Hollywood International Airport (FLL),         international growth. In addition to adding Grand Cayman
     slated for June 2017. Coincident with the opening is the          to our route map, we are consolidating our Ohio cities by
     launch of new international service at FLL by Southwest           closing operations at Akron-Canton Airport and adding
     Airlines. Currently, we serve just The Bahamas and Cuba           flights at nearby Cleveland Hopkins International Airport.

2016 Southwest Airlines One Report™                                                                                                        6
About this Report       Performance          People         Planet         GRI Content Index

                                                                      from those years of hard work. Because of our People,
                                                                      Southwest is well-prepared to compete aggressively for
                                                                      Customers’ business and loyalty. Southwest is committed to

             Our Vision is                                            provide Shareholder returns. And, Southwest is well-
                                                                      prepared for tougher times, whether it be from economic

            audacious, but                                            weakness, energy price spikes, or brutal competition.
                                                                      Our People have us better prepared than ever, in fact.
                                                                      And, we have opportunities to further improve our already
       I believe in our People.                                       excellent operations, our outstanding Customer Service,
                                                                      and our expansive route map.
          They are Warriors!                                          As I said last year, our Purpose is to connect People to what’s
                                                                      important in their lives through friendly, reliable, and low-cost
                                                                      air travel. We take great care of our Employees, so they can
                                                                      take great care of our Customers. If we do both well—keep
                                                                      our service levels high and our fares low—we can take great
                                                                      care of our Shareholders. And, we have.
     We are scheduled to begin service at Cincinnati/Northern
     Kentucky International Airport (which, admittedly, has           This is now the 23rd consecutive year that Southwest has
     been conspicuous in its absence from our expansive route         been named to Fortune’s list of World’s Most Admired
     network), and close operations at nearby Dayton International    Companies, coming in at #8. We’re proud of that. And, as
     Airport to accommodate it. Much has changed in these             America’s largest airline in terms of originating domestic
     Ohio airports, competitively, over the last five to six years,   passengers,8 we aspire to more—to become the world’s most
     and these moves will position us better. It is never easy to     loved, most flown, and most profitable airline. Our Vision is
     close a location, but we will continue to offer service to       audacious, but I believe in our People. They are Warriors!
     Customers in those two markets via Cleveland and Cincinnati.
                                                                      Please join me in thanking all 53,536 Employees for their
     We have lived through a remarkable period, be it the last 5      hard work and superb results!
     years, 10 years, or more than 15 since 9/11. Our People have
     worked extraordinarily hard to weather the storms, transform     Sincerely,
     Southwest, and still serve our Customers and Shareholders
     well. They have done that. From 2001 through 2012, there
     were some tough, lean years. But, our People never faltered.
     No annual losses. No bankruptcies. No layoffs. No massive
     reduction in service. Instead, Southwest stayed profitable,      Gary C. Kelly
     job secure, and growing—throughout. Now, our People, our         Chairman and Chief Executive Officer
     Customers, and our Shareholders are reaping the benefits         March 24, 2017

2016 Southwest Airlines One Report™                                                                                                       7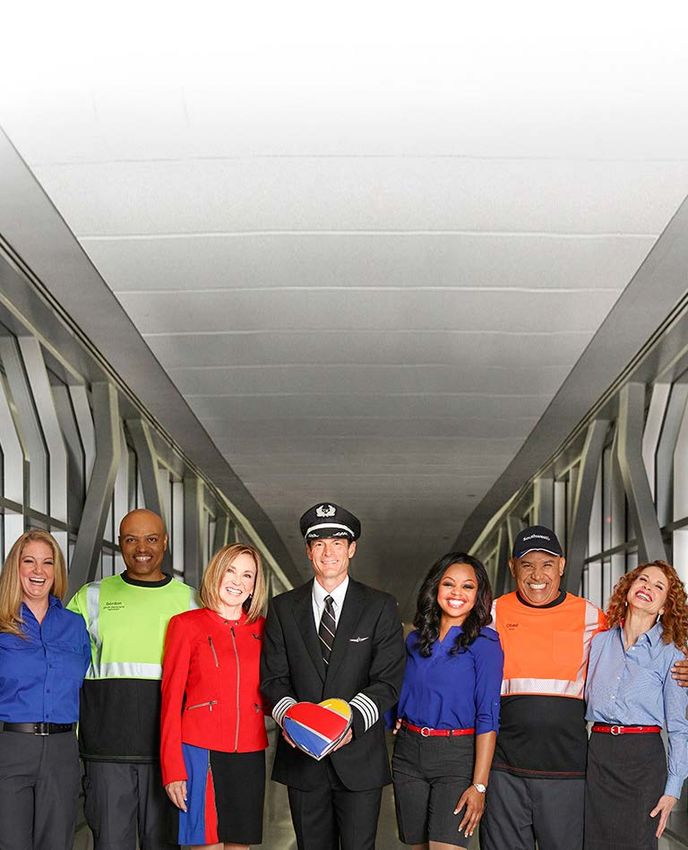
About this Report Performance People Planet GRI Content Index
30,000 Foot View
As of Dec. 31, 2016, we proudly operated a network of 101 destinations in the United States and
eight additional countries with more than 3,900 departures a day during peak travel season.
SEATTLE/TACOMA
System
SPOKANE
PORTLAND
PORTLAND
Map
MANCHESTER
BOISE ROCHESTER ALBANY
MINNEAPOLIS/ BOSTON LOGAN
ST. PAUL PROVIDENCE
GRAND HARTFORD/SPRINGFIELD
MILWAUKEE RAPIDS BUFFALO/
FLINT NIAGARA FALLS LONG ISLAND/ISLIP
DETROIT
NEW YORK (LAGUARDIA)
NEW YORK (NEWARK)
as of Dec. 31, 2016 RENO/TAHOE CLEVELAND
DES MOINES
CHICAGO AKRON/ PHILADELPHIA
SACRAMENTO PITTSBURGH
SALT LAKE CITY (MIDWAY) CANTON
OAKLAND OMAHA BALTIMORE/WASHINGTON (BWI)
SAN FRANCISCO (SFO) COLUMBUS
INDIANAPOLIS WASHINGTON, D.C. (DULLES)
SAN JOSE WASHINGTON, D.C. (REAGAN NATIONAL)
DENVER DAYTON
KANSAS CITY ST. LOUIS
RICHMOND
LOUISVILLE NORFOLK/VIRGINIA BEACH
LAS VEGAS
WICHITA
RALEIGH/DURHAM
BURBANK
LOS ANGELES (LAX) ONTARIO NASHVILLE CHARLOTTE
LONG BEACH ORANGE ALBUQUERQUE
AMARILLO TULSA MEMPHIS
COUNTY
SAN DIEGO LITTLE ROCK GREENVILLE-
OKLAHOMA CITY SPARTANBURG
PHOENIX
LUBBOCK CHARLESTON
TUCSON ATLANTA
DALLAS (LOVE FIELD) BIRMINGHAM
EL PASO
MIDLAND/ODESSA
JACKSONVILLE
AUSTIN
View our interactive HOUSTON (HOBBY)
NEW ORLEANS PENSACOLA PANAMA
ORLANDO
SAN ANTONIO
route map for our
CITY BEACH
TAMPA
CORPUS CHRISTI
FT. MYERS/NAPLES WEST PALM BEACH
most current list HARLINGEN/SOUTH PADRE ISLAND
FT. LAUDERDALE (MIAMI AREA)
NASSAU
of destinations at: CABO SAN LUCAS/LOS CABOS VARADERO
Southwest.com/ HAVANA SANTA CLARA
PUNTA CANA
SAN JUAN
routemap CANCÚN
PUERTO VALLARTA MONTEGO BAY
MEXICO CITY
BELIZE CITY ARUBA
LIBERIA
SAN JOSÉ
Capacity West 32%
by Region
Midwest 17%
Southeast 16%
as of Dec. 31, 2016
Southwest 14%
East 14%
Northwest 3%
International 3%
Puerto Rico 1%
2016 Southwest Airlines One Report™ 8
About this Report    Performance   People       Planet        GRI Content Index

                                         9
       Top 10 Airports
       daily departures as of Dec. 31, 2016

        1      MDW: 256
               Chicago Midway
                                                         5 DAL:     180
                                                           Dallas Love Field
                                                                                            8       ATL: 124
                                                                                                    Atlanta

        2      BWI: 235
               Baltimore-Washington
                                                         6 PHX:
                                                           Phoenix
                                                                   172                      9       LAX: 123
                                                                                                    Los Angeles

        3      DEN: 197
               Denver
                                                         7 HOU:     168
                                                           Houston Hobby
                                                                                            10 OAK:
                                                                                               Oakland
                                                                                                       122

        4      LAS: 191
               Las Vegas

                                    8
      Market Share

      Southwest
Southwest                                                                   Southwest
                                                                      Southwest
  24% 24%                                                                 67% 67%

                                                                                       Top 100 Top 100
                      Total Total                                                   domesticdomestic
                                                                                              origin origin
                           domestic
                     domestic                                                              and destination
                                                                                    and destination
                      market market                                                            city pairs
                                                                                       city pairs

                         Other        Other                                                  Other        Other
                        Carriers     Carriers                                               Carriers     Carriers
                          76%          76%                                                    33%          33%

 2016 Southwest Airlines One Report™                                                                                        9
About this Report   Performance   People   Planet   GRI Content Index

                                Reporting Approach
               Our Employees, Customers, Shareholders, suppliers, and community
              groups all contribute to the many opportunities we see for the future of
              our Company. We listen to and learn from our many Stakeholders, which
                helps shape the content of the One Report and reflects our ongoing
                  commitment to connect People to what’s important in their lives.

2016 Southwest Airlines One Report™                                                                    10
About this Report Performance People Planet GRI Content Index
Ranked 8th Awarded Named Best
(in 2017) Domestic Carrier Low Cost Carrier
Most Admired Companies
of the Year in North America
in the World list
Airforwarders Association Premier Traveler
FORTUNE magazine (7th consecutive year) (3rd consecutive year)
(23rd consecutive year)
2016 Airline
Program of
#30
Named 2016
the Year
for our
Most Valuable
100 Best Corporate Rapid Rewards® Employer
Citizens 2016 program for military
Corporate Responsibility Magazine InsideFlyer CivilianJobs.com
Ranked #13 Won Named one of
Best Employer Best Airline in North America America’s
in 2016 Best Airline in Customer Service
Most Just
Companies
Forbes Best Airline in Social Media
Forbes
SimpliFlyingAbout this Report Performance People Planet GRI Content Index
Our Leadership
Current Officers
http://www.southwestairlinesinvestorrelations.com/corporate-governance/
company-officers
Board of Directors
http://www.southwestairlinesinvestorrelations.com/corporate-governance/
board-of-directors
Board Committees
http://www.southwestairlinesinvestorrelations.com/corporate-governance/
board-committees
Policies & Procedures
We have developed a set of policies and procedures that guide
our day-to-day business activities. Follow these links to review our
Corporate Governance Guidelines and our Corporate Policies.
Corporate Governance Guidelines
http://www.southwestairlinesinvestorrelations.com/corporate-governance/
corporate-governance-guidelines
Corporate Policies
http://www.southwestairlinesinvestorrelations.com/corporate-governance/corporate-
bylaws-articles-of-incorporation-and-corporate-policies/corporate-policies
2016 Southwest Airlines One Report™ 12About this Report Performance People Planet GRI Content Index
A Record-
Setting Year of
Performance
Key Accomplishments 14 Southwest had an exceptional year in 2016.
Financial Results 15
We carried a record number of Customers
Strong Financial Position 22
Growing Our Robust Network 26
while improving ontime performance,10 baggage
Looking Forward 32 delivery rates, and Customer Satisfaction scores.
Performance Data Table 33 We saw record profits delivered at strong margins.
We grew our route network, preserved our
strong financial position, and returned significant
value to our Shareholders. Read on for a look at
our financial and operational performance.
2016 Southwest Airlines One Report™ 13About this Report Performance People Planet GRI Content Index
KEY ACCOMPLISHMENTS
Ontime performance10 of
80.8%
(up 1.1 points in 2016)
$2.2 billion We earned a record
$2.2 billion in profits in 2016
$3.3 billion Cash and short-term
investments as of Dec. 31, 2016
2016 Southwest Airlines One Report™ 14About this Report Performance People Planet GRI Content Index
KEY TOPIC
Financial Results
Show up and work hard. That’s a Core Value of Working the Southwest Way. It’s also how Southwest
achieved another year of improved profitability and operational performance. It took all 53,000-plus
Southwest Employees, working to deliver exemplary Customer Service, to attain record revenues.
We flew more People than in any previous year—all while delivering our unique brand of service that
produces satisfied, loyal Customers.
84.0%
30.0%
ROIC record annual
load factor
Excellent Returns Record Percentage of Seats Filled
2016 was our second consecutive year to achieve annual Our 2016 load factor11 set a new Southwest annual record.
pretax return on invested capital (ROIC)2 of 30% or more.
STORIES
Another Year of Record Profits Raising the Record Revenue Bar Focus on Low-Cost Discipline A Decade of Consistent Performance
2016 Southwest Airlines One Report™ 15About this Report Performance People Planet GRI Content Index
Another Year of Record Profits
Our loyal and expanding Customer base contributed to a record net income of $2.2 billion in 2016, representing an exceptional
433 percent growth in profits since 2012. Our Rapid Rewards® frequent flyer program, the acquisition of AirTran, the continued
optimization of our network, and the ongoing modernization of our fleet—including the addition of the Boeing 737-800—have
contributed to this multi-year growth. Excluding special items,2 our 2016 net income was also a record at $2.4 billion.
Net Income
$2,500
$2,355 $2,370
$2,244
$2,181
$2,000
(in millions)
$1,500
$1,397
$1,136
$1,000
$805
$754
$500
$421 $417
0
2012 2013 2014 2015 2016
Net Income Net Income, excluding special items2
2016 Southwest Airlines One Report™ 16About this Report Performance People Planet GRI Content Index
Raising the Record Revenue Bar
As demand for our world-class Hospitality reached record levels in 2016, so did our revenue performance. Our total operating
revenues rose to a record $20.4 billion, up 3.1 percent from 2015. This was especially notable in the competitive fare
environment that existed throughout the year, which resulted in a reduction in our average passenger fare5 and a decline in our
passenger revenue yield.12
Still, our commitment to provide friendly service and low fares, and a network that aligns to our Purpose, produced a record
annual load factor11 of 84.0 percent. Our award-winning Rapid Rewards® frequent flyer program and other ancillary revenue
products, including our EarlyBird Check-In® and A1-15 select boarding, also contributed to our strong revenue performance.
Sources of Passenger Revenue
Travel
Agency
6%
$
Internet Other
79% 15%
2016 Southwest Airlines One Report™ 17About this Report Performance People Planet GRI Content Index
Focus on Low-Cost Discipline
Our strategy to keep costs low includes the use of a single programming and consulting expenses associated with large
aircraft type, the Boeing 737, operating an efficient point- technology projects, and higher wage rates due to amended
to-point route structure, ongoing work to reduce fuel labor union contracts. These cost pressures were partially
consumption, and highly productive Employees. Our low-cost offset by lower fuel prices, as well as our ongoing efforts
structure is one of our competitive advantages, as it has to reduce fuel consumption and improve fuel efficiency
enabled us to offer low fares, drive traffic volume, and grow through fleet modernization and other initiatives. In addition,
market share. we have a fuel hedging program that strives to mitigate risk
associated with the volatility of the energy markets and the
Adjusted for stage length,13 Southwest had lower operating accompanying impact on our fuel and oil expense.1
expenses per available seat mile3,7 (unit costs), on average, in
2016 than the majority of major domestic carriers.14 When taking into consideration the 5.7 percent year-
over-year growth in our available seat miles, our unit costs
In 2016, our total operating expenses increased as increased a modest 0.4 percent, and excluding special items2
compared with 2015. The increase in our costs was primarily declined 0.7 percent, year-over-year.
driven by incremental depreciation expense from the
accelerated retirement of our Boeing 737-300 fleet, contract
Adjusted for stage length, Southwest had lower
unit costs, on average, in 2016 than the majority
of major domestic carriers.
2016 Southwest Airlines One Report™ 18About this Report Performance People Planet GRI Content Index
A Decade of Consistent Performance
Our Ten-Year Summary tells a story of consistent profitable performance.
Ten-Year Summary
2016 2015 2014 2013 2012 2011 2010 2009 2008 2007
Selected Consolidated Financial Data
(Dollars in millions except per share amounts, unaudited)
Operating revenues:
Passenger $18,594 $18,299 $17,658 $16,721 $16,093 $14,754 $11,489 $9,892 $10,549 $9,457
Freight 171 179 175 164 160 139 125 118 145 130
Special — 172 — — — — — — — —
revenue
adjustment
Other 1,660 1,170 772 814 835 765 490 340 329 274
Total 20,425 19,820 18,605 17,699 17,088 15,658 12,104 10,350 11,023 9,861
operating
revenues
Operating 16,665 15,704 16,380 16,421 16,465 14,965 11,116 10,088 10,574 9,070
expenses
Operating 3,760 4,116 2,225 1,278 623 693 988 262 449 791
income
Other 213 637 409 69 (62) 370 243 98 171 (267)
expenses
(income), net
Income 3,547 3,479 1,816 1,209 685 323 745 164 278 1,058
before
income taxes
2016 Southwest Airlines One Report™ 19About this Report Performance People Planet GRI Content Index
2016 2015 2014 2013 2012 2011 2010 2009 2008 2007
Selected Consolidated Financial Data, Continued
Provision for 1,303 1,298 680 455 264 145 286 65 100 413
income taxes
Net income $2,244 $2,181 $1,136 $754 $421 $178 $459 $99 $178 $645
Net income $3.58 $3.30 $1.65 $1.06 $0.56 $0.23 $0.62 $0.13 $0.24 $0.85
per share,
basic
Net income $3.55 $3.27 $1.64 $1.05 $0.56 $0.23 $0.61 $0.13 $0.24 $0.84
per share,
diluted
Cash $0.3750 $0.2850 $0.2200 $0.1300 $0.0345 $0.0180 $0.0180 $0.0180 $0.0180 $0.0180
dividends
per common
share
Total assets $23,286 $21,312 $19,723 $19,177 $18,350 $17,805 $15,249 $13,978 $13,703 $16,772
Long-term $2,821 $2,541 $2,434 $2,191 $2,883 $3,107 $2,875 $3,325 $3,498 $2,050
debt less
current
maturities
Stockholders’ $8,441 $7,358 $6,775 $7,336 $6,992 $6,877 $6,237 $5,454 $4,953 $6,941
equity
Consolidated Financial Ratios
Return on 10.1% 10.6% 5.8% 4.0% 2.3% 1.1% 3.1% 0.7% 1.2% 4.3%
average total
assets
Stockholders’ $13.72 $11.36 $10.03 $10.47 $9.57 $8.90 $8.35 $7.34 $6.69 $9.04
equity per
common
share O/S
Operating 18.4% 20.8% 12.0% 7.2% 3.6% 4.4% 8.2% 2.5% 4.1% 8.0%
margin
Net margin 11.0% 11.0% 6.1% 4.3% 2.5% 1.1% 3.8% 1.0% 1.6% 6.5%
Consolidated Operating Statistics
Revenue 124,719,765 118,171,211 110,496,912 108,075,976 109,346,509 103,973,759 88,191,322 86,310,229 88,529,234 88,713,472
passengers
carried
Enplaned 151,740,357 144,574,882 135,767,188 133,155,030 133,978,100 127,551,012 106,227,521 101,338,228 101,920,598 101,910,809
passengers
RPMs (000s) 15 124,797,986 117,499,879 108,035,133 104,348,216 102,874,979 97,582,530 78,046,967 74,456,710 73,491,687 72,318,812
ASMs (000s)3 148,522,051 140,501,409 131,003,957 130,344,072 128,137,110 120,578,736 98,437,092 98,001,550 103,271,343 99,635,967
Passenger 84.0% 83.6% 82.5% 80.1% 80.3% 80.9% 79.3% 76.0% 71.2% 72.6%
load factor11
2016 Southwest Airlines One Report™ 20About this Report Performance People Planet GRI Content Index
2016 2015 2014 2013 2012 2011 2010 2009 2008 2007
Consolidated Operating Statistics, Continued
Average 1,001 994 978 966 941 939 885 863 830 815
length of
passenger
haul (miles)
Average 760 750 721 703 693 679 648 639 636 629
stage length
(miles)13
Aircraft 11:08 11:13 10:54 10:45 10:55 11:10 10:48 10:50 11:36 11:41
utilization
(hours and
minutes
per day)
Trips flown 1,311,149 1,267,358 1,255,502 1,312,785 1,361,558 1,317,977 1,114,451 1,125,111 1,191,151 1,160,699
Average $149.09 $154.85 $159.80 $154.72 $147.17 $141.90 $130.27 $114.61 $119.16 $106.60
passenger
fare5
Passenger 14.90¢ 15.57¢ 16.34¢ 16.02¢ 15.64¢ 15.12¢ 14.72¢ 13.29¢ 14.35¢ 13.08¢
revenue yield
per RPM12
Operating 13.75¢ 13.98¢ 14.20¢ 13.58¢ 13.34¢ 12.99¢ 12.30¢ 10.56¢ 10.67¢ 9.90¢
revenue yield
per ASM2,4
Operating 11.22¢ 11.18¢ 12.50¢ 12.60¢ 12.85¢ 12.41¢ 11.29¢ 10.29¢ 10.24¢ 9.10¢
expenses
per ASM7
Operating 8.76¢ 8.60¢ 8.46¢ 8.18¢ 8.07¢ 7.73¢ 7.61¢ 7.19¢ 6.64¢ 6.40¢
expenses
per ASM,
excluding
fuel
Fuel cost $1.82 $1.90 $2.93 $3.16 $3.30 $3.19 $2.51 $2.12 $2.44 $1.80
per gallon,
including tax
Fuel 1,996 1,901 1,801 1,818 1,847 1,764 1,437 1,428 1,511 1,489
consumed,
in gallons
(millions)
Active, 53,536 49,583 46,278 44,831 45,861 45,392 34,901 34,726 35,499 34,378
full-time
equivalent
Employees
at yearend
Aircraft at 723 704 665 681 694 698 548 541 537 520
yearend16
2016 Southwest Airlines One Report™ 21About this Report Performance People Planet GRI Content Index
KEY TOPIC
Strong Financial Position
We’re proud of our strong balance sheet and liquidity. Our record profits and manageable
capital spending produced record free cash flow,2 enabling us to return significant value
to our Shareholders.
Southwest remained the
$2.3 only domestic airline with Nearly
billion
an investment grade credit $2 billion
rating from all three credit Returned to Shareholders
Record free cash flow through a combination of
generated in 2016 rating agencies: dividends and share
Moody's, Fitch, and repurchases
LUV
Standard & Poor’s.17
STORIES
Industry-leading Balance Sheet Balanced Capital Deployment 2016 Capital Expenditures Breakdown
2016 Southwest Airlines One Report™ 22About this Report Performance People Planet GRI Content Index
Industry-leading Balance Sheet
Southwest ended the year with $3.3 billion in cash and short-term investments, along with a fully available unsecured revolving
credit line of $1.0 billion. We continued to be the only domestic airline with investment grade credit ratings from all three credit
rating agencies. Our leverage, including off-balance-sheet aircraft leases, was 32.5 percent at the end of 2016.
Credit Agency Ratings18
Chris Monroe, Senior Vice President, Finance
Non-Investment Grade Investment Grade
S&P/Fitch B- B B+
B+ BB- BB BB+ BBB- BBB BBB+ A-
Moody’s B3 B2 B1 Ba3 Ba2 Ba1 Baa3 Baa2 Baa1 A3
Southwest Airlines S&P M F
Alaska Airlines S&P F
Allegiant Air M S&P
American Airlines M F S&P
Delta S&P M F
Hawaiian Airlines M F S&P
jetBlue M F S&P
Spirit Airlines S&P F
United Airlines M S&P F
S&P Standard & Poor’s17 F Fitch Ratings M Moody’s
2016 Southwest Airlines One Report™ 23About this Report Performance People Planet GRI Content Index
Balanced Capital Deployment
We strive to maintain a balanced capital deployment strategy. Since 2010, through March 31, 2017, we have returned
In 2016, we achieved record cash flow from operations of nearly $6.4 billion to our Shareholders through $771 million
$4.3 billion, and our capital expenditures were $2.0 billion. in dividends and $5.6 billion in share repurchases.
This allowed us to generate record free cash flow,2 of which
we returned nearly 90 percent to our Shareholders through a
combination of $222 million in dividends and $1.75 billion in
share repurchases.
The Southwest Board of Directors
During the first quarter of 2017, we returned $673 million
to Shareholders through a combination of $123 million in
declared our 162nd consecutive
dividends and $550 million in share repurchases. As of quarterly dividend on Feb. 2, 2017.
March 31, 2017, we have $400 million remaining under our
May 2016 $2.0 billion share repurchase authorization.
Returns to Shareholders
$2,000
$1,750
$1,500
(in millions)
$1,180
$955
$1,000
$540
$500
$400
$225 $71 $222
$14 $22 $139 $180
0
2011 2012 2013 2014 2015 2016
Dividends Share Repurchases
2016 Southwest Airlines One Report™ 24About this Report Performance People Planet GRI Content Index
2016 Capital Expenditures Breakdown
Prudent investments in our business allowed us to deliver on our Purpose and support our Vision. In 2016, we had
approximately $2.0 billion in capital expenditures, with the majority related to aircraft purchases. Technology was our next largest
capital expenditure, largely related to the replacement of our domestic reservation system and several operating initiatives
designed to drive efficiency, reliability, and scalability. We also made meaningful investments in our facilities around the system,
including a new Flight Training Center at our Headquarters, which we have named “Wings.”
Allocation of 2016 Capital Spend
Other
Facilities
Technology
Aircraft
size of circle relative to spending
2016 Southwest Airlines One Report™ 25About this Report Performance People Planet GRI Content Index
KEY TOPIC
Growing Our Robust Network
Our friendly, reliable, and low-cost air travel helped Southwest remain the largest domestic air
carrier in the United States.8 We were the leader in 25 of the top 50 U.S. metro areas,19 and held
a 67 percent market share,8 collectively, in the 95 markets we served out of the top 100 domestic
origin and destination city pairs, including co-terminal airports.20
With a point-to-point network allowing for more direct routing, approximately 76 percent of our
Customers flew nonstop during 2016 on the 657 nonstop city pairs we offered. Our available seat
miles3 (capacity) grew 5.7 percent in 2016, year-over-year, driven largely by the annualized impact
of 2015’s growth. As we look to the exciting growth opportunities ahead, we seek to expand our
network prudently and profitably.1
Cuba became the ninth
country on our route map,
24% and Havana marked 101
Southwest Airlines
total domestic
Southwest’s 100th destination Destinations served
market share —both significant and proud
milestones for Southwest
STORIES
Fleet Composition Domestic Network International Expansion ¡Bienvenidos a Cuba!
2016 Southwest Airlines One Report™ 26About this Report Performance People Planet GRI Content Index
Fleet Composition
Our all-737 fleet is the world’s largest Boeing fleet of any airline.
Fleet Composition
737-800
142
planes
737-700
494
723
Fleet total
737-300
87
planes planes
2016 Southwest Airlines One Report™ 27About this Report Performance People Planet GRI Content Index
Domestic Network
Most of our 2016 capacity3 growth was driven by additional
depth and frequency in existing domestic markets, as well
as new routes between existing domestic destinations
previously not connected.
In June 2016, we were thrilled to add Long Beach, California
to our route network. We now serve all five major commercial
airports in the Los Angeles Basin, and we’re still the largest
carrier in California, offering more seats than any other carrier
each day to, from, and within the state.8 “As our unique-point-to-point network
has evolved over the past few decades,
we’ve proven it can scale, and we’ve
prospered significantly. Our growth
Southwest is strategy is designed to be both
prudent and profitable. And that
#1 in 25 of the strategy remains intact today with the
opportunities we have in front of us.1”
top 50 metro areas – Tammy Romo, Executive Vice President
and Chief Financial Officer
in market share.8
2016 Southwest Airlines One Report™ 28About this Report Performance People Planet GRI Content Index
International Expansion
Southwest Customers can now fly to eight countries in
Latin America and the Caribbean. Our international markets
represented approximately 3 percent of our total network
capacity3 in 2016. We provided service to Latin America In 2016, we
provided service
and the Caribbean from 13 gateway airports in the
48 contiguous states.
In August 2016, the Air Transport Agreement between the
United States and Mexico was approved. In December, we
to Latin America
became the first U.S. carrier to launch new service between
the two countries pursuant to this agreement, with flights and the Caribbean
from Los Angeles International Airport (LAX) to Cancun,
Puerto Vallarta, and San Jose del Cabo/Los Cabos (Cabo). from 13 gateway
We also began scheduled daily international service from
Ft. Lauderdale to Nassau, Bahamas and were excited to add airports in the 48
Cuba to our route map in late 2016, with daily service to
three destinations: Varadero, Havana—our 100th destination
served, and Santa Clara.
contiguous states.
2016 Southwest Airlines One Report™ 29About this Report Performance People Planet GRI Content Index
International Gateways & Destinations
(as of February, 2017)
MILWAUKEE
CHICAGO
OAKLAND (MIDWAY) BALTIMORE/WASHINGTON (BWI)
DENVER
LOS ANGELES (LAX)
ORANGE COUNTY
ATLANTA
AUSTIN
ORLANDO
HOUSTON (HOBBY)
SAN ANTONIO TAMPA
FT. LAUDERDALE (MIAMI AREA)
NASSAU
VARADERO
SAN JOSÉ DEL CABO/LOS CABOS SANTA CLARA
HAVANA
PUNTA CANA
PUERTO VALLARTA
CANCÚN
MONTEGO BAY
BELIZE CITY
MEXICO CITY
ARUBA
LIBERIA SAN JOSÉ
International service from Oakland began in February 2017.
International service from San Diego is expected to begin
in April 2017, representing our 15th gateway airport.
2016 Southwest Airlines One Report™ 30About this Report Performance People Planet GRI Content Index
¡Bienvenidos a Cuba!
Last year we launched our highly anticipated
new Southwest service to the “Pearl of the
Caribbean”: Cuba.
We’re delighted to provide our Customers with the Cuba
air service they want. Our application to the Department of
Transportation to begin flying to Cuba was backed by more
than 120 organizations, with more than 25,000 signatures
supporting the petition. “Traveling on the inaugural flight to
We said ¡HOLA! to Cuba with a flight from Ft. Lauderdale to Havana was surreal. It was a special
Varadero on Nov. 13, 2016. It was one of the first regularly and historic trip, both for me personally
scheduled commercial flights between the U.S. and Cuba in and for our Company. The Cuban
more than 50 years, and we were excited to be part of history! people were so incredibly warm and
Onboard, the Passengers and Crew donned Cuban-style
welcoming, and the level of excitement
fedoras while an orchestra in the terminal played Caribbean
music. There was even a drumroll by renowned bandleader
on the short plane ride was off the
Tito Puente, Jr. charts. It was a once-in-a-lifetime
experience, and one that I’ll
In December, we began service to Havana, our 100th never forget.”
destination served. As both the capital and the largest city in
Cuba, Havana is unique among its Cuban peers, with more – Chris Mainz, Senior Advisor
of everything—more beaches, more museums, more history, Communication & Outreach
more culture, and more vintage American cars. Our service
to Santa Clara, Cuba began shortly thereafter.
2016 Southwest Airlines One Report™ 31About this Report Performance People Planet GRI Content Index
Looking Forward
1
New Reservation
System
Expanded In May 2017, we plan to transition Launch
Destinations
to a single reservation system on
Amadeus’ Altéa reservation solution
737 MAX 8
for both domestic and international The Boeing 737 MAX 8 is scheduled
We’re planning to launch service
reservations. This new reservation to begin flying in October 2017,
to Cincinnati/Northern Kentucky
system is expected to generate following the retirement of all
International Airport in June 2017.
an improvement in EBIT21 of Boeing 737-300 aircraft by the end
approximately $500 million by 2020 of the third quarter.
through added functionality and
operational capabilities.
New Ft. Lauderdale
Service
In June 2017, we expect to begin
flying from the new five-gate
international concourse at Ft.
Lauderdale-Hollywood’s Terminal 1,
with new service to Belize City, Belize;
Cancun, Mexico; Montego Bay,
Jamaica; and Grand Cayman, our 15th
international destination.
2016 Southwest Airlines One Report™ 32About this Report Performance People Planet GRI Content Index
Performance Data Table
(Dollars in millions except per share amounts, unaudited)
Consolidated Highlights
Year End Year End
Dec. 31, 2016 Dec. 31, 2015 Change
Operating revenues $ 20,425 $ 19,820 3.1 %
Operating expenses $ 16,665 $ 15,704 6.1 %
Operating income $ 3,760 $ 4,116 (8.6) %
Operating margin 18.4 % 20.8 % -2.4 pts.
Net income $ 2,244 $ 2,181 2.9 %
Net margin 11.0 % 11.0 % —
Net income per share, basic $ 3.58 $ 3.30 8.5 %
Net income per share, diluted $ 3.55 $ 3.27 8.6 %
Stockholders' equity $ 8,441 $ 7,358 14.7 %
Return on average stockholders' equity 28.4 % 30.9 % -2.5 pts.
Stockholders' equity per common $ 13.72 $ 11.36 20.8 %
share outstanding
Revenue passengers carried 124,719,765 118,171,211 5.5 %
Revenue passenger miles (RPMs) (000s)15 124,797,986 117,499,879 6.2 %
Available seat miles (ASMs) (000s)3 148,522,051 140,501,409 5.7 %
Passenger load factor11 84.0 % 83.6 % 0.4 pts.
Passenger revenue yield per RPM (cents)12 14.90 15.57 (4.3) %
Operating revenue yield per ASM (cents)2, 4 13.75 13.98 (1.6) %
Operating expenses per ASM (cents)7 11.22 11.18 0.4 %
Aircraft at yearend 723 704 2.7 %
Active, full-time equivalent Employees 53,536 49,583 8.0 %
at yearend22
2016 Southwest Airlines One Report™ 33About this Report Performance People Planet GRI Content Index
Reconciliation of Reported Amounts
to Non-GAAP Items2
(Dollars in millions except per share amounts, unaudited)
Expenses
Year End Year End
Dec. 31, 2016 Dec. 31, 2015
Fuel and oil expense, unhedged $ 2,827 $ 3,362
Add: Fuel hedge (gains) losses included 820 254
in Fuel and oil expense, net
Fuel and oil expense, as reported $ 3,647 $ 3,616
Add: Net impact from fuel contracts 202 323
Fuel and oil expense, non-GAAP (economic) $ 3,849 $ 3,939
Total operating expenses, as reported $ 16,665 $ 15,704
Deduct: Union contract bonuses (356) (334)
Add: Net impact from fuel contracts 202 323
Deduct: Acquisition and integration costs — (39)
Add: Litigation settlement — 37
Deduct: Asset impairment (21) —
Deduct: Lease termination expense (22) —
Total operating expenses, non-GAAP $ 16,468 $ 15,691
Deduct: Fuel and oil expense, non-GAAP (3,849) (3,939)
(economic)
Operating expenses, non-GAAP, $ 12,619 $ 11,752
excluding Fuel and oil expense
Net Income
Year End Year End Year End Year End Year End
Dec. 31, 2016 Dec. 31, 2015 Dec. 31, 2014 Dec. 31, 2013 Dec. 31, 2012
Net income, as reported $ 2,244 $ 2,181 $ 1,136 $ 754 $ 421
Deduct: Special revenue adjustment — (172) — — —
Add: Union contract bonuses 356 334 9 — —
Add (Deduct): Mark-to-market impact from 9 373 251 (103) (221)
fuel contracts settling in future periods
Add (Deduct): Ineffectiveness from fuel (11) (9) 5 11 42
hedges settling in future periods
Add (Deduct): Other net impact of fuel (197) (251) 24 87 (10)
contracts settling in the current or a prior
period (excluding reclassifications)
Add: Acquisition and integration costs — 39 126 86 183
Deduct: Litigation settlement — (37) — — —
Add: Asset impairment 21 — — — —
Add: Lease termination expense 22 — — — —
Add (Deduct): Income tax impact of fuel (74) (103) (154) (30) 2
and special items23
Net income, non-GAAP $ 2,370 $ 2,355 $ 1,397 $ 805 $ 417
2016 Southwest Airlines One Report™ 34About this Report Performance People Planet GRI Content Index
Net Income per Share, Diluted
Year End
Dec. 31, 2016
Net income per share, diluted, as reported $ 3.55
Deduct: Impact from fuel contracts (0.31)
Add: Impact of special items 0.63
Deduct: Income tax impact of fuel (0.12)
and special items23
Net income per share, diluted, non-GAAP $ 3.75
Operating Revenues
Year End Year End
Dec. 31, 2016 Dec. 31, 2015
Operating revenues, as reported $ 20,425 $ 19,820
Deduct: Special revenue adjustment 2
— (172)
Operating revenues, non-GAAP $ 20,425 $ 19,648
Non-GAAP Return on Invested Capital (ROIC)
Year End Year End
Dec. 31, 2016 Dec. 31, 2015
Operating income, as reported $ 3,760 $ 4,116
Special revenue adjustment — (172)
Union contract bonuses 356 334
Net impact from fuel contracts (202) (323)
Acquisition and integration costs — 39
Litigation settlement — (37)
Asset impairment 21 —
Lease termination expense 22 —
Operating income, non-GAAP $ 3,957 $ 3,957
Net adjustment for aircraft leases 24
111 114
Adjustment for fuel hedge accounting 25
(152) (124)
Adjusted Operating income, non-GAAP (A) $ 3,916 $ 3,947
Debt, including capital leases26 3,304 2,782
Equity26
7,833 7,032
Net present value of aircraft 1,015 1,223
operating leases26
Average invested capital $ 12,152 $ 11,037
Equity adjustment for hedge accounting25 886 1,027
Adjusted average invested capital (B) $ 13,038 $ 12,064
Non-GAAP ROIC, pre-tax (A/B) 30.0% 32.7%
2016 Southwest Airlines One Report™ 35About this Report Performance People Planet GRI Content Index
People-Centric,
and Proud of It
Key Accomplishments 37 Nothing is more important to us than People,
Employees 38 whether we’re providing our Employees with
Customers 48
a workplace that honors diverse points of
Communities 51
Looking Forward 60 view, keeping safety top-of-mind, serving our
People Data Table 61 Customers, or striving to make the communities
we serve better places for the people who live
there. Our Heart is devoted to taking care of
others because we’re more than an airline—
we’re your neighbor.
2016 Southwest Airlines One Report™ 36About this Report Performance People Planet GRI Content Index
KEY ACCOMPLISHMENTS
We served more than
124M
Southwest Customers
Nearly 2M
Nearly 2 million hours spent
in training and education
programs by our Employees.
$25M+
We gave more than $25 million
in monetary, in-kind, and ticket
donations to nonprofit organizations
in our communities.
2016 Southwest Airlines One Report™ 37About this Report Performance People Planet GRI Content Index
KEY TOPIC
KEY TOPIC
Employees
At Southwest, Employees are given the same concern, respect, and caring attitude within the
organization that they are expected to share externally with every Southwest Customer. We
encourage creativity and innovation from all Employees as the best way to deliver our legendary
Customer Service and Hospitality. We’re committed to treating Employees fairly and to providing
a nurturing work environment that helps them learn and grow. After all, when you put your
Employees first, your Customers feel the effect.
$586
million
earned in profitsharing
85%
of Employees are proud
to work for Southwest
Sharing Our Profits Proud Employees
Employees earned $586 million in profitsharing for 2016. Percentage of Employees surveyed who said they are
proud to work for Southwest in our 2016 Employee survey.
STORIES
Engaged Employees A Snapshot of Flight Attendants Southwest Employees
Boost Teamwork Southwest Employees Become Galley Designers Go Hollywood
Investing in Our Future, Where People of Diverse Spreading the Planet Message
Training the Southwest Way One Employee at a Time Backgrounds Can Soar
2016 Southwest Airlines One Report™ 38About this Report Performance People Planet GRI Content Index
Engaged Employees Boost Teamwork
Southwest urges all Employees to be passionate Team military leave. A special group of Employees called Internal
Players, to avoid taking themselves too seriously, and Customer Care makes a point to recognize Employees who
to do their best work every day. Our 2016 Employee survey are experiencing these events through cards and letters,
showed overall Employee Engagement was 78 percent. gifts, and personal phone calls. Last year, they reached out to
Of the Employees who took the survey: 14,466 Employees at least once. This equated to more than
25 percent of our workforce!
• 85 percent are proud to work for Southwest
It’s all part of taking care of People and embracing our
• 84 percent would recommend Southwest as an Southwest Family.
airline to fly
• 83 percent think Southwest is a good corporate citizen
• 82 percent believe People of diverse backgrounds can
succeed at Southwest
Our 2016 Employee
• 79 percent would recommend Southwest as a
good place to work
survey showed overall
• 79 percent are satisfied with their jobs engagement at
As a Company with a Heart, we know our Employees have a
lot that goes on outside of work. We like to recognize their
Southwest of 78%.
important life events including marriages, births, adoptions,
graduations, illnesses or accidents, deaths, and Employee
2016 Southwest Airlines One Report™ 39About this Report Performance People Planet GRI Content Index
A Snapshot of Southwest Employees
It takes a great Team to keep us flying. Here’s a closer look at our talented and diverse group of more than 53,000 Employees.
Breakdown of Employees by Work Group and Gender22, 27
Flight
Maintenance
22,133
2,951
43% 57%
Female Male
Administrative
Ground, Customer,
(Technology, Management,
and Fleet Services
Finance, Marketing,
Clerical Personnel) 19,497
8,955
13.9%
of Employees (more than 7,400)
have reported being active duty
military/veterans
2016 Southwest Airlines One Report™ 40About this Report Performance People Planet GRI Content Index
Flight Attendants Become Galley Designers
When we decided to change the galleys in our
new Boeing 737-800 airplanes to make them
better suited to our unique service model,
we went straight to the experts: the Frontline
Southwest Employees who work onboard our
planes. After all, no one knows more about
galleys than the Employees who work in them
every day.
“One thing that made the galley project
Following a “Design Your Own Galley” contest, 10 Flight so successful was that Senior Leaders
Attendants and a Provisioning Agent became the design empowered Employees to build their
Team for the new galleys. We tasked them with creating the own work areas. We couldn’t have
most superb onboard experience in the industry while still done it without support from the top
maintaining our Southwest Brand and superior style to find a better way.”
of service.
– Jamie Willard, Inflight Operations Director
One big issue was the way the galleys were configured. of Safety Standards and Regulatory Compliance
“Of the four Flight Attendants flying the -800, three were
stationed at the aft galley with one at the front,” explained
Jamie Willard, Southwest’s Inflight Operations Director of
Safety Standards and Regulatory Compliance, who oversaw
the project. “This resulted in a cramped space and inefficient
workflow for the Flight Attendants in the aft galley.”
2016 Southwest Airlines One Report™ 41About this Report Performance People Planet GRI Content Index
For the first six weeks, the Design Team met almost weekly,
putting ideas on paper and white boards. The Employee-
based Team started by reconfiguring the galleys to have
two Flight Attendants stationed in each one, which means
In the newly
better service for Southwest Customers. “The Design Team
looked at every detail,” said Jamie. “For example, because configured 737-800,
we serve with trays, Flight Attendants must be able to
access product quickly and are constantly in and out of the
galley compartments. So the Team incorporated special
there are now two
doors and latches that are not found in a standard galley.”
Flight Attendants in
each galley, which
In May 2016, after more than three years of work, the first
737-800 with the new galley entered service. The galleys
will also be part of Southwest’s new 737 MAX 8 airplanes.
“One reason the galley project was so successful was
that Senior Leaders empowered Employees to build their
makes them much
own work areas,” said Jamie. “We couldn’t have done it
without support from the top to find a better way.” And,
more efficient places
of course, we couldn’t have done it without the dedication
of our Employees, who always find a way to do more than to work.
asked—and do it for the satisfaction of knowing they helped
improve Southwest service.
Employees take stock
of our new galleys.
2016 Southwest Airlines One Report™ 42About this Report Performance People Planet GRI Content Index
Southwest Employees Go Hollywood
Those actors in our new TV commercials aren’t When it came time to be in front of the camera, “The director
told us to have fun with it, to just rock out. So we did.”
really actors. They’re Southwest Employees,
and their enthusiasm reflects our Fun-LUVing Roy saw the commercial for the first time at home with his
family. “It was hilarious,” he said. “As soon as they saw it, they
Attitude like no actor ever could.
just burst out laughing. I told them, ‘You didn’t need to laugh
that hard!’”
Guillermo Rosales, San Diego-based Customer Service Agent,
was one of nine Southwest Employees lip-syncing to popular The other commercials in the campaign feature Employees
songs in our new Yes! television commercials, and it would be including Flight Attendants, Customer Service Agents, Ramp
difficult to make a better casting decision. “I really wanted to Agents, and a Pilot. The results were clear examples of how
act again,” said Guillermo, who acted and played in a band in the Southwest family brings enthusiasm to all that it does.
his late teens.
“I’ve always had a creative side, so I’m very blessed for the
opportunity the Company gives us to do something that we
have the passion and talent for,” Guillermo said, adding that
Customers often recognize him from his appearance in the
commercials. “They see me and call out, ‘Hey Hollywood,’”
he said, laughing.
A Southwest Employee for 17 years, Guillermo said seeing the
commercial for the first time was a thrill. “I couldn’t believe
how cool the production was,” he said, adding that he’s “The director told us to have fun with it,
available for future shoots. “Oh, yeah,” he said. “I’m ready.” to just rock out. So we did.”
Fellow Southwest Employee Roy Nabors, who has worked – Roy Nabors, Ramp Agent, Chicago Midway
as a Ramp Agent at Chicago Midway for eight years, joined
Guillermo on the commercial. Roy’s daughter shot his
audition video, and “They loved it,” according to Roy.
2016 Southwest Airlines One Report™ 43About this Report Performance People Planet GRI Content Index
Training the Southwest Way
At Southwest, we provide an array of training options to skills and Company knowledge, and look for opportunities
help every Employee gain valuable skills and knowledge. to promote from within.
That makes them better Employees and makes Southwest
To help Employees better understand the development
a stronger company.
opportunities that are available to them, in 2016 SWA U
One of our major training resources is Southwest Airlines launched a new internal website that describes its many
University (SWA U). In a state-of-the-art training facility, personal and professional education programs.
SWA U offers technical training and personal and professional
In 2016, we invested more than $100 million in training,
development opportunities. It provides a centralized location
including construction costs for the new Flight Training
for Employees to learn in realistic environments and practice
Center at Headquarters and travel expenses for Employees
on-the-job skills, with everything from a cabin simulator for
attending training.
Flight Attendants to Leadership training for Managers. We
also encourage movement around the Company to increase
2016 Employee Training Hours
1,953,705 hours 811,717
in training & education, systemwide
Safety & Security
training hours for
Roy Nabors, Ramp Agent, Chicago Midway
all Employees
Ground Pilots Flight Customer Support Maintenance
Operations Attendants and Services
730,088 457,563 443,295 175,447 147,312
2016 Southwest Airlines One Report™ 44About this Report Performance People Planet GRI Content Index
Investing in Our Future, One Employee at a Time
To give our Employees opportunities to gain the knowledge
and expertise they need to help build the future of Southwest,
we introduced a Tuition Reimbursement Program in 2016
that provides opportunities for professional development, Tuition
continuing education, and skills training.
Reimbursement
Through this benefit, full-time Employees may be eligible for
up to a $5,000 reimbursement annually for graduate degrees
Eligible Employees can receive:
and a $2,500 reimbursement annually for undergraduate
degrees and certifications.
“Finding out about the new Tuition Reimbursement Program
was the best news ever, because it meant I won’t need a
student loan to finish up my education,” said Carolina Sierra,
$5,000
annually for graduate degrees
Orlando Station Services Coordinator.
“As a first-generation college student, it is an honor to
represent my family, and I strive to make them proud,” said
Carolina. “Southwest is supporting this opportunity, allowing
me to continue my path to success by offering financial
$2,500
annually for undergraduate
support.”
degrees and certifications
“This benefit is a real life-changer for many of us and another
example of Southwest going the extra mile to take care of its
Employees,” said Carolina.
Tuition reimbursement is just one way we invest in our
Employees. We’re proud to offer a comprehensive Total
Rewards Package that includes profitsharing, retirement
plans, health, wellness, training, travel, and other benefits.
See a complete list of our benefits here.
2016 Southwest Airlines One Report™ 45You can also read


