Future Domestic Air Network Analysis Stage 1 - Proposal - Ministry of ...
←
→
Page content transcription
If your browser does not render page correctly, please read the page content below
Future Domestic Air Network Analysis
Stage 1
Proposal
Prepared for:
               New Zealand Airport Association
               Ministry of Transport

  Date:                     29/01/2016
  Contact Persons:

                   Lawrence McIlrath                                              Dave Park
                  Mobile: 021 042 9157                                     Mobile: 021 902 748

   Version                      Date                        Change
   First Draft                  14/07/2015
   Second Draft                 19/11/2015                  Comments received from NZ Airports via emails on the
                                                            21/09/2015 and 29/09/2015. Appendix 9 summarises
                                                            the comments and our response
   Final                        29/1/2016                   Final comments from NZ Airports via email
                                                            (19/01/2016). This amendments captures some final
                                                            comments from NZ Airports and the clarification of
                                                            some of our initial responses.

  Disclaimer
  Although every effort has been made to ensure accuracy and reliability of the information contained in this report,
  Market Economics Limited, Astral Limited nor any of their employees shall be held liable for the information,
  opinions and forecasts expressed in this report.

                                                                                              Market Economics Limited
                                                                                                 Level 5, 507 Lake Road
www.me.co.nz                                                                                  PO Box 331 297, Takapuna
                                                                                                     Auckland 0740, NZ
                                                                                                          P 09 915 5510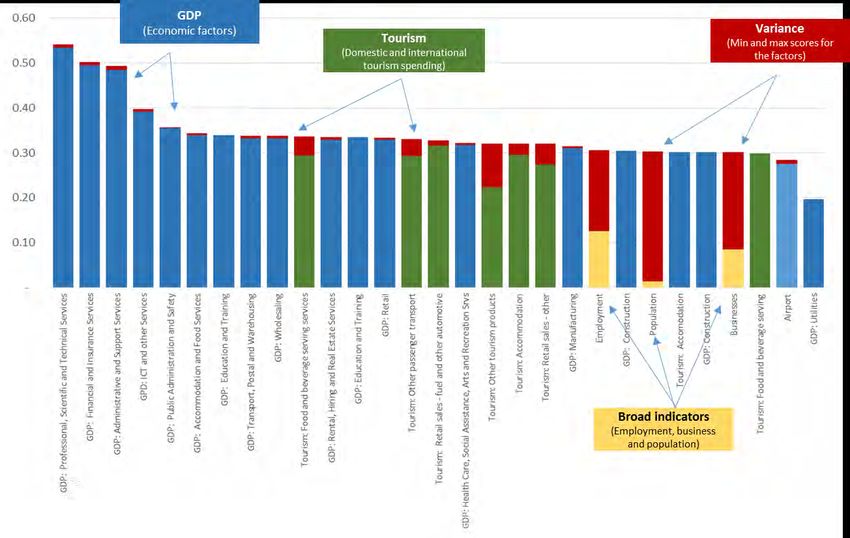
Commercial in Confidence

Executive Summary
New Zealand’s air transport network is a vital part of the economy. It facilitates a range of connections,
allowing people and cargo to move between different cities and towns. Economic, social and
technological trends are changing aviation and how it interacts with the wider business environment.
Understanding these forces, and the flow-on effects, is critically important when seeking to optimise the
domestic air network. This research is the first stage of an investigation into the future of New Zealand’s
(NZ) domestic air network. It seeks to identify the key issues affecting, and driving the network’s
performance. Market Economics Limited (M.E) and Astral Limited were commissioned to undertake the
first stage of this research.
The research used both quantitative and qualitative research techniques and the findings of these two
approaches were integrated to provide a detailed picture of the key relationships in the domestic air
network. These relationships were identified using statistical analysis techniques, particularly Factor
Analysis (FA). A diverse range of information sources were consulted, including: published information
(e.g. Statistics New Zealand), purchased information (e.g. Sabre® GDD), private information (e.g. airport’s
financial statements). This information was combined with interviews and surveys. All airports included1
in our study were invited to participate in the research. Some respondents requested confidentiality so
the results are presented in a way that limits the ability to identify specific respondents. With reference
to the airlines, we invited more than 10 of NZs airlines to participate in the study. Only a small number
of airlines replied so the airlines’ responses presented in this report should not be viewed as
representative of the airline industry per se.

CURRENT SITUATION
The current situation is describe in terms of airport infrastructure, routes flown and aircraft/fleet
characteristics and operating costs.
Airport Infrastructure
New Zealand is relatively well endowed with aerodromes. There are 175 aerodromes (of all types) listed
in the New Zealand Aeronautical Information Publication. This study has focused on those aerodromes
with schedule passenger services. It also includes some that have recently lost air services.

These aerodromes range from large international facilities such as Auckland International Airport Limited
(AIAL) through to small grass facilities such as Waiheke Island. The terminal capacity at the aerodromes
is generally matched to the types of aircraft providing services and their frequency of operation. Some
of the smaller aerodromes in our study did not have terminals at all. Generally, the runways are adequate
for all the typical in-service (and likely future) propeller powered regional aircraft. Only the very small
(10) aerodromes (runways shorter than 1,200m) are inadequate for larger turbo-prop aircraft that tend
to have favourable cost per seat characteristics ($/seat). These aerodromes are unlikely to grow
substantially in the near future or compete for additional schedule services from the major airlines.
For reliability of service in poor weather conditions, aerodromes require an instrument approach.
Previously, most general aviation aircraft and small airports were equipped for basic instrument

            1 The study included 37 airports and these were selected based on whether there was scheduled service operating
            from the airport or not.

                                                                                                                          i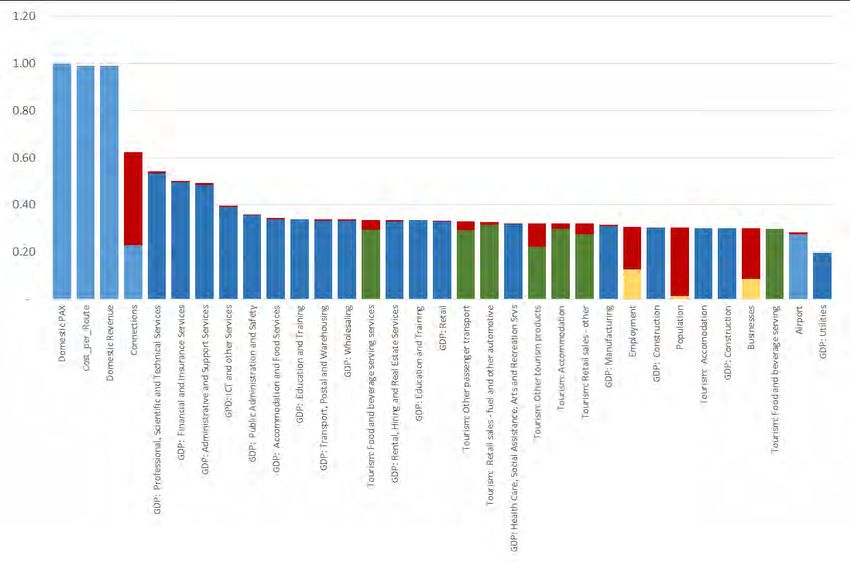
Commercial in Confidence
approaches. However, with the move to New Southern Sky (NSS), aircraft will eventually need to be
equipped for satellite based area navigation (RNAV) approaches. All but four of the aerodromes in this
study have RNAV approaches available. RNAV approaches do not require any ground based
infrastructure, at least for daytime operations. The cost and long term issues of availability of ground
based navigation aids under the NSS programme were highlighted as possible barriers to the
development of air services to small communities. The extent of possible barriers will depend on CAA's
decision on ‘sole means’ GPS based navigation which, at the time of writing has not been released.
Overall aerodromes reported their facilities to be currently adequate, although about 40% indicated
terminal expansion would be required in 5-10 years depending on the growth that is achieved. A small
number indicated that their facilities are currently under pressure and in need of investment to expand.
Lack of apron space, and the need to keep up with costly routine maintenance (such as resurfacing of
tarmac areas), were common themes reported in the survey.
Route Network & Airlines
The NZ domestic air transport network services most of regional New Zealand. It is possible to connect
between virtually all regional towns through the country using air travel (even if the connections are not
convenient). Air New Zealand (AirNZ) and JetStar services provide the core connections with the
smaller, geographically dispersed centres serviced by the independent operators. Around half (45%) of
domestic passenger movements occur between the hub2 airports, with almost half (52%) occurring
between the hub airports and the regional centres. Less than 5% of the total passenger movements take
place on the wider network (this includes the independent operators).
Clearly, the network is operated on a hub-and-spoke configuration with few non-stop, point-to-point
services between regional centres but good connections between regional centres and hub airports. This
pattern is typical of airline operations world-wide.
Air NZ and JetStar operate jets on the trunk routes. Below this, Air NZ operates the largest fleet of
regional aircraft. The independent operators operate 61 per cent of the fleet but they provide only 15
per cent of the available seating capacity. The most notable feature of the scheduled airline landscape
(excluding Air NZ and JetStar) is its fragmented nature. This group is characterised by:
Low fleet numbers and capacity per operator.
High average fleet age and lack of fleet renewal.
Narrow local area of scheduled operations.
No interline arrangements with major carriers.
No apparent strategic co-operation or partnerships between operators.
This situation has existed for many years and has resulted in the weak independent airline sector
apparent today. In our view, this situation has arisen, in part, due to the market dominance of Air NZ
whereby the independent operators have been relegated to smaller, niche routes. This may change with
Air NZ’s withdrawal from some regional routes. However, the financial resources that are/would be
required to take up the opportunities may limit independent airlines’ ability to capture them. These
operators are facing a number of challenges including:
2 Auckland, Wellington and Christchurch
ii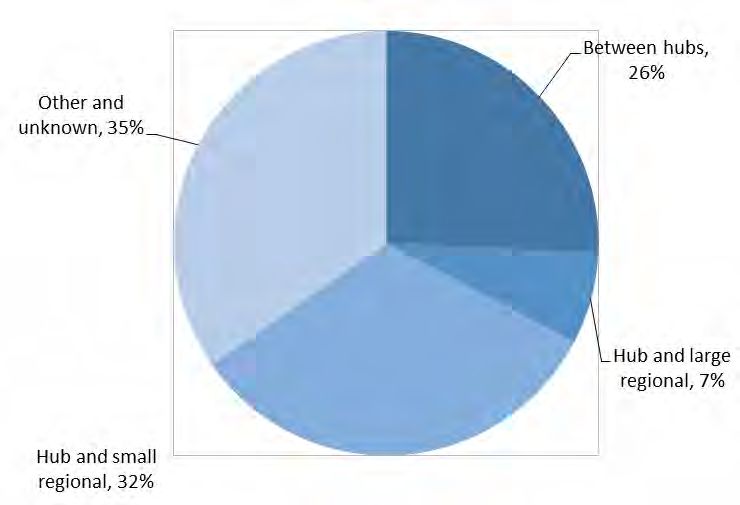
Commercial in Confidence
High per seat operating costs,
Lack of suitable aircraft,
Inadequate marketing, and
A combination of the above factors.
The independent operators use older aircraft due to the very low ownership costs and the high cost of
equivalent new/replacement aircraft. As aircraft utilisation is low for most independent operators the
higher costs of ownership of more modern aircraft are very difficult to cover.
Operating Costs (excluding jets)
Expressing operating cost3 in terms of seats (cost per seat) makes it possible to identify the cost
competitiveness of different aircraft. The overall observation is that smaller planes are more expensive
to operate on a per seat basis than the larger plans. The average cost per seat for three size categories
is:
20 Seats $95.60/seat/hour.
While larger planes (> 20 seats) are more expensive to operate with the average cost per hour coming in
at $4,725, the cost can be spread over more seats. Therefore, the larger planes can be up to 27.5% more
cost effective to operate than 10-20 seat airplanes. For example, an ATR72 is up to 67.7% more cost
effective to operate than a B1900 (on a per seat basis).
This cost difference has been influential in driving some of the recently announced route changes as it
has a substantial impact on the overall profitability. The following example highlights the potential
effect on route profitability4 of using different aircraft.
Example: Profitability effect of shift to a larger aircraft
Assuming a route has 50,000 passenger movements per year and that the fare is $160.
Using B1900s the overall profit potential is estimate at $78,000/year.
Using a Q300 with a reduced schedule (only 25,000 passenger movements) will return a profit
of $1.1m.
It is not always possible to shift to a larger airplane. Based on a high-level assessment of the general costs
of operating an aircraft, the minimum sector volume of around 35,000 passengers are needed for a 33
seat aircraft, increasing to between 45,000 and 55,000 for a 50-seat plane. However, the routes will need
to slot into the wider network to maintain effective aircraft utilisation.
3Excluding items such as insurance, offices, lease payments.
4In this example, the profit is the revenue (fare multiplied by the number of seats) less the operating costs. The
operating costs include the costs associated with ‘flying the plane’ and other variable fees. It excludes fixed airline
costs such as office, ticking systems, lease costs, insurances etc.
iii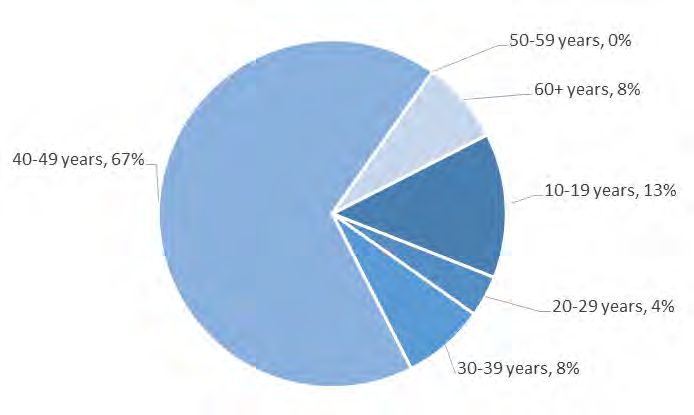
Commercial in Confidence
Travel time comparison
The cost of travelling is part of the decision making process when evaluating alternative transport modes
and different markets are influenced by different aspects. Leisure travellers tend to be price sensitive
whereas business travellers are more focused on the ‘time-savings’ and convenience. However, both
markets are price sensitive – business travellers will only travel if the benefit outweighs costs. Using a
scenario approach to compare the total costs of travelling from Rotorua to Auckland, we estimate the
cost differential between driving and flying at $102 (favouring flying) for the business market. This is
because the total travel time is around 5.7hours (by road) vs 2.2hours (by air). In addition, the business
traveller would ‘save 3.5 hours’ by travelling by air. For the leisure traveller, under a low-fare situation,
air travel is the cheapest option. If the number of people in the party travelling together increases (e.g.
a family), then travelling by road becomes the cheapest option. If there are four people travelling
together, then the cost difference is over $625 (air travel more expensive than travelling by road).
If this example is changed to reflect a situation where a person travels from Whakatane to Rotorua (to
travel to Auckland) then the total road travel cost is estimated at $865 (Whakatane-Auckland) and the air
travel (Whakatane-Rotorua by road and then fly to Auckland) costs is estimated at $665 – a $200
differential for a business person. This is the value of the travel but is likely to understate the ‘perceived
value’ of time to the business traveller meaning that there is likely to be a strong bias for the air travel
option.
UNDERLYING DRIVERS
Demand for air travel is determined by a number of factors ranging from local demographic features, the
local economy and the cost to service routes, to name a few. To identify the relative importance of these
and other factors, the team used a statistical tool5 to identify the unobserved relationships between 121
individual factors. These factors covered the following areas:
Passenger movements,
Population,
Economic activity,
Route economics
Airport features.
Following the analysis, the key factors were grouped into common themes. The resulting themes, or
drivers, include:
1) Route characteristics,
2) Connectivity (international and domestic),
3) Local economy and employment, and
4) Local population.
5 We used Factor Analysis
iv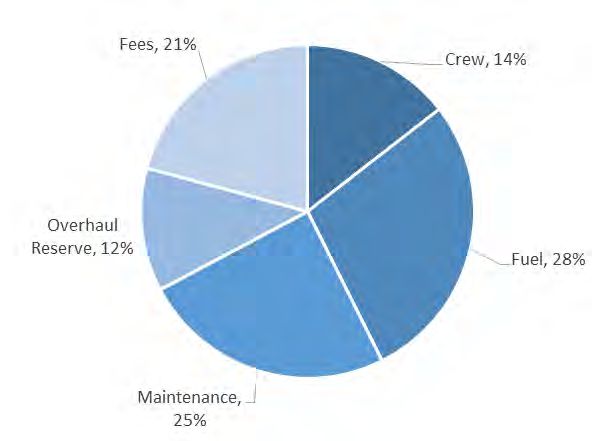
Commercial in Confidence
While the sequence of the drivers may vary slightly, these drivers are consistently identified irrespective
of the group6 of routes selected.
The first observation from the analysis is that the core driver of the route network is route characteristics
and airlines ability to return a profit on different routes. Route characteristics, as used here, relates to:
The number of passengers,
The cost of operating the aircraft, and
The total fare.
This suggests that the shape of the network is influenced by airlines’ activities in response to the market
conditions. Airlines will focus their efforts on routes where they can operate profitably. Essentially, this
driver encapsulates an airline’s ability to generate profit on a particular route (group of routes, network)
based on the characteristics of that route (i.e. the passenger demand, type of plane it can operate and
the asking price it can charge for a seat).
The second driver relates to connectivity – that is the number of direct and indirect connections that
can be made from the different airports. Around 11% of the international connections do not terminate
(or start) at the hub airports. This suggests that that the domestic air network enables important linkages
for NZ’s regions to access international connections. This also implies a level of connectedness between
the domestic and international services.
The regional economy and the associated employment base is the next driver. In essence, this driver
highlights the role of the domestic air network in linking parts of the NZ economy. Our analysis suggests
that the size and structure of the local economy is a key determinant of air transport activity. It is not
only the size of the economy, but also the relative size of business service type activities (and similar
sectors) that influences demand for air travel between regions. Interestingly, the economic and
employment factors are more important than total population size. This suggests that interregional
economic connections and trade are important drivers of air travel between city/town pairs. Other
important relationships that were identified include:
There is a positive relationship between a region’s service and knowledge based sectors7 and
movements to, and from, that region. This implies that the air transport linkages are likely to
be to areas with ‘high value economies’ and not necessarily to high ‘employment’ areas.
With regard to air travel between regions, the sizes of primary sector activities (agriculture,
forestry and mining) and utilities (e.g. electricity), do not have a strong influence on overall
travel demand (relative to knowledge-based sectors). This suggests that these types of activities
do not necessarily generate a large demand for air transport.
Regional tourism spending is an important factor (domestic and international spending are
both important).
There is a relationship between domestic air movements (passengers) to a region, and the size
of a region’s accommodation and food service sector (in GDP terms). This underscores the air
networks relationship with domestic tourism.
6All the routes combines or the routes excluding the trunk routes.
7Public administration and safety, professional, scientific and technical services, financial and insurance services, health care,
social assistance, arts and recreation services, and administrative and support services
v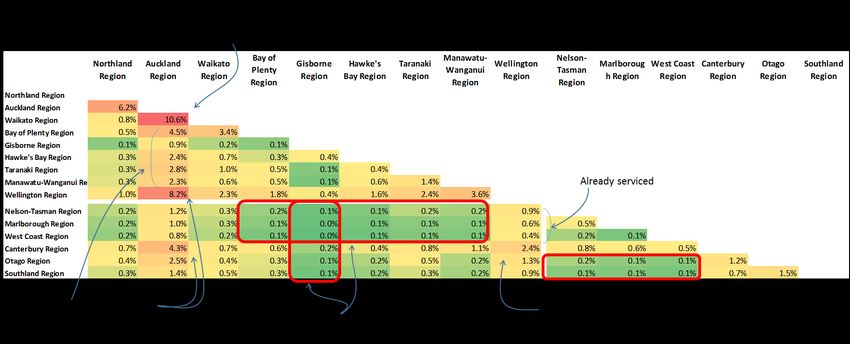
Commercial in Confidence

The final driver is population. The low position of this driver compared to the other driver has a number
of underlying causes that can be linked back to the different air travel markets e.g. leisure/personal or
business. The business market is related to the economic sectors and GDP as discussed above. Personal
travel is influenced by, amongst other things, the willingness and ability to pay. In turn, this is a function
of household income, which is affected by economic activity. In other words, households’ ability (and
willingness to pay for airfares) to travel by air is directly influenced by the size and structure of the local
economy, not simply how many people live in an area.

OUTLOOK FOR THE NEXT 5 YEARS
The outlook for the next 5 years is summarised below. This outlook is based on the movements that are
expected for the main drivers identified above. We see the outlook for the domestic air network as
follows:

ROUTE CHARACTERISTICS
Air NZ and JetStar have both made a number of announcements about the level of service and we expect
that there will be strong market activity as these players position themselves on the key regional routes.
Air NZ has rationalised some routes, and JetStar is entering some regional routes. The entry of JetStar
into the domestic regional-to-hub market will offer travellers a choice of airlines. The JetStar codeshare
arrangements with the Qantas/OneWorld and Emirates networks should make those services attractive
to travellers beyond New Zealand due to the additional access to international connections that will be
offered. In the short term, JetStar’s entry will lead to aggressive competition on the relevant routes. In
the long term, prices will trend towards the average (sustainable) levels.
The recent changes announced by Air NZ to migrate its fleet to a larger platform, is introducing a range
of changes at the regional level. Moving to a larger platform (Q300 vs Beach 1900) means that scheduling
will change – less frequent services so reducing choice. Travellers are likely to respond by shifting their
travel behaviour to match the new servicing schedules. The may be a small decline in overall demand
due to a reluctance to change. Some smaller routes will also be dropped from the network (i.e. route
rationalisation). We anticipate that once this current round of change has been introduced, that the
network would remain relatively stable in the near term.

With reference to regional services where Air NZ has signalled its exit, we anticipate the emergence of a
regional service(s) on those routes. This will be most likely be offered by independent operators. The
long-term sustainability of those routes, and the operators, are questionable if current price-demand
patterns hold. If the independent operators can increase fares while maintaining sufficient loads, then
those routes should remain viable over the short to medium term. History has shown the challenges
associated with the smaller, regional routes with attempts to set up competing airlines, servicing the
regional routes failing over time. In addition, Air NZ’s moves to larger aircraft (with lower cost per seat
characteristics) means that it can offer lower fares on the competing routes8.

            8   This relates to the ‘drive and fly routes’ such as Whakatane-Rotorua drive and then fly to Auckland option.

                                                                                                                              vi
Commercial in Confidence
Currently there is little competition between airlines on the small routes e.g. Cook Strait routes and
to/from Great Barrier Island. This situation is expected to remain a feature of the regional air network.
Airport developments
The development cycle of regional airport facilities seen in the period 1990-2012 appears to now be at,
or nearing an end, except possibly for Queenstown airport. During this period a number of regional
airport runways were extended to accommodate 737-300 and later 737-800/A320 aircraft. Major
development plans are largely confined to the international airports, Auckland, Wellington, Christchurch
and Queenstown. As the domestic regional air transport network, outside the trunk routes is entirely
operated by turbo prop or piston propeller aircraft the aerodrome infrastructure are much less than is
required with jets. For this reason, it appears likely regional services will remain turbo-prop or piston
for the next 5 years at least. This means that the route economies are unlikely to change materially over
the short term.
INTERNATIONAL CONNECTIONS
While the world economy is in better shape than it was 4 to 5 years ago, there are a number of challenges
to be faced. The NZ tourism market (and the international connections) is subject to global economic
conditions. As economic activity improves (or deteriorates) so too does the number of people deciding
to travel on long haul tourist visits.
New Zealand’s international tourism market has seen some very strong growth since the Global Financial
Crisis with visitor arrivals up 5.3% (year-on-year until December 2014). The number of visitors from China
continues to grow. According to the MBIE, the outlook for international tourism is positive but it is
tempered by risks such as a potential slowdown in Europe (e.g. Greek issues) a slowdown in the Chinese
economy and security issues. Nevertheless, the consensus forecast is for international visitor arrivals to
continue to grow at around 4% per year. This outlook is supported by soft global oil prices, international
airlines adding flights to NZ and a strong dollar.
This positive outlook will flow through to opportunities to build and develop the visitor attractions (and
products) at the regional levels. Given that international connections account for over 10% of the traffic
on the domestic network, growth in the international connections is likely to spill over and affect the
domestic network.
REGIONAL ECONOMIES & DOMESTIC CONNECTIONS
Most regions have detailed economic growth and development plans and central government is also
supporting some regions to develop growth plans and strategies. Many of NZ’s regional economies are
resource-based (primary sectors/agriculture) and the regions are seeking to grow these key sectors while
also attempting to diversify (to reduce economic risks). In some cases, the airports and air connectivity
are viewed as a key part of the economic landscape and future prosperity. This suggests that from a
regional perspective, it is likely that regions will continue to ‘value’ their airports.
viiCommercial in Confidence
In terms of the regional economic outlook, most regions have seen a drop off in confidence. This is mainly
because of weak agricultural commodities prices. If the weak prices and downbeat outlook persist, then
this will invariable spill over into regional economic performance. In turn, this is likely to suppress
growth in demand for air travel from the regional centres. On the positive side, there are some sources
of growth. The historically strong growth in immigration is likely to continue to support growth and
development in Auckland. Low interest rates will also support business and economic activity in Auckland
and the rest of the country. Rebuilding Christchurch will also continue to support economic activity even
if the rebuild is peaking. Overall, the outlook for the regional economies around NZ is mostly on the
upside with average growth expected in the short term. For the domestic air network, this implies that
it is unlikely that there will be a ‘step-change’ in the growth profile. Instead, historic (long-term average)
growth levels are expected.
The main urban centres, Auckland, Christchurch and to some extent Wellington, are currently in a strong
positions. In the short term, this is likely to support travel demand growth to and from these cities as
their growth is being driven by immigration, construction and the rebuild.
With reference to domestic connections, one possible driver of ‘new routes’ between regions is the level
of trade between regions (not currently serviced by point-to-point services). Our analysis suggests that
the distribution of interregional (between-region) trade9 matches passenger movements on the domestic
air network. There is a link between interregional activity and air traffic between those regions but this
is also influenced by distance. This means that the demand for new point-to-point services between the
smaller economies is likely to be limited. We do not expect any ‘new point-to-point services’ to emerge
in the next 5 years or so. If any new routes emerge, they are likely to be approached in a cautious manner.
Population
Population is strongly correlated with economic activity. According the Statistics New Zealand, the
country’s population is projected to grow from the current 4.5m to between 4.7m and 4.8m by 2020.
More than half of the growth is expected to occur in Auckland and around 16% of the growth is expected
in Canterbury. This is followed by Waikato and then Wellington.
Immigration is likely to remain a key source of population growth over the short term. The historic
pattern of migrants settling in the large cities is likely to remain. Therefore, the demand for air travel is
likely to remain associated with the key centres.
It is important to notice the uneven nature of the growth outlook – i.e. concentrated in the large cities.
The implications for air travel demand are that, over the short term, the routes connecting the large
centres will continue to experience growth. The routes associated with the medium size cities
connecting to the hub cities are expected to show expand in line with the growth in the service sectors
in the regional towns. However, connections to the smaller regions are likely to suffer from low growth.
9 As measured using intermediate demand between NZ’s 16 regions.
viiiCommercial in Confidence
CONCLUSION
Apart from the two high profile changes (Air NZ stopping some services and JetStar’s entry into regional
routes), it is difficult to see any significant changes in the regional turbo-prop services fleet.
The current hub-and-spoke configuration of the network is likely to remain in place:
Most of the growth on the network is likely to be concentrated on the main truck routes.
At the second level (the ‘spokes’), the outlook for these segments is somewhat varied and will
depend on the economic fortunes of individual regions.
The third level (regional, point-to-point services) can at best be explained as marginal and these
routes will face difficult trading environments. These routes are delivering value to the regional
economies because they are connecting the small regions with other economic regions. The
low margins on these routes mean that the independent operators are finding it difficult to
renew and upgrade their fleets. This may become an issue in the future.
Potential Policy Questions
In the next five years, there are likely to be a number of areas that will require attention. These areas are
associated with the overall network and its performance. These include:
Network configuration: The airports are expensive infrastructure enabling the overall network
and it is necessary to define a long-term vision for NZ’s airports, highlighting the optimal
network configuration. In this context, optimal relates to the balance between regional ‘wants’,
‘needs’ and ability to pay for airport facilities. Where there is a mismatch between the need for
facilities and regional financial capability, alternative funding mechanisms will need to be
explored.
How to grow passenger volumes – Airlines and airports have different views about how best to
stimulate growth. Airports tend to focus on the infrastructure and terminal development where
the airlines focus on destination market. The means that there are a number of policy questions
in this area, including:
o What is the role of airports to deliver a high quality tourist experience?
o What is the role of airlines in informing planning for infrastructure expansion and
development activities?
Sector collaboration – there may be some (small) opportunities to develop specific point-to-
point services. These services are likely to be driven by specialist, cross-region collaborative
opportunities. It is currently not known what these opportunities are, or what needs to be done
to unlock them.
Airfreight – there is a general information gap about the flow of airfreight around the country.
This is a known gap and it would add to the understanding of air transport’s role in economic
development and activity if this gap was addressed.
Financial health and sustainability – over the longer term, some of the smaller airports are
likely to face financial pressures. This will lead to questions about the need for, and viability of,
the airports. Stakeholders are likely to assess the effects and impacts of airports by asking
questions such as ‘who pays for the airport?’ and ‘who benefits from the airport?’ These are
important questions as they can be used to inform where the funding/financing burden should
fall.
ixCommercial in Confidence
‘Invisible’ uses – the air transport network and airport network enables a range of other public
services such as patient transfers and emergency services to be delivered. If the airport
network’s configuration changes then health and emergency service providers’ ability to
provide services is impacted. It is necessary to understand these relationships as part of any
discussion about the future network configuration.
Improving the performance of independent operators – the independent operator sector is
delivering important linkages across and between regional NZ. The potential role of this sector
in the wider network, its growth potential, role and measures needed to lift its performance will
need to be understood.
Airports and air travel by themselves are key parts of regional economies, contributing to, and supporting
economic growth and competitiveness. However, airport assets are expensive and they need to be
actively managed and integrated into regional development activities to ensure that the maximum value
is derived (returned) from these economic assets. From a regional development perspective, having an
airport and quality connections are important because it enables trade. However, just having an airport
is not a recipe for regional economic development success and prosperity
xCommercial in Confidence
Contents
1 INTRODUCTION ..................................................................................... 1
1.1 PROJECT OBJECTIVES ....................................................................................... 1
1.2 PROJECT APPROACH ........................................................................................ 2
1.3 AREAS COVERED ............................................................................................. 4
1.4 REPORT STRUCTURE ........................................................................................ 1
2 CURRENT SITUATION ............................................................................. 2
2.1 AIRPORT INFRASTRUCTURE................................................................................ 2
2.2 ROUTE NETWORK ........................................................................................... 5
2.3 FLEET CHARACTERISTICS.................................................................................... 8
2.4 RECENT ANNOUNCEMENTS ............................................................................. 14
2.5 OTHER CONSIDERATIONS ................................................................................ 16
2.6 CURRENT PERSPECTIVES ................................................................................. 20
2.7 CONCLUDING REMARKS ................................................................................. 24
3 UNDERLYING DRIVERS ......................................................................... 26
3.1 RELATIONSHIP WITH SURROUNDING AREAS ......................................................... 26
3.2 KEY DRIVERS ............................................................................................... 29
3.3 OTHER OBSERVATIONS ................................................................................... 34
3.4 POLICY LANDSCAPE ....................................................................................... 35
3.5 KEY POINTS ................................................................................................. 39
4 OUTLOOK FOR KEY DRIVERS ................................................................ 41
4.1 ROUTES CHARACTERISTICS............................................................................... 41
4.2 CONNECTIONS ............................................................................................. 43
4.3 REGIONAL ECONOMIES .................................................................................. 45
4.4 POPULATION ............................................................................................... 47
4.5 CONCLUDING REMARKS ................................................................................. 49
5 CONCLUSIONS ..................................................................................... 51
5.1 HUB-AND-SPOKE STRUCTURE & COMPETITION .................................................... 51
5.2 FLEET, COSTS AND INFRASTRUCTURE ................................................................. 53
5.3 POTENTIAL POLICY QUESTIONS ........................................................................ 54
xiCommercial in Confidence
Figures
FIGURE 1-1: AREAS COVERED ................................................................................................................ 1
FIGURE 2-1: SHARE OF PLANES BY SEATS (EXCL. JETS) ................................................................................ 8
FIGURE 2-2: SHARE OF SEATS (BY PLANES SIZE; EXCL JETS) ......................................................................... 8
FIGURE 2-3: AGE DISTRIBUTION OF THE FLEET (EXCL AIR NZ AND JETSTAR) ................................................... 9
FIGURE 2-4: COST/AIRCRAFT TYPE (VARIABLE COSTS) .............................................................................. 12
FIGURE 2-5: DISTRIBUTION OF COST PER SEAT......................................................................................... 14
FIGURE 2-6: MEDICAL FLIGHTS (REGIONAL CONNECTIONS) ........................................................................ 17
FIGURE 3-1: EMPLOYMENT RELATIVE TO PASSENGER MOVEMENTS (LOG SCALE) ........................................... 27
FIGURE 3-2: POPULATION RELATIVE TO PASSENGER MOVEMENTS (LOG SCALE) ............................................. 27
FIGURE 3-3: PASSENGERS RELATIVE TO FIRMS......................................................................................... 28
FIGURE 3-4: FACTOR ANALYSIS – RESULT SUMMARY ............................................................................... 30
FIGURE 4-1: SHARE OF INTERREGIONAL TRADE BETWEEN REGIONS .............................................................. 47
FIGURE 4-2: NZ POPULATION PROJECTIONS ........................................................................................... 48
Table
TABLE 2-1: AERODROME FEATURES ........................................................................................................ 3
TABLE 2-2: SCHEDULED DOMESTIC AIRLINES ............................................................................................. 5
TABLE 2-3: TYPICAL AIRCRAFT VALUES AND REPLACEMENT COSTS. .............................................................. 10
TABLE 2-4: POTENTIAL COSTS (ROAD VS AIR TRAVEL) .............................................................................. 19
TABLE 3-1: KEY DRIVERS ..................................................................................................................... 31
TABLE 3-2: REGIONAL BREAKDOWN OF STARSHIP AIR AMBULANCE FLIGHTS (3 MONTHS) ............................... 38
xiiCommercial in Confidence
Appendices
APPENDIX 1: FACTOR ANALYSIS............................................................................................................ 57
APPENDIX 2: AIRPORTS INCLUDED IN THE STUDY ...................................................................................... 58
APPENDIX 3: DISTRIBUTION OF AIRCRAFT COSTS (VARIABLE) ..................................................................... 59
APPENDIX 4: TREND IN JET FUEL (NZ$ PER BARREL) ................................................................................ 60
APPENDIX 5: PROFIT POTENTIAL ON REGIONAL ROUTES BASED ON CURRENT FLEET USAGE ................................ 61
APPENDIX 6: FACTORS INCLUDED IN THE FACTOR ANALYSIS ....................................................................... 62
APPENDIX 7: FACTOR ANALYSIS RESULTS (INCLUDING ROUTE FEATURES) ..................................................... 63
APPENDIX 8: POPULATION GROWTH PROJECTIONS .................................................................................. 64
APPENDIX 9: RESPONSE TO COMMENTS ................................................................................................ 65
xiiiCommercial in Confidence
Abbreviations
ACC Accident Compensation Commission
ADS-B Automatic Dependent Surveillance
AIAL Auckland International Airport Limited
AIP Aeronautical Information Publication New Zealand
Air NZ Air New Zealand
ASK Available seat kilometers
ATC Air Traffic Control
ATCS Air Traffic Control Service
CAA Civil Aviation Authority
DHB District Health Boards
DTS Domestic Travel Survey
FA Factor Analysis
GDD Global Demand Data (Sabre)
GDP Gross Domestic Product
GFC Global Financial Crisis
GPS Global Positioning System
IATA International Air Transport Association
ICAO International Civil Aviation Organisation
IFR Instrument Flight Rules
ILS Instrument Landing System
IVS International Visitor Survey
M.E Market Economics
MBIE Ministry for Business Innovation and Employment
MoH Ministry of Health
MOT Ministry of Transport
NDB non-directional (radio) beacons
NSS New Southern Sky
NZ New Zealand
NZ Airport New Zealand Airport Association
OE Overseas Experience
OIA Official Information Act
PAX Passenger/s
RNAV Area Navigation
TA Territorial Authority
VFR Visual Flight Rules
VOR VHF Omnidirectional Range
xiv1 Introduction
New Zealand’s domestic air transport network is a vital part of the economy. The network
facilitates a range of connections allowing people and cargo to move between different
cities and towns, thereby linking productive activities across space. The network is dynamic,
with feedbacks between components as well as the environment within which it operates.
Economic, social and technological trends are changing aviation and how it interacts with
the wider business environment. Understanding these dynamic forces, and the flow-on
effects, is critically important when seeking to optimise the air network in the short, medium
and long term. This research is the first stage of an investigation into the future of New
Zealand’s (NZ) domestic air network.
The New Zealand (NZ) domestic air network is an essential piece of the country’s transport system. The
airports enable air movements between cities, unlocking business opportunities and facilitating social
connections. NZ’s airports and airline industries are both facing a range of pressures that will influence their
future viability and ability to service NZ communities. The Ministry of Transport (MoT) and the New Zealand
Airport Association (NZ Airports) have joined forces to establish a staged research programme, seeking to
shed light on the forces affecting NZ’s domestic air routes. This report summarises the findings of stage 1 of
the research. This stage focuses on the current situation, identifies the key issues affecting and driving the
network’s performance. Market Economics Limited (M.E) and Astral Limited were commissioned to
undertake this first stage of the research.
1.1 Project Objectives
In New Zealand, there is a need to identify the medium to long term trends and drivers that are likely to
shape the domestic air network and air transportation. This research focuses on the current situation and
the short term outlook (next 5 years or so). Subsequent research stages may consider a longer term focus
(e.g. 10 to 20 years). A number of project objectives guided this research. In summary, the project objectives
included:
To review the current network and to draw out the insights, issues and considerations, focusing on
the airport infrastructure and aircraft servicing the routes.
To assess the current levels of service provided by air carriers on different routes and to explore
the issues affecting performance on the main routes and city-pairs.
To explore the issues affecting airlines’ ability to deliver services e.g. ticket costs and peer-to-peer
arrangements (e.g. code sharing).
To explore and highlight air transportation’s interactions with areas that they service, by assessing
the catchments, service densities and cost implications (on different air sectors).
To identify the key drivers of the network and to understand the immediate outlook for the route
configuration.
To highlight potential policy issues.
Ultimately, the core deliverable of stage 1 is to provide a picture of New Zealand’s domestic air network,
including the linkages between airports, their services and infrastructure and to identify the drivers of the air
transport network.
11.2 Project Approach
This research called for a staged approach and used both quantitative and qualitative research techniques.
The findings of the two approaches were integrated, to provide a detailed picture of the factors influencing
the domestic air network.
1.2.1 Quantitative Process
The quantitative process consisted of two parts, data gathering and analysis. During the first part, the team
collected large datasets and after interrogating these datasets, extracted the relevant data. The resulting
data was entered into a statistical programme to identify the key (unobserved) relationships between data
points. These relationships were identified using Factor Analysis (FA) (see Appendix 1). The following data
sources were used to populate the dataset used in the FA:
Statistics New Zealand data,
Business Demography Survey,
Regional GDP datasets,
Census data (2001, 2006 and 2013),
Ministry for Business, Innovation and Employment,
Tourism data sourced from the International Visitor Survey (IVS) and the Domestic Travel Survey
(DTS),
Sabre® Global Demand Data (GDD),
International Air Transport Association,
Airports’ Financial Plans and Reports.
An important source was the flight and route information sourced from Sabre® Global Demand Data (GDD).
This information forms a central pillar of the assessment, as it provides a breakdown of passenger (PAX)
movements on different routes, connecting movements and average fares (in US$)10. The Sabre® data
covered the 2014 calendar year. However, this data does not cover all routes. It does not include the smaller
independent operators11. This information gap was addressed by reviewing route information, passenger
schedules, and ticket prices as well as aircraft information sourced from the independent. The resulting
dataset was used to complete a high-level assessment of the relative financial performance of different
routes. This information was combined with estimates of aircraft operating costs to identify the profit
differential of shifting to another aircraft platform.
The quantitative process was supplemented with an interview and survey process.
1.2.2 Surveys and interview
As part of this study, the team invited all the airports included in this study (see Appendix 2), to complete a
survey. In some cases, the airports’ responses were followed up with an interview (telephonic or physical).
10 Where necessary the US$ is converted to NZ$ using the average exchange rate of the study period.
11 The regional airlines
2In addition, airlines operating scheduled flights were also invited to complete a survey. Again, some of these
airlines were interviewed. In addition to interviewing the airports and airlines, we completed a review of the
regional economic development plans and programmes and Council Long Term Plans. In some cases this was
followed up with telephone calls to verify and confirm some of the findings. In total, the team gathered
information from 37 airports and 10 airlines. We also reviewed the economic development strategies and
plans of 14 individual regions. Our review also included a number of territorial authority (TA) level strategies,
plans and reports. With reference to the survey and interview process, as far as the team is aware, all
relevant airports and airlines were invited to participate in the research. Some respondents requested that
we keep their responses confidential and others did not participate in the research. More than 85% of
airports participated in the research but only a small number of airlines replied. Nevertheless, we used the
inputs that we received and inferred the wider implications from this. Of course, the limited response means
that we report the views of the minority. These views are therefore not representative of the whole airline
industry and should not be viewed as such.
The surveys and interviews were designed to identify the key issues that are currently affecting the domestic
air network’s performance from the airports’ and airlines’ perspective. This was done by exploring:
Market issues,
Aircraft fleet considerations,
Air transport issues,
Technology factors,
Infrastructure and facility issues, and
Linkages to other transport modes.
As part of the survey and interview process, the team also liaised with the Civil Aviation Authority (CAA) and
reviewed CAA information, particularly their publically available information i.e. Aeronautical Information
Publication New Zealand (AIP).
Other sources reviewed and used during the interview and survey process include:
Airports’ Master Plans,
Regional economic development plans and programmes,
Councils’ Long Term Plans,
A selection of District Plans,
MBIE’s Regional Economic Activity Report,
National Freight Demand Study,
Tourism Forecasts (MBIE),
Airports’ Statement of Intent (where relevant), and
CAA documents.
1.2.3 Synthesis and Findings
During the final stage, the team summarised the analysis, identified the issues and explored the relationships
and wider implications of the current trends. The core issues were identified after considering the following
aspects:
3 The network’s current relative structure (size and distribution),
The performance of routes relative to the communities they service,
The short term outlook for domestic air transport and airports based on expected movement(s) in
the drivers and factors influencing the drivers,
Aircraft fleet and technical factors,
Other considerations such as policy and operational issues that could influence the outlook.
The findings were interpreted to provide some high-level policy questions that could form the basis for
additional research. Delivering specific recommendations are however, beyond the scope of this study.
We note that the New Zealand air transport and airport sector is diverse with many role-players. An
important observation about the NZ air transport market is that it is dominated by a single, large player – Air
New Zealand. This dominant position translates into a number of potential market and economic efficiency
issues. These aspects are beyond the scope of this report.
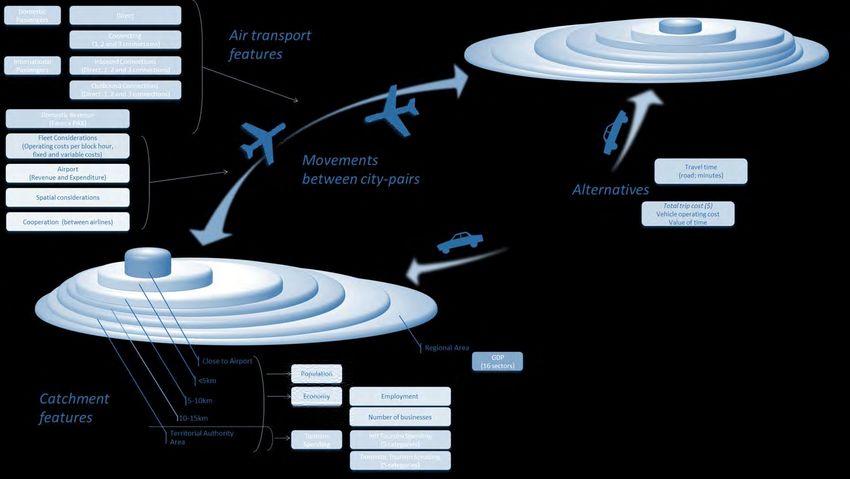
1.3 Areas Covered
The research covers a wide range of topics and uses statistical tools to identify the underlying relationships
between different variables. The variables have been selected in a way that captures both supply and
demand side aspects of the domestic air network. Figure 1-1 shows the different areas considered and
included in the study:
The air transport features including aspects around the total passenger movements on the different
routes (sourced from SABRE® GDD), the estimated revenue per route (SABRE® GDD), the fleet
considerations (focusing on the regional routes), spatial considerations and cooperation between
airlines (based on interviews with airlines);
The catchment features (of both the origin and destination in the city-pairs). The analysis covers
six different spatial scales.12 The spatial scales are used in a way that provides multiple perspectives
on the relationships between air transport (passenger movements) and the catchment features. In
addition, the analysis used the different spatial scales to identify any thresholds or catchment
related features. The following features are included: employment, number of businesses,
economic sectors, Gross Domestic Product (GDP) and tourism spending (including both domestic
and international tourist spending on 5 different tourism products).
The alternative to air transport. Given, that air transport is predominantly focused on passenger
movements, we included the time (in minutes) to travel between city pairs in the analysis. In
addition, we estimated the potential cost of travelling by road, in order to compare the cost of road
travel against air transport. This comparison was done for a selection of routes to determine if any
substantial cost and time differences exist.
12The spatial scales cover different ‘bands’ around the airports – in close proximity to the airport using the Area Unit
within which the airport is located, within 5km from the airport, within 5-10km, within a 10-15km area and further than
15km from the airport. The territorial authority area and regional council areas are also included. These two spatial
definitions are used together with the GDP and tourism spending datasets.
4Figure 1-1: Areas Covered
11.4 Report structure
The rest of the report is structured as follows:
Section 2 describes the current situation. It covers airport infrastructure aspects, fleet characteristics,
general route characteristics and the wider landscape. This section summarises the survey and interview
findings by highlighting the airports’ and airlines’ perspectives.
In Section 3, we explore the key relationships between the airports, airlines and communities as identified
using Factor Analysis.
Section 4 discusses the outlook for the each of the identified key drivers, with a focus on the implications for
the domestic air network.
The report concludes with Section 5. In this section, we summarise the key findings in terms of the network’s
outlook and we provide some high-level policy questions.
12 Current Situation
Airports and airlines provide essential services to New Zealand’s regions by connecting people and business.
The air network is described in terms of airport facilities, the aircraft fleet and passenger movements. This
discussion provides a basic understanding of the domestic air network and the current pressure points in the
system. The discussion combines information from the surveys, interviews and published information. This
section describes the current situation using the following headings:
Airport infrastructure,
Route network,
Aircraft fleet characteristics,
Recent Announcements,
Other considerations, and
Current perspectives.
2.1 Airport Infrastructure
New Zealand is relatively well endowed with aerodromes, some 175 of all types being listed in the NZAIP.13
Aerodromes can be either certificated by the Civil Aviation Authority (CAA) under Rule Part 139 or non-
certificated.14 Certificated aerodromes have higher design and operational standards. Only certificated
aerodromes can receive regular air transport operations from aircraft with a capacity of more than 30
passenger seats. That said, the operational safety record of non-certificated aerodromes since the rule's
inception in 1993 has been good.
The study has focused on 37 aerodromes, largely those that have scheduled air services. This includes some
aerodromes that have recently lost air services. These aerodromes range from large international facilities
such as Auckland International Airport, through to small grass facilities such as Waiheke Island. A breakdown
of the various aerodrome types and their facilities is shown in Table 2-1. The table shows the airports:
Certification Levels: Part 139 certificated.
International Civil Aviation Organisation (ICAO) Code.
Approach type.
Maximum Aircraft Size (terminal).
Runway features, and
Operation Type.
Terminal capacity is generally matched to the types of aircraft servicing the aerodromes and their frequency
of operation. Some of the smaller aerodromes in our study did not have terminals at all. The terminal
capacity is presented in terms of the maximum aircraft size (in terms of passengers).
13. New Zealand Aeronautical Information Publication.
14. The term “aerodrome” is the generic name used by ICAO and CAA to describe facility for fixed wing aircraft. An aerodrome can range
in size from a major international airport to a small grass airstrip.
2Table 2-1: Aerodrome Features
Approach type Runway Operation type
Maximum
Part 139 ICAO aircraft
Surface
Length
Width
RNAV
Night
Aerodrome
VOR
NDB
IFR
ILS
certificated Code size
(seats)
Ardmore No 3C Yes 30 1,411 45 Sealed Yes Yes
Auckland Yes 4F Yes Yes Yes 400+ 3,535 45 Sealed Yes Yes
Chatham Yes 3C Yes Yes 50 1,360 45 Sealed Yes Yes
Christchurch Yes 4F Yes Yes 300 3,288 45 Sealed Yes Yes
Dunedin Yes 4D Yes Yes Yes Yes 180 1,900 46 Sealed Yes Yes
Gisborne Yes 3C Yes Yes 50 1,310 45 Sealed Yes Yes
Great Barrier No 2B Yes Yes 15 930 9 Sealed Yes No
Hamilton Yes 4D Yes Yes Yes 70 2,059 45 Sealed Yes Yes
Hokitika Yes 3C Yes Yes 70 1,233 30 Sealed Yes Yes
Invercargill Yes 4D Yes Yes 70 2,210 45 Sealed Yes Yes
Kaitaia No 3C Yes Yes 19 1,402 30 Sealed Yes Yes
Kerikeri Yes 2C Yes Yes 50 1,190 30 Sealed Yes Yes
Masterton No 3B Yes 9 1,205 23 Sealed Yes Yes
Milford Sound No 1B 15 772 16 Sealed No No
Napier Yes 3C Yes Yes 70 1,750 45 Sealed Yes Yes
Nelson Yes 3C Yes Yes 70 1,347 45 Sealed Yes Yes
New Plymouth Yes 3C Yes Yes 70 1,310 45 Sealed Yes Yes
North Shore No 1A Yes 9 738 9 Sealed Yes Yes
Palmerston Nth Yes 4C Yes Yes 70 1,902 45 Sealed Yes Yes
Paraparaumu Yes 3C Yes Yes 50 1,187 45 Sealed Yes Yes
Picton No 2A 15 780 12 Sealed *No No
Queenstown Yes 4C Yes Yes 180 1,839 30 Sealed Yes *yes
Rotorua Yes 4C Yes Yes 70 1,843 30 Sealed Yes Yes
Stewart Island No 1A 9 620 16 Sealed No *yes
Takaka No 2A Yes 9 832 12 Sealed Yes No
Taupo Yes 3C Yes Yes 19 1,386 30 Sealed Yes Yes
Tauranga Yes 4C Yes Yes 70 1,825 45 Sealed Yes Yes
Timaru Yes 3C Yes Yes 19 1,280 45 Sealed Yes Yes
Waiheke Island No 1A 15 630 30 Grass No No
Wanaka No 3C Yes 19 1,200 30 Sealed Yes No
Wanganui Yes 3C Yes Yes 19 1,372 45 Sealed Yes Yes
Wellington Yes 4E Yes Yes Yes 180 1,815 45 Sealed Yes *yes
Westport Yes 3C Yes Yes 15 1,280 30 Sealed Yes Yes
Whakatane No 3C Yes Yes 50 1,280 31 Sealed Yes Yes
Whangarei Yes 2C Yes Yes 50 1,097 30 Sealed Yes Yes
Whitianga No 3A Yes 9 1,526 18 Grass Yes No
Woodbourne Yes 3C Yes Yes 50 1,425 45 Sealed Yes Yes
Generally, runways longer than 1,400m make up 41% of the 37 aerodromes in the study and are adequate
for all the typical in-service, and likely future, propeller powered regional aircraft. Runways between 1,200m
and 1,399m long are generally adequate for services provided by 50 seat aircraft, such as the Bombardier
Q300 operated by Air New Zealand and Qantas Link. Together, with the +1,400m runways this totals 73% of
the 37 studied. The remaining 10 (27%) aerodromes' runways are less than 1,200m long, which is generally
inadequate for turbo-prop aircraft with more than 19 seats, other than specialist short take-off and landing
aircraft.
These aerodromes are most at risk of not being able to accommodate aircraft of a standard acceptable to
the major airlines for interline carriage of their passengers, a source of revenue that can provide both steady
business for the aircraft operator and deliver international tourists to regions trying to grow their tourist
market. These short runways are however located in areas with small total passenger demand, so this
limitation is not a surprise.
For reliability of service in poor weather conditions, aerodromes require an instrument approach. Previously,
most general aviation aircraft and small airports were equipped for basic instrument approaches. However,
with the move to New Southern Sky (NSS), progressive withdrawal of non-directional (radio) beacons (NDB)
3You can also read