Building malls or metros? - South Africa's exports of tradable urban services to the rest of Africa - unu-wider
←
→
Page content transcription
If your browser does not render page correctly, please read the page content below
WIDER Working Paper 2020/94

Building malls or metros?

South Africa’s exports of tradable urban services to the rest of
Africa

Ivan Turok and Justin Visagie*

July 2020

Abstract: Service industries are increasingly important in international trade and offer additional
paths to economic development. There are many opportunities to expand trade in services
between South Africa and other African countries. Improvements in urban planning, design, and
governance are vital to create more productive and liveable cities. South Africa has many
capabilities to support urbanization in Africa. However, South African companies have been
relatively unsuccessful at exporting this expertise, and more successful at exporting retail, financial,
and telecoms services. One reason is that urban infrastructure projects are discrete, risky, and
costly. South African companies have tended to go it alone, with minimal commitment to host
nations and little support from governments or other firms. Some have been absorbed into larger
multinational corporations. There has been no concerted effort in South Africa to promote
tradable urban services as a package of capabilities that could unleash greater economic dynamism
within both source and host countries.
Key words: Africa, international trade, South Africa, tradable urban services, urban infrastructure,
urbanization
JEL classification: L80, O14, O18, O55

*   Human Sciences Research Council, Cape Town, South Africa. Corresponding author: JPVisagie@hsrc.ac.za.
This study has been prepared within the UNU-WIDER project Southern Africa—Towards Inclusive Economic Development
(SA-TIED).
Copyright © UNU-WIDER 2020
Information and requests: publications@wider.unu.edu
ISSN 1798-7237 ISBN 978-92-9256-851-1
https://doi.org/10.35188/UNU-WIDER/2020/851-1
Typescript prepared by Merl Storr.
The United Nations University World Institute for Development Economics Research provides economic analysis and policy
advice with the aim of promoting sustainable and equitable development. The Institute began operations in 1985 in Helsinki,
Finland, as the first research and training centre of the United Nations University. Today it is a unique blend of think tank, research
institute, and UN agency—providing a range of services from policy advice to governments as well as freely available original
research.
The Institute is funded through income from an endowment fund with additional contributions to its work programme from
Finland, Sweden, and the United Kingdom as well as earmarked contributions for specific projects from a variety of donors.
Katajanokanlaituri 6 B, 00160 Helsinki, Finland
The views expressed in this paper are those of the author(s), and do not necessarily reflect the views of the Institute or the United
Nations University, nor the programme/project donors.
1     Introduction

Africa suffers from serious infrastructure deficits that impede economic growth and social well-
being. Yet less than one per cent of assets under management for infrastructure globally come to
the continent (Games 2019). The World Bank (2017) estimates that gross domestic product (GDP)
per capita in Africa would increase by 1.7 per cent a year if the continent were to close the
infrastructure gap with the rest of the developing world. In addition, trade within Africa is much
weaker than is the case in other regions, with intra-African exports amounting to only 16 to 17 per
cent of total African exports, compared with the equivalent figure of 59 per cent for Asia (AfDB
2017). One of the obstacles is poor transport and logistics systems. Severe infrastructure shortfalls
also plague Africa’s economic hubs—its cities. They are increasingly congested, crowded, costly,
and informal. This stifles productivity and competitiveness, causes hardship and ill health, and
generates social unrest and disorder (Collier and Venables 2017; Mills et al. 2017). Africa’s urban
population is growing at about four per cent per annum and is expected to treble in size over the
next 30 years (UN 2018). This increase is roughly equivalent to the current urban population of
Europe and North America combined. This poses immense challenges, but is also a potential game
changer if the infrastructure and institutions can be created which will enable urbanization to
transform livelihoods and living conditions.

The situation is improving in some respects, with signs of stronger cooperation emerging among
governments and global institutions, and new resources becoming available (Brookings Institution
2020; Games 2019). China has rapidly become the largest single funder of infrastructure on the
continent, generally adding to rather than replacing existing funders (Deloitte 2018). The African
Development Bank (AfDB) recently doubled its available capital to invest in projects, which is
deliberately intended to reduce risks and leverage additional funding from private banks, equity
funds, pension funds, and development finance institutions. Meanwhile, sizeable discoveries of
gas, oil, and other natural resources in countries such as Madagascar, Mozambique, and the United
Republic of Tanzania are attracting substantial foreign direct investment (FDI) and should in due
course generate very sizeable tax revenues for investment in new economic and social
infrastructure. Flows of FDI to Africa rose by 11 per cent in 2018 to US$46 billion, against the
general global trend (UNCTAD 2019). This was still only 3.5 per cent of the global total, while
Africa’s share of the world population is almost 17 per cent. Asia received more than 11 times as
much FDI as Africa.

Extra funding will clearly help, but this is not enough to transform the situation. A more supportive
legal and operating environment for investment, better-designed projects, and decisive
implementation are also needed to help expand productive activity and diversify economies away
from basic commodity exports. Coordination on the ground is important to ensure that different
investments complement each other, and extravagant and inappropriate schemes are avoided.
There are many competing priorities for the resources available, so tough choices require sound
knowledge and insights into what is most important and feasible. African countries have much to
learn from each other because their experiences and challenges are often similar. Yet historic
colonial relationships mean that continental political and economic networks are often weaker
than expected, and an ongoing brain drain means a loss of professional skill sets. There are also
many barriers to the exchange of know-how and expertise in the form of restrictive regulations,
licences, and technical specifications designed to protect established groups from external
competition (World Bank 2020). Rules related to travel visas, work permits, and professional
accreditation can also frustrate cross-border movements of competent personnel to provide
specialized services. Governments often justify these hurdles on the basis of consumer protection
and the maintenance of environmental, social, and labour standards.

                                                 3
Against rising protectionist sentiments around the world, continental trade agreements signal the
new political commitment to Africa-wide progress (Brookings Institution 2020). Greater openness
has the potential to grow cross-border value chains and promote industrialization and
development across the continent. It could also improve trade in a range of urban development
and infrastructure services, in line with the United Nations’ Sustainable Development Goals and
the 2063 Agenda of the African Union. The South African Development Community (SADC)
Trade in Services Protocol, adopted in 2012, commits SADC countries to trade talks every three
years focused on six priority sectors: communication services, construction services, energy-related
services, financial services, tourism services, and transport services. Similarly, the Common Market
for Eastern and Southern African States, the East African Community, and their integration with
the SADC through the Tripartite Free Trade Area in 2015 include explicit commitments to
regional services trade integration (Cattaneo 2017).
The recent agreement to form an African Continental Free Trade Area may be the most important.
It includes a services protocol that would reduce general tariffs on services trade as well as other
barriers such as different regulatory standards and onerous licensing and certification procedures
(UNECA 2018). Negotiations are proceeding with a specific schedule of commitments for five
priority service sectors—business, communications, financial, tourism, and transport services—
which are to be finalized within the next two years (Cattaneo 2017, 2020). In practice, the process
is complex, the private sector has barely been consulted, and there is a great deal of work to be
done to identify complementary strengths where countries can support each other through
regional trade and cooperation. This goes beyond tariff reductions to include other limitations on
trade, such as stipulations on foreign equity, differences in standards and rules for licensing,
thresholds for local content in state-related contracts, and restrictions on the movement of people.
South Africa’s (SA) position and approach will come under intense scrutiny, as SA is the region’s
dominant economy, with a long-standing tendency to look down on the rest of Africa, and even
to view it negatively as a threat because of undocumented migration and refugees. SA has an
opportunity to take the lead in setting a good example of responsible trade and investment. Trade
agreements need to be framed as partnerships of equals and provide benefits all round if they are
to win general support.
One of the missing features in most African countries is a positive vision of the possibilities for
urbanization to accelerate industrialization and social progress (UNECA 2017). A more deliberate
approach to urban development and infrastructure provision is vital to realize the benefits of
concentrated populations for jobs, well-being, and structural transformation, and to avoid the
pitfalls of haphazard urban growth (Collier and Venables 2017; Turok 2016). Basic urban planning
and land management are needed to avoid mushrooming informal settlements that are costly to
retrofit with infrastructure or to rebuild into more resilient and liveable neighbourhoods. Unless
more efficient use is made of the land, the rate of expansion of the physical footprint of African
cities could be half as much again as their population growth (Angel 2016). Careful, compact urban
development is also necessary to reduce environmental degradation and natural hazards, and to
adapt to the changing climate. The concept of ‘integrated urban services’ sums up the idea that
different government policies, actions, and regulations relating to land, transport, and public
utilities should be aligned with investments by firms and households in the built environment to
ensure more efficient, connected, and mutually reinforcing spatial outcomes.
As one of the most developed and urbanized countries on the continent, SA has many of the
attributes required to function as a hub of expertise in urban development through its diverse
capabilities in engineering, planning, property, transport, finance, and other business and
professional services (Games 2004). Such networks could in turn support the emergence of home-
grown suppliers of materials, plant, equipment, and other inputs used in buildings and
infrastructure. The weak performance of SA’s economy over the last few decades has provided
4local companies with a strong incentive to tap into other African markets. SA could also operate
as a regional gateway for leading multinationals to engage with other African countries—adapting
their services and products to local markets and providing valuable after-sales support, thereby
generating jobs, incomes, and tax revenues. Prior to 1994, few SA companies traded north of the
border because of the country’s pariah status. Since then, many SA firms have sought to enter
these markets, often in an assertive and insensitive manner. They have ignored the trade they
displace from existing local businesses, which has created resentment (Games 2004). They have
also been criticized for pursuing their own self-interested agendas and ignoring any broader
contribution they could make (DTI 2017). The outcome for these companies has been very mixed,
with patent success in the financial services, telecoms, and retail sectors offset by some prominent
failures in engineering, construction, and property development (Visagie and Turok 2019).
The SA government has expressed concern that the trade balance with other African economies
is one-sided, since exports mostly comprise high-value goods and services, whereas imports are
largely commodity-based (oil and minerals). It believes that SA companies should show restraint
and adopt fairer practices in these engagements. To prevent the gap widening further, it advocates
joint ventures and other investments to expand production and provide critical infrastructure in
these territories (DTI 2017). In other words, it favours initiatives that share the gains of trade,
rather than inequitable and extractive relationships. This is laudable, although it neglects the
competitive environment in which SA firms operate and the threats from more powerful
multinationals which could easily displace them. The Department of Trade and Industry (DTI)
also advocates building strategic transport corridors, but ignores the opportunities to accelerate
growth and development presented by urbanization and the potential for SA companies to play a
major enabling role by exporting urban services. This stems from a single department with little
vision of what the government as a whole might do to strengthen African economic integration.
The purpose of this paper is to better understand the extent and nature of SA trade in services
with other African countries. The particular focus is on learning lessons from the experience of
companies directly involved in providing tradable urban services. This may help to identify ways
in which such services could be strengthened so as to promote regional economic cooperation,
industrial diversification, and inclusive development across the continent. The specific research
questions addressed are as follows:
i. What is the extent of SA trade in services with other African countries, particularly in
relation to integrated urban services such as engineering and real estate?
ii. What experience have SA companies had in providing such services, and who has
benefited in the process?
iii. Could the SA government do more to boost tradable services in Africa, and what obstacles
need to be overcome to achieve that?
Following this introduction, the second section of the paper presents a simple conceptual
framework to suggest how tradable services can promote development rather than divergence in
Africa. Section three provides an original analysis of data from the fDi Markets database of
investment projects by SA companies in other African countries over the period 2003 to 2019.
The fourth section presents a series of propositions and themes that emerged from 15 interviews
undertaken with companies based in SA, independent observers, and government officials. The
final section concludes and makes recommendations.
52 Conceptual frame
Manufacturing has conventionally been considered the principal driver of economic growth and
transformation in developing regions and nations (Kriticos and Henderson 2019; Newfarmer et
al. 2019; Rodrik 2018). The strong performance of many Asian economies in recent decades has
given credence to this proposition. There are essentially four reasons why manufacturing is widely
considered the leading or propulsive sector of the economy (summarized in Table 1, rows 1 to 4).
First, manufactured goods are tangible and can be readily exported, which allows local and national
economies to grow beyond the confines of domestic demand by tapping into larger external
markets and entering regional and global value chains. Second, most industrial processes can be
standardized and scaled up to create many low- and medium-skilled jobs accessible to the majority
of the labour force. Third, manufactured products and processes generally benefit greatly from
technological change, learning, and productivity growth, which raise workforce incomes and boost
economic competitiveness. Fourth, manufacturing plants typically generate substantial multiplier
effects as their output increases, which benefits the domestic suppliers of goods and services, and
magnifies the original stimulus to growth. These four features also interact and reinforce each
other to compound manufacturing’s catalytic effect across the whole economy. For example,
tradable goods are exposed to international competition, which adds to the pressure on firms to
increase efficiency and lower costs through economies of scale and innovation, which in turn spurs
growth in output and jobs.
Table 1: Relative advantages of manufacturing and tradable services for economic growth and development
Manufacturing Lower-value tradable Higher-value tradable
(e.g., processing services services
facilities, assembly (e.g., tourism, (e.g., business,
plants) transport, distribution, financial, digital,
retail, call centres) professional)
1. Products are tradable, *** ** **
allowing countries to tap into
wider markets and boost
growth
2. Processes are easily *** ** *
standardized and scalable,
which creates many low- and
medium-skilled jobs
3. Products and processes *** ** ***
benefit from technological
change, learning, and
productivity growth
4. Multiplier effects are *** * **
sizeable, which benefits local
suppliers
5. Firms’ presence in export * ** ***
markets helps to strengthen in-
country institutions
6. Training and capacity- * ** ***
building occur in host nations
7. Position of the establishment May be somewhat Routine functions tend High-order functions
in the local economy and global isolated and marginal to be isolated and are often more central
value chains marginal and powerful
Note: *** = strong performance of the sector on this particular criterion; * = weak performance.
Source: authors’ compilation.
6When manufacturing leads economic growth, the effect is structural transformation from an
economy previously dominated by the production of primary commodities. This results in rising
household incomes and higher tax revenues. These benefits are enhanced by the growing
concentration of population and economic activity in cities (Collier and Venables 2016; Ellis and
Roberts 2016; Turok 2016). Urbanization is associated with the transition from agriculture to
industry as surplus workers are pushed out of low-productivity farming and pulled into more
productive manufacturing. Economic concentration also creates external economies of scale and
scope, and generates a common pool of skills and other resources (Collier and Venables 2017).
Proximity facilitates communication, learning, and specialization among firms and workers, which
amplifies the productivity gains and generates more jobs and higher incomes. Furthermore,
agglomeration tends to bring about improvements to transport infrastructure and connections to
wider markets and supply chains, which helps to accelerate economic growth. In other words,
industrialization and urbanization tend to go together.
Many Asian economies were fortunate in seeking to industrialize during an era when international
markets were becoming more open, macroeconomic conditions were relatively stable, and the
demand for cheap consumer goods, such as clothing and electronics, was rising fast. Contemporary
global conditions are more uncertain and unpredictable, which is tending to dampen investment.
Multilateralism is also being undermined and markets are becoming less open because of rising
economic nationalism. Meanwhile, the structure of the global economy is gradually shifting
towards services, which tend to be less tradable, and cheap labour is becoming less important than
it used to be because of technological change. For all these reasons, it is becoming more difficult
for latecomer countries in Africa and elsewhere to replicate Asia’s success by relying solely on
manufacturing as the growth engine (Brookings Institution 2020; Kanbur et al. 2019). It is likely
that they will have to identify additional export opportunities and a range of niche markets where
they stand some chance of success. By providing various technological and service inputs, they
may be able to help their primary and secondary industries to improve their products and become
more competitive.
Africa’s industrial performance has been poor for decades (UNECA 2017). Rapid urbanization
has proceeded without industrialization or formal employment growth, giving rise to ‘consumption
cities’ where most goods and services are small-scale, often informal, and local in scope (Gollin et
al. 2016; Lall et al. 2017). This has prompted questions about whether other sectors might
contribute to structural transformation and development, and whether external investors could
help to shift production from serving purely local markets to wider markets (Dihel and Goswami
2016; Hoekman and te Velde 2017; Newfarmer et al. 2019). Some opportunities have emerged
from new digital technologies and reductions in transport costs, both of which broaden the scope
of activities that are tradable across national borders. Tradability is important for escaping the
constrained demand experienced in a small or slow-growing domestic economy. Services that
traditionally relied upon face-to-face contact, including some of the functions performed in
banking, real estate, travel agencies, healthcare, entertainment, and education, can now be codified
and provided via remote digital communication, which lowers transaction costs and widens market
access. Some information-based processes can now be standardized, outsourced, scaled up, and/or
replicated to create larger numbers of jobs than before, such as back-office functions, call centres,
and data-processing. Moreover, certain kinds of knowledge-intensive service activity, such as
research, design, engineering, and software, can trigger improvements in the cost, quality, and
functionality of other sectors, including agriculture (horticulture) and manufacturing (Kanbur et
al. 2019). Some of these benefits are intensified by agglomeration through the exchange of ideas
(mutual learning), positive feedback effects, investor confidence, and palpable momentum.
Many service industries have a smaller catalytic impact than manufacturing because they are less
tradable, scalable, and productivity-enhancing. This is partly because many services are intangible
7or ‘asset light’ (UNCTAD 2019) and need to be customized to unique user requirements.
Nevertheless, services are an extremely diverse group of activities, and some of them offer other
advantages for deepening development that go beyond the immediate contractual benefits for their
customers, through improving institutional capabilities, human expertise, and business networks,
which may have an enduring impact. There are arguably three characteristics of tradable services
that rival manufacturing in certain respects (see rows 5 to 7 of Table 1). They also complement
primary and secondary sectors by providing essential inputs and reducing obstacles to
industrialization. They may benefit countries on both sides of the trade connection—the source
or exporting nations, and the hosts or receiving nations—through reciprocal actions and
collaborations, in the form of capacity-building and knowledge transfer, that recognize their
interdependence. In view of the diversity of tradable services, Table 1 subdivides them into lower-
value, less-skilled activities, such as tourism, transport, and distribution, and more sophisticated,
higher-value activities, such as business, financial, and professional services. The former tend to
be more easily standardized and scaled up, while the latter are more likely to be bespoke or adapted
to particular markets and clients. The threefold rating scale used to assign a value to each cell in
Table 1 is clearly a considerable simplification of real-world diversity.
The first feature is that the firms engaged in trade help to strengthen in-country institutions (Table
1, row 5). Manufacturing firms usually maintain arm’s-length transactions with customers, but
many service providers enter into close and enduring relationships with their users and other
stakeholders. This can help to diffuse valuable information, inject fresh thinking, challenge
complacency, raise standards, and sustain progressive improvements. Good relations with
government clients and other firms build a reputation, generate trust, and attract more custom.
Higher-level services are most likely to involve flows of tacit knowledge and specialized expertise,
with good ideas and practical advice passed on, and ‘learning by doing’ encouraged. These
interactions may foster better solutions to local problems, spur organizational improvements, and
reduce the risks for other investors in these places. For example, professional services may enable
investments in urban land, public utilities, and logistics to be adapted to the unique form of each
city in a way that enhances its efficiency and reduces costs. A more functional built environment
is a precondition for industrialization and broad-based development (Turok 2017). Professional
services firms can also advise governments on improving local industrial ecosystems to attract and
embed FDI—through appropriate customs procedures, legal frameworks, and specialized services.
They can help to devise better building codes and by-laws, and streamline business registration
and licensing systems to enable small, informal enterprises to develop into more robust firms.
Second, the firms engaged in trade often help to transfer skills and build technical competence by
investing in suitable staff capacity in the host nation (Table 1, row 6). This is unusual in the
manufacturing sector, but many suppliers of services are obliged for reasons of credibility and
regulatory compliance to establish a physical presence in their destination markets and to provide
ongoing assistance to strengthen local technical, managerial, and professional capabilities. Training
local staff can also make savings on the sizeable costs of importing foreign expertise and sustaining
a cohort of expatriates with all their travel and extra expenses. A simple example is the provision
of services to manage, maintain, and repair buildings, plant, and equipment installed in the host
country. Creating a local presence often takes the form of joint ventures, strategic partnerships, or
other collaborative arrangements with emergent local firms. It requires resources to be committed
to enterprise development, staff training, and upskilling in order to establish and maintain a
competent cohort of local workers, managers, and professionals on the ground who understand
local conditions. The introduction of external know-how and talent can thereby contribute to
enhanced learning and local empowerment. In turn, stronger human and business capabilities are
vital to underpin self-reliant and sustained prosperity through higher productivity, better-quality
goods, and more responsive services.
8The third feature concerns the specific task or function performed by the local facility/plant/office
and its position within the local economy and wider regional or global value chains: is it relatively
central/powerful, or isolated/marginal (Table 1, row 7)? The former reflects its importance as a
supplier of goods and services to other sectors of the local economy and the knock-on effects of
its improved performance. The latter affects the influence, power, or control the establishment
has over its destiny, the commercial pressures faced, and the quality of employment provided.
Mining operations, basic assembly plants, franchise retail outlets, and outbound call centres may
be at the lower end of the spectrum, while research and development operations, specialized
business services, and corporate headquarters may be at the upper end. High-order tradable
services tend to be knowledge-intensive and are often oriented towards the crucial tasks of
conceptualization, planning, and design, rather than physical execution and implementation. They
can make a big contribution to the effectiveness and durability of activity throughout the value
chain, including influencing the source location for the various inputs of goods and services.
Advanced business services can assist firms and their suppliers to modify and adapt their products,
upgrade their technical capabilities, and perform more specialized functions, thereby raising
incomes (World Bank 2020). Urban logistics, reliable energy supplies, telecoms, and other
infrastructure services play an essential role in affecting the productivity of the entire economy.
The rapid rise of digital technologies means that electronic data centres, cloud computing, and
associated software services are becoming increasingly important inputs to all economic sectors as
well (McKinsey 2019).
The key point, therefore, is that high-order services can support trade and development through
enlarging knowledge, strengthening competences, and facilitating networks and linkages across the
local economy. However, these benefits are by no means automatic or inevitable. They depend on
multiple factors, including the economic power and strategy of the company providing the service.
For example, it may be driven above all by a narrow, self-interested approach to extract income
and knowledge from the host economy—effectively going it alone. The world’s four largest
auditing firms—Deloitte, EY, KPMG, and PwC—are often criticized for the extensive influence
they have over governments and other private corporations arising from their wide-ranging
advisory services, which generate extravagant fees and sometimes implicate them in wrongdoing
and irresponsible practices. If governments simply outsource some of their core functions to such
firms in order to save staff costs and benefit from their expertise, there may be a loss of strategic
capabilities to the country.
Alternatively, companies providing services may take a broader, longer-term perspective and
recognize that they can contribute to the host economy and use their employment and
procurement powers to build capacity and long-term value, perhaps in partnership with local firms.
The outcome also depends on the policy and regulatory environment in the country, including
whether the government has effective policies in place to encourage foreign service providers to
establish a physical presence, to increase local content, and to form meaningful joint ventures with
local enterprises. These policies need to be applied consistently and transparently to ensure they
are credible and gain traction. Even simple matters such as the willingness to grant temporary
business visas and accreditation to non-resident engineers, project managers, and other specialized
professionals could make a difference to countries’ ability to attract and retain foreign investment
in services. Services have traditionally been more highly regulated than manufacturing, and rules
shaped by vested interests or populist politics may undermine the sector’s economic dynamism.
93 Evidence from foreign investment in services
3.1 FDi Markets data and methods
Understanding the size and composition of international trade in services is hindered by the lack
of reliable statistics. The problems are even more acute for particular subsectors, such as integrated
urban services and the built environment. This section of our paper makes use of an alternative
source of data compiled by the Financial Times and called fDi Markets. It monitors a wide variety
of news reports and industry sources to track ‘cross-border investment in a new physical project
or expansion of an existing investment which creates new jobs and capital investment’ (fDi
Markets 2019). 1 This is probably the most important of the four mechanisms by which services
are traded across international borders, and it is also the one that is not covered by conventional
databases on international trade (Bhorat et al. 2019; Hoekman and te Velde 2017).
The fDi Markets database excludes investments related to mergers and acquisitions, and therefore
represents ‘greenfield FDI’, although the two forms of investment show similar patterns.
Greenfield FDI is a better indicator of growth in jobs, investment, and markets than are takeovers,
which may occur for defensive reasons such as limiting competition. Greenfield FDI is also more
likely to be associated with the transfer of new technologies and production processes to the host
country than are changes in ownership. An independent assessment of the fDi Markets database
found it to be highly correlated with other reliable sources, such as those used in UNCTAD reports
(UN-Habitat and IHS-Erasmus University Rotterdam 2018).
The focus here is on fDi Markets data for firms based in SA that invested in the rest of Africa
during the period January 2003 to August 2019. Information is included on 492 projects altogether.
This is a sizeable number, and more than is captured by other data sources that track FDI flows.
However, it does not provide a complete account of all relevant investment. Monitoring of
professional industry reports and media sources is bound to be selective and skewed towards
bigger projects by major companies. Furthermore, some investments in urban infrastructure and
built-environment services are intangible, such as consultancy, knowledge transfer, and capacity-
building. They may not be detected unless or until they are linked to physical projects such as new
shopping centres, power stations, roads, or bridges. Consequently, the database may under-report
projects involving the provision of services. In the following analysis, greater attention is paid to
the number of projects recorded in the database than to the value of the investments or the number
of jobs directly involved. This is because the employment and investment values for most projects
were estimates and heavily dependent on modelling. 2
The amount of information provided on each project does not allow more than a fairly superficial
analysis of patterns and trends. Each project is categorized by ‘sector’, ‘cluster’, and ‘activity’. We
focus first on the clusters, because they are defined by the end-user industry and hence the ultimate
application of the investment. This provides a better indication of how investment flows are related
to regional value chains. For example, a software development subsidiary for a commercial bank
would be categorized in the ‘software and information technology services’ sector, but in the
1
fDi Markets data is sourced from numerous channels, including Financial Times newswires and internal information
sources; thousands of media sources, including all of the world’s top business sources; project data received from over
2,000 industry organizations and investment agencies; and data purchased from market research and publication
companies. Each project identified is cross-referenced against multiple sources, with a primary focus on direct
company sources.
2
Out of 493 projects, 414 (84 per cent) had estimated or modelled values for the size of capital investment.
10‘financial services’ cluster. Some clusters have been given slightly different names from those used
in the database, to better reflect the types of product and service they contain.
In the following analysis, industry clusters are further aggregated into three new, broader categories
in order to distinguish clearly between ‘commodity-based’, ‘manufacturing-based’, and ‘services-
based’ investments. We do this in order to provide a broad indication of the relative importance
of services (in terms of both trade and investment) compared with primary and secondary
industries. Investments by SA companies that supply services in other African countries offer a
useful insight into trade flows, because FDI is an important mechanism for trade in services.
Indeed, there is some evidence that this mode accounts for the majority of services trade
(Hoekman and te Velde 2017). The other three modes are the cross-border supply of services (e.g.,
through digital channels), the temporary movement of service providers (e.g., engineers or project
managers) to users/consumers in other countries, and the temporary movement of consumers to
service providers elsewhere (e.g., tourists or conference attendees).
Clusters concerned with commodities include projects involved in the production and distribution
of energy (such as oil, gas, and coal) as well as minerals, chemicals, and metals. The SA economy
has been dominated historically by mining, related heavy industries, and electricity generation—
described as the ‘minerals-energy complex’—so there are considerable technical capabilities in
these sectors (Fine and Rustomjee 1996). The country’s largest exports continue to include primary
commodities such as platinum, coal, gold, iron ore, and manganese. For several decades SA
companies have also used their expertise and capital to mine commodities in other African
countries. The recent discovery of major gas fields in Mozambique and the United Republic of
Tanzania offers considerable opportunities for SA firms to secure contracts from all the associated
economic and social infrastructure and utilities that will be required to extract and export the gas
and support the associated workforce (Planting 2019).
Clusters concerned with manufacturing include food and beverages and an all-encompassing
category called ‘other manufacturing’. This excludes the processing or ‘beneficiation’ of raw
materials, minerals, and other commodities. Manufacturing continues to be the main target of
industrial policy in SA, although the sector as a whole has performed poorly since at least the
1990s, when import tariffs were reduced and the economy was opened up to international
competition (DTI 2017; National Treasury 2019). Manufacturing in most other African countries
has also struggled in the face of global pressures, particularly from China and other emerging Asian
economies.
Clusters concerned with service industries include a variety of tradable service sectors such as
finance, telecoms/information and communications technology (ICT), construction, 3
media/marketing, tourism, transport/storage, and other business services. Services have been the
strongest-performing part of the SA economy since the 1990s in terms of output and employment
(Bhorat et al. 2019). Furthermore, most of the growth has come from the ‘modern’, higher-
productivity sectors of business, finance, and communications, rather than the ‘traditional’ and
generally non-tradable sectors of wholesale/retail and government services. Selected service
industries have grown in importance as tradable exports (especially tourism and
transport/logistics), as well as contributing to the productivity and competitiveness of primary and
3
Construction is usually classified as a secondary sector in terms of standard industry classification codes. However,
the nature of construction trade is similar to services (in that production tends to take place at the same time and
location as consumption), and construction services embody many of the activities that comprise integrated urban
services, such as engineering, surveying, architecture, design, project management, and property development.
11secondary industries through the application of knowledge, expertise, and technology (Visagie and
Turok 2019).
3.2 The pattern of investment flows from SA
Table 2 and Figure 1 show the spread of investments by SA companies into the rest of Africa over
the last 16 years, broken down into industry clusters. The dominance of services is immediately
apparent, accounting for nearly three quarters of all projects. Financial services and telecoms were
particularly important, together comprising 45 per cent of all projects. This is quite unexpected,
considering that services have traditionally been considered non-tradable and SA’s established
export strengths and industrial capabilities are in primary commodities (mining and agriculture)
and manufacturing (including food and beverages and automotive sectors). Financial services and
telecoms do not feature among the industries targeted for support or export promotion by the SA
government.
Summing up, projects in the services industries dominated FDI by SA companies over the last 16
years, particularly in terms of their number. Each project tended to be smaller in size and to create
fewer jobs than those in primary and secondary industries. Financial services alone accounted for
more than one in four FDI projects (28 per cent). The key players were Standard Bank, First
National Bank, Rand Merchant Bank, Sanlam, and Stanbic. Telecoms accounted for one in six
projects (17 per cent) and were dominated by MTN. Construction projects were the largest in
terms of jobs, although many were probably temporary. The sheer scale of services FDI is striking.
Table 2: FDI from SA into Africa, January 2003 to August 2019
No. of Percentage Size of Percentage No. of jobs* Percentage
investment of FDI capital of capital (%) of jobs (%)
projects projects (%) investment
(US$
millions)
Financial services 139 28.3% 1,503 3.9% 4,014 6.8%
Telecoms and ICT 82 16.7% 6,377 16.7% 6,482 10.9%
Minerals, 54 11.0% 4,839 12.7% 14,453 24.4%
chemicals, and
metals
Construction 38 7.7% 7,695 20.2% 16,072 27.1%
Media and 37 7.5% 426 1.1% 1,213 2.0%
Industry cluster
marketing
industries
Other business 33 6.7% 566 1.5% 931 1.6%
services
Food and 31 6.3% 1,381 3.6% 7,512 12.7%
beverages
Energy 31 6.3% 13,496 35.4% 4,240 7.2%
Tourism 22 4.5% 1,119 2.9% 2,385 4.0%
Other 15 3.0% 321 0.8% 1,105 1.9%
manufacturing
Transport and 10 2.0% 404 1.1% 875 1.5%
storage
Grand total 492 100% 38,128 100% 59,282 100%
Note: actual capital and jobs estimates are forecasted for most projects in the fDi Markets database and therefore
only indicative.
Source: authors’ compilation based on data from fDi Markets.
12Figure 1: Share of investment, capital, and jobs among cluster types
100%
90%
80%
70%
60%
50%
40%
73%
30%
54%
47% 48%
20%
32%
10%
17%
15%
9%
4%
0%
Services-based clusters Commodity-based clusters Manufacturing-based clusters
No. of investments Capital size Total jobs
Source: authors’ illustration based on data from fDi Markets.
13Figure 2: FDI by industry cluster over time
140
120
58
100
No. of investment projects
80
22
60
10
69
40
51
31 21
24 15 9 10
20 5
18 14
14 18 13
13 12 14 5
12 9
4 7 4 5
- 3 1 1
Financial Telecoms & Minerals, Construction Media & Other Bus. Energy Food & Tourism Other Transport &
Services ICT Chemicals & Marketing Services Beverages manufact. Storage
Metals
2003 - 2008 2009 - 2014 2015 - 2019
Note: FDI measured as the number of new reported projects between January 2003 and August 2019.
Source: authors’ illustration based on data from fDi Markets.
14Figure 3: Type of FDI activity within industry clusters, January 2003 to August 2019
100% 0.0
7.9 6.7
12.9
90%
0.0
0.7 24.1
0.0
35.1 35.5 33.3
80% 21.1
40.9
33.3
50.0
70% 0.0 60.0
0.0
2.7
0.0
60% 33.3 0.0
12.9 87.1 6.7
0.0
50% 2.4
50.0 0.0
12.9
86.3
40% 0.0 7.4
0.0
66.7
30% 62.2 59.1 20.0
22.6 42.7 53.3
25.9
20%
0.0
10% 21.1 0.0 20.0
16.1 12.9 0.0 9.3
4.9
0% 0.0 0.0 0.0
Business Services Construction services Extraction Telecoms & ICT Logistics Manufacturing Sales & Marketing
Note: FDI measured as the number of new reported projects between January 2003 and August 2019.
Source: authors’ illustration based on data from fDi Markets.
15The composition of FDI can be further unpacked according to the specific purpose or type of
investment, beyond the broad industry cluster or sector. For example, a beverage manufacturer
may invest in a warehouse for storage and distribution (essentially providing a service), rather than
a new processing and bottling plant (which is geared to production). Both activities still fall within
the food and beverages cluster.
Figure 3 identifies the different types of activity within each cluster. The diversity is striking,
indicating the importance of disaggregation beyond broad categories. For instance, some
manufacturing projects did not involve new factories but rather investments in business services,
logistics, or sales/marketing/support. Some construction and energy projects included
investments in processing activities or productive capacity to supply critical inputs. Many tourism
projects involved building hotels. Sales/marketing/support activities feature prominently in most
industry clusters. Firms entering new markets clearly needed to promote themselves to attract
consumers. This activity category also includes after-sales support, which is becoming vital in many
industries to ensure correct installation and use of a product, to maintain equipment or software,
to provide technical assistance and training, to ensure customer satisfaction, and to generate
further orders. Logistics services appeared to be another cross-cutting activity, since it featured in
five clusters.
Overall, the clear implication of Figure 3 is that projects involving the provision of services greatly
outweigh primary (mining/extraction) and secondary (manufacturing) activities. The conclusion
would be similar if the analysis were to be repeated using investment values or job numbers instead
of the number of projects.
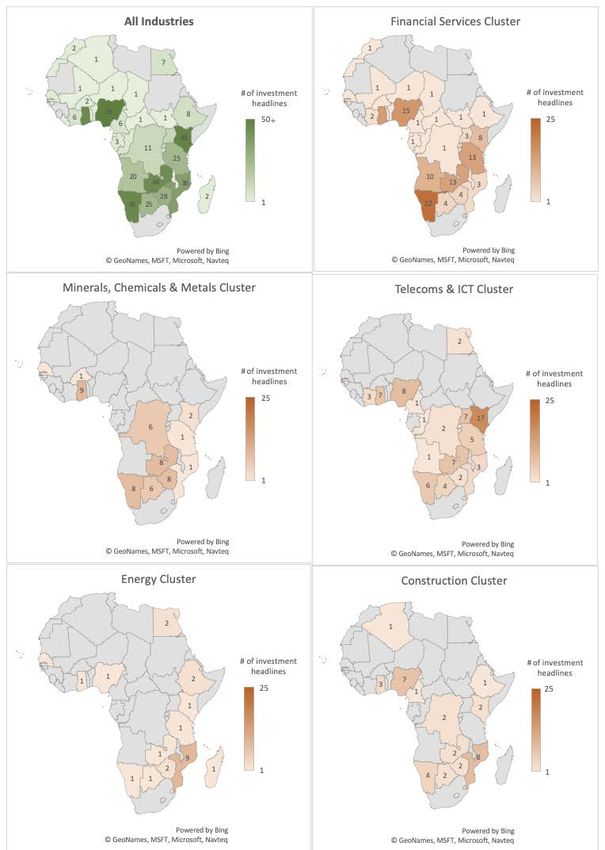
The strength of FDI flows to other countries appears to be closely related to (i) their physical
proximity to SA and (ii) their market size. Figure 4 shows the destinations of all 492 projects. The
majority took place in the neighbouring countries of Botswana, Mozambique, Namibia, Zambia,
and Zimbabwe. Ease of access and knowledge of local market conditions, regulations, and business
practices are bound to have been important. The other group of host countries was the relatively
large economies of Ghana, Kenya, and Nigeria, where market size is bound to have been the
attraction. Projects related to financial services and telecoms were the most widespread of all
clusters, reaching into most countries in Southern Africa. In contrast, projects in energy and
minerals/chemicals/metals were restricted to a handful of countries. The energy projects in
Mozambique were concerned with the extraction of gas and coal. There were very few projects in
North Africa, apart from seven in Egypt.
To summarize, the fDi Markets data shows that SA companies invested extensively in other
African countries over the last 16 years. Projects involving the provision of services were far more
numerous than those involving manufacturing and the mining of commodities. They were also
more dispersed geographically and appear to have provided more jobs overall. Projects involving
commodities and manufacturing were fewer in number but larger in size on average. Financial
services and telecoms projects were the most numerous and most widespread. Construction
projects provided the most jobs, although many of these were undoubtedly temporary.
16Figure 4: Spread of investment flows from SA into Africa
Note: number of new projects between January 2003 and August 2019.
Source: authors’ illustration based on data from fDi Markets. Maps developed with Microsoft Office Excel, with
assistance of Bing. © GeoNames, MSFT, Microsoft, Navteq.
173.3 Integrated urban services
Projects within the construction cluster correspond most closely to our interest in integrated urban
services and the built environment. Projects within telecoms/ICT, financial services, other
business services, transport/storage, and energy clusters could also be relevant to the planning,
financing, delivery, and maintenance of urban infrastructure, utilities, and buildings. Referring back
to the activities involved in the construction cluster shown in Figure 3, construction services
dominated, along with some manufacturing (producing cement and other building materials) and
other business services (engineering, surveying, and management consultancy). As much as half of
telecoms/ICT projects could relate to the installation of related infrastructure (such as mobile
phone towers and fibre networks).
Table 3 provides a complete list of projects from the construction cluster as recorded in the
database. The number of projects increased over time, with a noticeable step change after 2012.
Evidence from company interviews (discussed below) suggests that SA contractors were focused
inwards in the run-up to the 2010 Fifa World Cup, when there was a boom in domestic spending
on transport infrastructure, football stadia, and hotels. Economic conditions deteriorated
thereafter, causing building contractors and professional service providers to look north of the
border for new customers and markets.
Closer inspection reveals many different companies offering a wide range of goods and services.
Projects include the manufacture and distribution of construction materials (including the cement
producer PPC in the Democratic Republic of the Congo (DRC), Ethiopia, Rwanda, and
Zimbabwe), commercial property development (shopping malls by Atterbury and Novare Equity
Partners in Namibia, Nigeria, Mauritius, and Mozambique) and infrastructure delivery (heavy/civil
engineering by Aveng and Murray & Roberts in the DRC, Ghana, Mozambique, and Zambia).
Many firms established a commercial presence in the host country (e.g., sales and marketing by
Murray & Roberts). Some offered related business services (such as engineering consulting by
Aveng, or project management by Profica). Others undertook to manufacture materials (such as
cement production by AfriSam and PPC), as well as doing construction work itself.
Table 3 also draws attention to certain limitations of the database in only capturing 38 projects in
the construction cluster over the whole period. This understates the full extent of FDI activities
by SA firms, presumably because some projects were not reported in the media or in professional
sources. For example, several company interviews suggested that the number of shopping malls
or office blocks constructed exceeded the figures reported in the database. Nevertheless, the
database provides useful insights into the scale, scope, and character of FDI by SA companies,
including concrete examples of many different kinds of project. It shows that firms have been
actively investing in other African countries across a wide range of industrial and commercial
enterprises and support functions. Services constitute a major part of these activities, rather than
a subordinate contribution.
18Table 3: Construction cluster: FDI from SA into Africa, January 2003 to August 2019
Date Investing company Country City Industry sector Subsector Industry activity Capital Jobs
Sep 2003 Johnnic Nigeria Unspecified Real estate Commercial building construction Construction 122* 875*
May 2004 Gensec Property Services Namibia Oshakati Real estate Real-estate services Business services 36* 20*
May 2004 Gensec Property Services Namibia Windhoek Real estate Real-estate services Business services 36* 20*
Oct 2008 Redefine Income Fund Namibia Windhoek Real estate Real-estate services Construction 198 1412*
Oct 2008 Liberty Group Properties Zambia Lusaka Real estate Real-estate services Construction 200 1430*
Jul 2009 PPC Botswana Gaborone Building materials Cement and concrete products Manufacturing 160* 342*
Dec 2009 New Paint Manu. Co. Ghana Unspecified Chemicals Paints, coatings, additives, Manufacturing 162* 149*
and adhesives
Jun 2011 Atterbury Prop. Dev. Mauritius Unspecified Real estate Commercial building construction Construction 865* 875*
Jan 2012 Centurion Systems Nigeria Lagos Building materials Building materials Sales, marketing, and 1* 8*
support
Aug 2012 Resilient Africa Nigeria Owerri Real estate Commercial building construction Construction 44 259*
Aug 2012 Murray & Roberts Zambia Kitwe Business services Heavy and civil engineering Business services 23* 33*
Aug 2012 Murray & Roberts Ghana Accra Business services Heavy and civil engineering Business services 23* 33*
Feb 2013 Delico Prop. Dev. Ghana Accra Real estate Commercial building construction Construction 668* 733*
Mar 2013 Atterbury Prop. Dev. Namibia Windhoek Real estate Commercial building construction Construction 91 535*
May 2013 PPC DRC Unspecified Building materials Cement and concrete products Manufacturing 200 397*
May 2013 Aveng Group Mozambique Maputo Business services Heavy and civil engineering Business services 23* 33*
Oct 2013 Murray & Roberts Mozambique Unspecified Business services Heavy and civil engineering Business services 23* 33*
Feb 2014 Hodna Cement Company Algeria Sétif Building materials Cement and concrete products Manufacturing 350 695*
Apr 2014 Atterbury Prop. Dev. Mozambique Beira Real estate Other (real estate) Construction 668* 733*
Apr 2014 Atterbury Prop. Dev. Mozambique Nacala Real estate Other (real estate) Construction 668* 733*
Apr 2014 Atterbury Prop. Dev. Mozambique Pemba Real estate Other (real estate) Construction 668* 733*
May 2014 PPC Zimbabwe Harare Building materials Cement and concrete products Manufacturing 80 159*
Sep 2014 PPC Ethiopia Unspecified Building materials Cement and concrete products Manufacturing 175 348*
Sep 2014 PPC Rwanda Unspecified Building materials Cement and concrete products Manufacturing 170 338*
Jul 2015 Chryso Kenya Nairobi Chemicals Paints, coatings, additives, Sales, marketing, and 13* 51*
and adhesives Support
Aug 2015 Terrace Africa Mozambique Tete Real estate Commercial building construction Construction 668* 733*
Feb 2016 Murray & Roberts DRC Unspecified Business services Heavy and civil engineering Sales, marketing, and 8* 16*
support
Mar 2016 Stanlib Kenya Athi River Real estate Commercial building construction Construction 12 70*
19Jul 2016 Shoprite Mozambique Unspecified Real estate Commercial building construction Construction 668* 733*
Jun 2017 Afrisam Lesotho Unspecified Building materials Cement and concrete products Manufacturing 151* 404*
Nov 2017 Novare Equity Partners Nigeria Abuja Real estate Commercial building construction Construction 115* 733*
Dec 2017 Novare Equity Partners Mozambique Maputo Real estate Commercial building construction Construction 47 276*
Jan 2018 Raubex Renovo Cameroon Douala Real estate Commercial building construction Construction 53 311*
Jul 2018 Novare Equity Partners Nigeria Abuja Real estate Commercial building construction Construction 54 317*
Jul 2018 Novare Equity Partners Nigeria Unspecified Real estate Commercial building construction Construction 115* 733*
Jul 2018 Novare Equity Partners Nigeria Abuja Real estate Commercial building construction Construction 115* 733*
Mar 2019 Speedspace Botswana Francistown Real estate Real-estate services Business services 1* 3
May 2019 Profica Zimbabwe Unspecified Business services Real-estate services Business services 23* 33*
Note: *estimated data. Capital values in US$ millions.
Source: authors’ compilation based on data from fDi Markets.
204 The experience of individual companies
The discussion in this section is organized around a series of propositions emerging from
interviews with companies and related evidence.
4.1 There is growing demand for tradable urban services in Africa
International organizations such as the United Nations and World Bank have done much to raise
awareness of the need to boost investment in urban infrastructure and to transform the
management of fast-growing African cities to make them more productive and liveable. The
opportunities for global corporations to access burgeoning middle-class urban consumers have
been highlighted by various management consultancies (Ernst and Young 2011; McKinsey 2010;
Monitor 2009; Turok 2013). The prospects for Africa to benefit from technological change,
regional integration, and natural resource discoveries have also been emphasized (Brookings
Institution 2020). The International Energy Agency (2019) predicts that Africa will be the world’s
biggest new energy market because of the burgeoning urban population, creating major
opportunities for the supply of renewable energy as well as fossil fuels. Organizations such as the
AfDB have recently gone further by organizing investment forums to bring together bankers,
lenders, investors, project developers, and governments across the continent to network, discuss
opportunities, and sign deals. Before that, the establishment of the New Partnership for Africa’s
Development in 2001 and the African Union in 2002 were important in creating a new policy
context for trade between African countries.
As a relatively developed economy with advanced industrial capabilities, SA appears well placed to
function as a springboard for the provision of all kinds of goods and services. Many SA firms have
been aware of the opportunities 4 and taken active steps to enter these markets (Games 2004).
Many others still appear to regard the rest of Africa as a high-risk frontier market and something
of an unknown quantity for investment. Their senior executives do not seem to have travelled
much to other African countries and do not understand the risks, or the disproportionate rewards
that accompany higher risks (Buker and Hewson 2020; Games 2019). Many SA companies prefer
to seek safer and more predictable returns at home or in Australia, Europe, or North America.
There has been no concerted drive by the SA government in recent years to partner with the
private sector in promoting fresh thinking and new initiatives to strengthen trade and investment
with other African countries.
SA financial services companies appear to have been relatively active elsewhere in Africa,
recognizing gaps in the provision of services such as commercial and retail banking (Standard Bank
and Absa), insurance, and pensions (Sanlam and Liberty). Standard Bank claims to be Africa’s
largest lender and generates about a third of its headline earnings outside SA (Standard Bank 2018).
Its African expansion began in 1992 when it acquired Grindlays, which had operations in seven
countries. Standard Bank’s most significant recent initiative is to finance several major liquefied
natural gas (LNG) projects in Mozambique. It is the largest commercial lender on these projects,
with loans of several billion dollars, underwritten by export credit guarantees from the SA
government (Creamer 2019; Planting 2019). Meanwhile, insurance group Sanlam has major
4
For example, the property investor and developer Novare (2020) states on its website: ‘There are 52 African cities
with a population of more than a million, equalling Europe, and surpassing India which has 48. Modern retail facilities
in urban areas are few and far between in sub-Saharan Africa. In the US in 2010 there were 2.5 m² per capita of
modern retail space. The corresponding figure for Europe was 1.5. For Zambia it was 0.0029 and for Nigeria, with its
massive potential market, 0.0005. The continent’s rising middle class is increasingly demanding improved retail
experiences.’
21You can also read