An analysis of online shopping and home delivery in the UK Julian Allen, Maja Piecyk and Marzena Piotrowska University of Westminster Carried out ...
←
→
Page content transcription
If your browser does not render page correctly, please read the page content below
An analysis of online shopping and home delivery in
                       the UK

                                       by

 Julian Allen, Maja Piecyk and Marzena Piotrowska

                    University of Westminster

  Carried out as part of the Freight Traffic Control
                 (FTC) 2050 project

                           23 February 2017

allenj@westminster.ac.uk; m.piecyk@westminster.ac.uk; m.piotrowska@westminster.ac.uk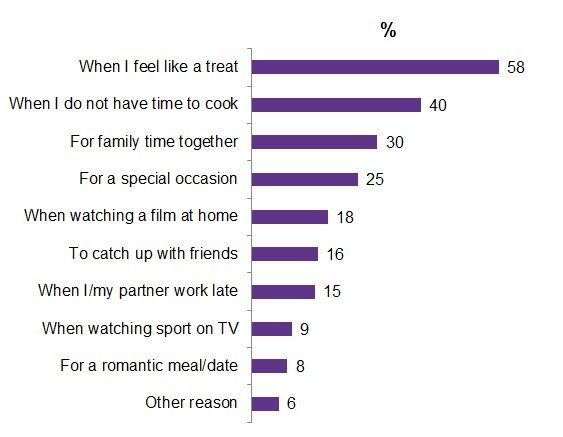
ABOUT THE FREIGHT TRAFFIC CONTROL 2050 (FTC2050) PROJECT

This report has been produced as part of a research project entitled “Freight Traffic Control
2050 (FTC2050): Transforming the energy demands of last-mile urban freight through
collaborative logistics”. It is an EPSRC-funded project that began in April 2016 and will run for
36 months.

Freight transport currently makes up around 16% of all road vehicle activity in our cities and
by 2030, the EU would like to see largely CO2-free logistics systems operating in our urban
centres. With van traffic predicted to increase by 20% in London by 2030, and the uptake of
alternatively fuelled and electric goods vehicles slow, more radical strategies are needed to
reduce the numbers and impacts of freight vehicles in our cities.

Working with parcel carriers in London, this project will examine the potential for closer
operational collaboration between carriers to reduce urban traffic and energy demand whilst
maintaining customer service levels, and evaluate to what extent such relationships can
develop naturally within a commercial setting or whether a 3rd party ‘Freight Traffic Controller’
(FTC) would be necessary to ensure equitable distribution of demand across a city. The key
research objectives are to:
1. Investigate the collective transport and energy impacts of current parcel carrier activities
   in urban areas;
2. Create a database to gather and interrogate collection and delivery schedules supplied by
   different carriers;
3. Use the data with a series of optimisation algorithms to investigate the potential transport
   and energy benefits if carriers were to share deliveries and collections more equitably
   between them and develop tools to help visualise those benefits;
4. Evaluate what business models would be needed to enable carriers to collaborate in this
   way;
5. Investigate the role a 3rd party 'Freight Traffic Controller' could play in stimulating
   collaboration between carriers to reduce energy demand and vehicle impacts across a
   city;
6. Identify the key legal and privacy issues associated with the receipt, processing and
   visualisation of such collaborative schedules;
7. Consider the wider application of this approach to other sectors of the urban freight
   transport market.
The project is a multidisciplinary collaboration, led by the University of Southampton’s Faculty
of Engineering and the Environment (CEE), and involving the Southampton Business School
(SBS), Lancaster University’s School of Computing and Communications and Data Science
Institute (LU), the University of Westminster’s Faculty of Architecture and the Built
Environment (UoW) and University College London’s Bartlett Centre for Advanced Spatial
Analysis (CASA). Two major carriers (TNT and Gnewt Cargo, (the latter operating for DX and
Hermes)) have agreed to participate in the research along with Transport for London (TfL).

For further information about the FTC2050 project please visit the project website at:
http://www.ftc2050.com/

The Principal Investigator of the project is Professor Tom Cherrett
(T.J.Cherrett@soton.ac.uk Tel: + 44(0)23 80594657)
CONTENTS                                                                            Page no.

1.       Introduction                                                                          1

2.       The online shopping market in the UK                                                  2
2.1      Size and importance of the online shopping market                                      2
2.2      Online shopping market by sector                                                       3
2.3      Online shopping market by product category                                             5
2.4      Leading retailers in the online shopping market                                        6
2.5      Forecasts of the online shopping market                                                7
2.6      Consumer use of online shopping services                                               7
2.7      Online non-food shopping market                                                        8
2.8      Online grocery shopping market                                                        10
2.8.1    Store-based and online-only grocery retailers                                         11
2.8.2    Smaller and non-specialist retailers                                                  13
2.9      Takeaway and other restaurant home-delivered meals market                             13
2.9.1    The “food-to-go” market                                                               16
2.9.2    Consumer use of takeaway & other restaurant home-delivered meal services              17
2.9.3    Consumer ordering methods                                                             17
2.9.4    Online functionalities being developed and demanded                                   18
2.10     Profitability in online shopping and home delivery                                    19
2.11     Methods by which online retailers could increase profitability                        23

3.       Home delivery of online shopping                                                      25
3.1      Overview of home delivery operations supporting online shopping                       25
3.2      Click & Collect services, collection points and locker banks                          30
3.3      Returns of online shopping                                                            34
3.4      Delivery passes                                                                       35
3.5      Crowdshipping                                                                         36
3.6      Employment status of those making home deliveries                                     40
3.7      Logistics land use, fulfilment centres and home delivery services                     41
3.8      Delivery operations for non-food online shopping                                      44
3.8.1    Pressures in non-food home delivery operations                                        44
3.8.2    Home delivery services offered by retailers of large non-food items                   47
3.8.3    Home delivery services offered by retailers of small non-food items                   49
3.8.4    The scale of non-food deliveries by parcel                                            52
3.8.5    Seasonal fluctuations in parcel volumes                                               53
3.8.6    Meeting time window constraints                                                       54
3.8.7    Failed deliveries                                                                     56
3.8.8    Returned products                                                                     56
3.8.9    Developments in non-food delivery locations                                           57
3.8.10   Industry views on the immediate future of non-food deliveries                         60
3.8.11   Collaboration in the parcels sector                                                   61
3.9      Home delivery operations for online grocery shopping                                  62
3.9.1    Overview of grocery home delivery operations                               62
3.9.2    Consumer views about grocery home delivery services                        63
3.9.3    Recently introduced grocery delivery service innovations                   64
3.10     Delivery operations for takeaway & other restaurant home-delivered meals   65
3.10.1   Types of takeaway and restaurant home-delivered meal service providers     65
3.10.2   Home delivery services provided by takeaways and restaurants               66

4.       The future of online shopping and its impacts                              71
4.1      Home delivery operations and their patterns of transport activity          71
4.2      Traffic and environmental impacts of online shopping                       73
4.3      Consumer transport in the delivery of online orders to their home          74
4.4      Short- to medium-term developments in home delivery operations             75
4.5      Potential longer-term developments in online shopping and delivery         78

         REFERENCES                                                                 81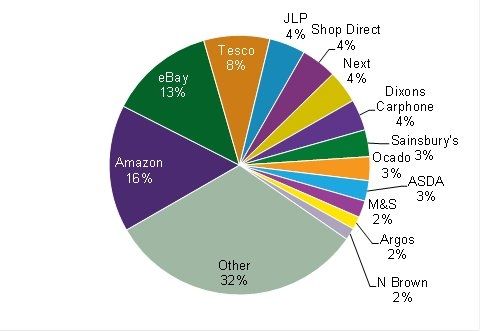
1. INTRODUCTION

This report contains a review and analysis of online retail shopping and home delivery
operations in the UK. It has been carried out as part of the EPSRC-funded Freight Traffic
Control (FTC) 2050 project, which is investigating the scope for collaboration in order to
facilitate greater efficiency in urban freight transport and logistics activities, and thereby
reducing the cost of these operations to companies (resulting in greater profitability) while at
the same time improving the sustainability of these operations in terms of road traffic levels,
traffic casualties, CO2 and air pollution emissions. See the website for further details of the
project: http://www.ftc2050.com/

Section 2 presents information and data about the online shopping market in the UK,
comprising the non-food, grocery, and takeaway food and home delivered meals sectors in
the UK. It presents the sales revenue and growth rate of the online shopping market as a
whole, as well as in these three sectors, together with insight into leading retailers and
forecasts of growth. Consumers’ views and concerns about online shopping are also
discussed. It also addresses the issue of profitability for retailers and logistics carriers in the
various online shopping sectors, and considers how profitability can potentially be enhanced.

Section 3 considers the home delivery requirements and operations that support the online
shopping market in the UK, comprising the non-food, grocery, and takeaway food and home
delivered meals sectors in the UK. Insight is provided into differences and similarities in
logistics and home delivery operations in these three sectors. General developments in
logistics and delivery operations that support online shopping are presented, together with
detailed insight into innovation and challenges in each of the three sectors.

Section 4 analyses the current traffic and environmental impacts of home delivery activities in
the UK, and together with possible future developments in online shopping and home delivery
operations and their likely traffic and environmental impacts.

                                                1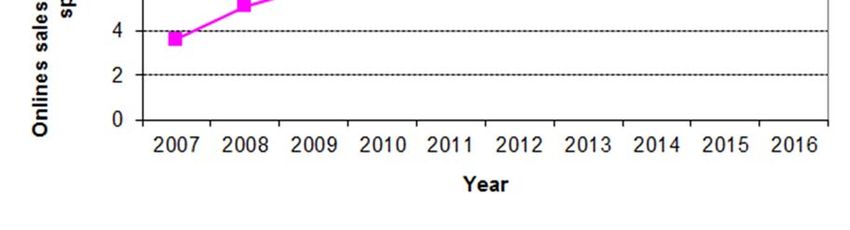
2. THE ONLINE SHOPPING MARKET IN THE UK

2.1 Size and importance of the online shopping market

Survey work by the Office for National Statistics (ONS) shows that online shopping accounted
for 14.2 per cent of all retail spending in the UK in July 2016. This is equivalent to
approximately £50 billion per year (ONS, 2016). The growth in the proportion of total retail
sales accounted for by online shopping has been rapid in recent years (see Figure 2.1).
Substantial growth in online retail spending is continuing with an increase of 17.3 per cent in
the average weekly spend between July 2015 and July 2016 (ONS, 2016). This ONS survey
work involves among 5,000 retailers including all large retailers and a panel of smaller retailers
and covers all sectors of the retail industry. ONS estimates that the survey respondents cover
approximately 90% of all known UK retail turnover.

Figure 2.1: Online sales as a percentage of total retail spending in the UK, 2007-2016

Note: data is for end of July in each year.
Source: produced from data provided in ONS (2016)

Another survey of online shopping in the UK by the Interactive Retail Media Group (IMRG)
and Capgemini provides a significantly greater total market size estimate than the ONS survey
work (approximately twice as large). This IMRG and Capgemini survey work showed that £104
billion was spent online in the UK in 2014 (which is more than double the amount spent in
2009). This accounted for 24% of the total retail market (compared to 13% in the ONS survey).
There was a 14% growth in the UK online retail market between 2013 and 2014 (IMRG and
Capgemini, 2015). However, this IMRG and Capgemini market estimate includes non-physical
retail sales which are not included in the ONS survey (such as travel and hotel sales, the sales
of electronic games and music).

The IMRG and Capgemini survey also showed that online sales via smartphones and tablet
devices accounted for 37% of online sales in the UK in 2014 and represented a 55% growth
compared with the previous year (IMRG and Capgemini, 2015).

                                                2
2.2 Online shopping market by sector

Most important in terms of online retail spending in the UK is the non-store retailing sector,
with online spending accounting for 78 per cent of total spending in this sector in July 2016.
In the food sector 4.7 per cent of total spending was online in July 2016, and was 10.6 per
cent in non-food store sector – see Table 2.2 which shows the importance of online shopping
in various retail outlets in the UK in July 2016. (ONS, 2016).

Table 2.2: Online retail sales in the UK by sector in 2015 (seasonally adjusted)

Type of retailing               Type of non-food store              Annual         Proportion of all
                                                                    sales in       UK online sales
                                                                     2015*
Predominantly food
                                                                    £6.4 billion             14.4%
stores
                          Non-specialised stores                    £3.6 billion              8.9%
                          Textile, clothing and footwear stores     £5.9 billion             12.0%
Predominantly non-food
                          Household goods stores                    £2.3 billion              6.1%
stores
                          Other stores                              £3.5 billion              8.1%
                          SUB-TOTAL                               £15.3 billion              35.1%
Non-store retailing                                               £20.8 billion              50.4%
TOTAL***                                                          £42.5 billion             100.0%

Notes:
* - grossed up from seasonally-adjusted weekly sales (thereby removing calendar and seasonal
effects).
** - Data is based on July 2016 and is seasonally-adjusted.
*** - Total is for all retailing excluding automotive fuel.

Source: calculated from data in ONS, 2016.

Table 2.3 shows the importance of online sales in the various retail outlets as a proportion of
total retail spending in each outlet type in the UK.

                                                3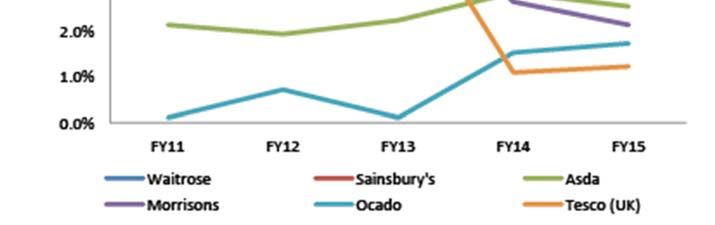
Table 2.3: Online retail sales as a proportion of total retail sales in each type of retail
outlet in the UK in 2016

         Type of                      Type of non-food store                    Proportion of all
         retailing                                                              UK retail sales in
                                                                                  this sector
         Predominantly
                                                                                        4.7%
         food stores
                              Non-specialised stores                                   12.6%
                              Textile, clothing and footwear stores                    12.7%
         Predominantly
                              Household goods stores                                    9.3%
         non-food stores
                              Other stores                                              8.0%
                              SUB-TOTAL                                                10.6%
         Non-store
                                                                                       78.9%
         retailing
         TOTAL**                                                                       14.2%

Notes:
* - grossed up from seasonally-adjusted weekly sales.
** - Total is for all retailing excluding automotive fuel.
Data is for end of July 2016.
Source: calculated from data in ONS, 2016.

The ONS data presented in Tables 2.2 and 2.3 do not provide a breakdown of non-food online
sales into items of differing sizes, nor does it provide sales of takeaways and other home-
delivered meals. In addition, the food stores in Tables 2.2 and 2.3 do not include sales by
online-only retailers. Table 2.4 provides an estimate of total online shopping sales in the UK
in 2015 by product type (and size in the case of non-food items), which includes the sales of
groceries, non-food small items, non-food large items (which are defined as items that require
a two-person crew to deliver them), and home-delivered and takeaway meals sector (which is
not included in ONS online shopping sales data). This provides an estimate of total annual
online retail sales in these product categories of £51.4 billion in 2015/6.

Table 2.4: Estimated online retail sales in the UK in 2015/6 by sector and product type

Type of online retailing sector/product                      Annual sales (£)         Annual sales (%)
Grocery *                                                        £8.6 billion                  17%

Non-food small items**                                          £31.8 billion                  62%

Non-food large items***                                          £4.3 billion                  8%
Takeaway and other home-delivered                                                              13%
                                                                 £6.7 billion
meals****
TOTAL                                                          £51.4 billion                 100%

Notes:
* - see section 2.8 for further details of this estimate (Source: Mintel, 2016c)).
** - see section 2.7 for further details of this estimate (Calculated from ONS, 2016 & Verdict, 2016a).
*** - see section 2.7 for further details of these estimates (Source: Verdict, 2016a).
**** - see section 2.9 (Source: Fedor, 2016 from Euromonitor).
Source: calculated from data in ONS, 2016; Fedor, 2016; Verdict, 2016a.

                                                      4
Table 2.4 covers the main sectors of online shopping that involves physical goods being
delivered to consumers’ homes. In addition, many non-physical goods are ordered online that
do not require delivery such as insurance, holidays, passenger travel and electronic book and
music downloads. There are also additional services that are delivered to consumers’ homes
such as ordering chefs who cook in your home for you (provided by companies including
MyChef, La Belle Assiseste, CooksatHome, and Home-Cooking), events planners that will
organise events for any occasion for you at your home, and companies that can make
arrangements to pick- up and deliver whatever you need at home (from meals at any
restaurant, to goods from any shop, to keys you left in a friend’s home, to gifts you need
purchased, to medicines from a chemist, to dry cleaning you need collecting - companies
providing such services include such as Henchman and Quiqup). As part of its vision, Quiqup
aims to encourage the use of independent local retailers and businesses (similar to Postmates
in America), and also makes home deliveries on behalf of some restaurants listed on online
meal platform provider Hungry House (Highfield, 2016; Kamsyn, 2016; O’Hear, 2017).

Year on year growth in online food retailing to July 2016 was estimated to be 13.4 per cent,
non-food online retailing to be 18.4 per cent, and non-store online retailing to be 17.7 per cent
(ONS, 2016).

In terms of total online sales, non-store retailing is getting close to equalling store retailing in
the UK. In 2011 non-store retailers (also referred to as ‘pure players’) accounted for 45% of
total online retail sales in the UK. By 2015 this had risen to 49% of total online retail sales.
See Figure 2.2.

Figure 2.2: Online sales in the UK: Store retailers versus non-store retailers

Source: Calculated from data in ONS, 2016.

2.3 Online shopping market by product category

At the onset of online shopping in the UK in the 1990s, clothing and footwear was the most
important category in terms of total sales. However, over the intervening two decades, the
picture has changed, and electrical goods now represent the largest category in terms of retail

                                                 5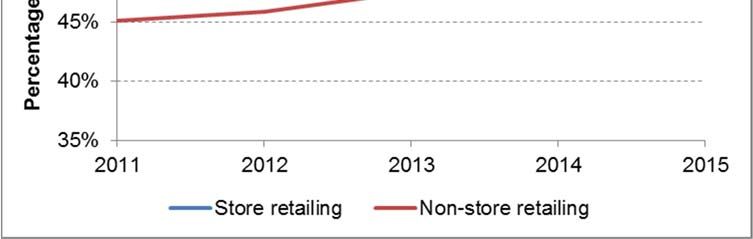
sales. These two product categories together with groceries accounted for approximately 75%
of total online retail sales in the UK in 2015 (see Table 2.5).

Table 2.5: Online retail sales by product category in the UK in 2015

       Product category                 Total annual sales      Proportion of online
                                            (£ million)           retail sales (%)
       Electrical/electronic goods             12,390                   29.1%
       Clothing and footwear                   10,647                   25.0%
       Grocery*                                 8,620                   20.3%
       Furniture                                1,185                    2.8%
       Cosmetics and toiletries                   967                    2.3%
       Hard-copy books                            633                    1.5%
       Hard-copy music and video                  545                    1.3%
       All other categories                     7,564                   17.8%
       Total of above                          42,550                    100%

Source: Mintel, 2016a.

2.4 Leading retailers in the online shopping market

Within the online retailing market there are approximately a dozen major retailers (with market
shares of 2 per cent or greater), together with hundreds of medium-sized retailers and
thousands of small ones. eBay (which accounted for 13% of online retail sales in the UK in
2015) is itself made up of thousands of small retailers together with many more private
individuals (so comprising both business-to-consumers (B2C) and consumer-to-consumer
(C2C) sellers). The same is true of the largest online retailer in 2015, Amazon, which both
sells direct to consumers (B2C) but also offers its Amazon marketplace as a selling platform
for thousands of small businesses and private individuals (B2C and C2C). Figure 2.3 shows
the breakdown of market share in online retailing in the UK.

Figure 2.3: Share of all online retail sales for the leading online retailers, 2015

Source: Mintel, 2016a.

                                              6
2.5 Forecasts of the online shopping market
It is likely that the absolute and relative importance of online sales will continue to increase in
future, albeit at a slower rate than in the last decade. The following factors are likely to play
an important role in the future growth of online shopping (European Commission, 2012):
New demand: ageing of the population
Older people discover the convenience of internet ordering
Young people used to internet and remote ordering by the internet
Traditional shopping (bricks and mortar) is hit by the economic crisis and the competition
of online shopping: number of shops reduce
Certain goods, such as groceries which only have a small relative online presence, will
increase, considering the above mentioned factors
The use of smart phones to purchase goods online will continue to grow making shopping
at home and on the move more convenient and easier
Forecasts suggest that growth in online shopping sales will remain strong in the UK between
2016 and 2021, averaging between 10-12% sales growth per annum. Online shopping’s share
of all retail goods sales has grown by about 1 percent per annum in recent years in the UK.
The relative importance of online shopping is likely to continue to increase over the next five
years but the rate of change of this relative importance is likely to slow rather than accelerate
(Mintel, 2016a). This will result in a growing volume of home delivery activity, but not all online
sales growth will necessarily result in greater home delivery activity, as some items will be
fulfilled electronically (such as book and music downloads), or through store-based ‘Click &
Collect’ and other collection services.
It is estimated that there were 36.4 million online shoppers in the UK in 2014, with the number
forecast to increase to 41.1 million by 2019 (Verdict, 2014). A recent UK survey showed that
when asked about their main reasons for shopping online, 95 per cent of respondents
mentioned convenience and flexibility, 92 per cent mentioned the range of products available,
82 per cent mentioned price, 43 per cent mentioned speed, and 41 per cent mentioned online
reviews (Royal Mail, 2014). A major deterrent to those not using online shopping services is a
concern about fraud and the security of online card payments. A European survey in eight
countries of why people did not shop online showed that the most common deterrent was that
people liked to browse the goods in store. However the second greatest deterrent was these
security concerns, with between 30 per cent of respondents (in the Netherlands) and 59 per
cent of respondents (in France) citing them (Verdict, 2011).
Online shopping currently remains largely domestic. Consumers are more likely to purchase
online from national sellers/providers (39 per cent) than from sellers located in other EU
countries (10 per cent) (European Commission, 2012). But this will probably change in the
future.
2.6 Consumer use of online shopping services
Online shopping has become widely used by UK consumers. Recent research indicated that
95% of all UK consumers have made use of online shopping in the previous 12 months (Mintel,
2016a). Key reasons for the growth on online shopping in the UK include the product range
available, the prices offered by retailers and the convenience of the ordering and delivery
services, which save time and the need to physically shop. The availability and uptake of
required technologies (including computers, tablets and mobile phones) has facilitated this
growth in online shopping in the UK. Research suggests that computers are the most common
technology used by consumers to place online orders, followed by smartphones and tablets.
7The vast majority on online orders are placed by consumers while at home. However, in the
case of online orders placed by smartphone, approximately one third of consumers have used
these to place orders while away from their home – most of these consumers placing orders
while away from home are aged below 35 years (Mintel, 2016a).
In the case of takeaway and other home-delivered meal services, unlike other types of online
shopping, consumers still more commonly use the telephone to place their orders for
takeaway/home delivered meals rather than ordering on computers, based on the perceived
ease/convenience of this method. However, online ordering has been increasing, and is
expected to continue to do so (Mintel, 2016b).
In terms of online grocery shopping, people aged under 35 are far more likely to be ordering
food in this way than older people, and are also likely to place more frequent such orders
(Mintel, 2016c). In addition, parents with dependent children are more likely to use online
grocery shopping compared with adults without dependent children (Mintel, 2016c). This is
presumably a reflection of the availability of time available for shopping among these different
groups of consumers.
As discussed in section 2.3 the three most important physical product categories in terms of
online shopping are: i) electrical/electronic goods; ii) clothing and footwear, and iii) grocery.
These three product categories were responsible for approximately three-quarters of total UK
online spending on physical products in 2015 (Mintel, 2016a). Research indicates that
approximately three-quarters of consumers using online shopping are using it to purchase a
specific product, while two-thirds browse between retailers while shopping online (Mintel,
2016a).
2.7 Online non-food shopping market
Data indicates that 58% of the total sales of non-food online shopping in the UK in 2015 was
spent with non-store (i.e. online-only, pure-play) retailers, while 42% billion was spent with
store-based online retailers (ONS, 2016).
Non-food large items include furniture, white goods (fridges, freezers, washing machines,
dishwashers etc.), other large electrical goods, carpets and garden furniture and equipment.
For the purposes of this report, large products are defined as those that require delivery to
consumers in large goods vehicles using two-person crews. Meanwhile small items, in the
context of this report, are defined as all other non-food products, which are typically
transported as parcels and small packages. These small items are typically delivered to
consumers in vans (and sometimes in cars and on motorbikes) by a single person.
Estimates of the size of the online shopping market in the UK in 2016 for large items is shown
in Table 2.6. This indicates that total online sales of large, non-food items were £4.3 billion in
the UK in 2016.
8Table 2.6: Online sales of large items delivered by two-person delivery crews in the UK
in 2016
Type of large item Online sales in 2016 Proportion (%)
(£ million)
DIY & gardening 274 6%
Electricals 2,420 57%
Furniture & floorcoverings 1,472 34%
Homewares 116 3%
TOTAL 4,282 100%
Source: calculated from data provided in Verdict, 2016a.
ONS has estimated that annual online sales of non-food products (from both online-only and
store-based retailers) were £36.1 billion in 2015 (ONS, 2016). This includes both large and
small non-food items. By subtracting the above estimate of large non-food online sales from
this it is possible to derive an estimate for total online sales of small non-food items in the UK
in 2015/6 – which is £31.8 billion.
Table 2.7 provides an estimate of the size of the online shopping market for small items in the
UK in 2016 sub-divided into those that are letterbox-sized, those of shoe-box size and those
that are larger parcels and packages (but which still only require a delivery by a single person).
Table 2.7: Online sales of small items delivered in the UK in 2016
Product Online sales (£ million) Proportion
of total
online
sales (%)
Letterbox
Shoebox
TOTAL
Larger
Books 42% 33% 25% 1,152 3.1%
Clothing & footwear 6% 34% 60% 12,899 34.9%
DIY & gardening 5% 41% 54% 844 2.3%
Electricals 2% 33% 66% 7,580 20.5%
Furniture & floorcoverings 0% 0% 100% 552 1.5%
Health & beauty 18% 51% 31% 1,386 3.7%
Homewares 2% 32% 66% 1,656 4.5%
Music & film 70% 19% 11% 511 1.4%
Proportion of total 8% 34% 59% 100% 100.0%
Source: calculated from data provided in Verdict, 2016a.
92.8 Online grocery shopping market
Store-based food and drink shopping in the UK is a major retail sector. In 2015 it was estimated
to have generated £150 billion of sales. It comprises three key sub-sectors: (i) non-specialised
food stores (i.e. grocery supermarkets, high street food stores, and convenience food stores),
(ii) specialist food stores, and (iii) alcoholic drinks, other beverages and tobacco stores. The
importance of these three types of stores sellers in terms of annual sales are shown in Table
2.8.
Table 2.8: Importance of types of stores in total store-based food and drink sales in the
UK, 2015
Food store type Annual sales Proportion of total
(£ million) store-based sales
Non-specialised food stores 139.1 92.7%
Specialist food stores 8.1 5.4%
Alcoholic drinks, other beverages
2.8 1.9%
and tobacco stores
TOTAL 150.0 100%
Source: ONS, 2016.
The online grocery and food shopping market in the UK has become a small but established
part of total food sales over recent years. It was estimated to have generated total annual
online sales from store-based retailers of approximately £6.4 billion in 2015, which was
estimated to account for 4.3% of total food sales in the UK in 2015 (calculated from data in
ONS, 2016). It is growing quite quickly, with an estimated 13% year-on-year increase in total
sales in July 2016 (ONS, 2016). By comparison, another estimate of online grocery sales in
the UK, which included sales by online-only (i.e. pure-play) as well as store-based retailers
indicated total sales of £8.6 billion in 2015 (Mintel, 2016c).
It has been estimated that online grocery sales could continue to gain market share over the
next few years, with one forecast suggesting that these sales will account for 9.1% of total
grocery sales in the UK by 2020 (Mintel, 2016c). However, there are a range of growing and
future pressures that are likely to face online grocery retailers in the UK that are likely to result
in a downward pressure on their individual market shares. These include: (i) the growing
importance of the restaurant and takeaway food delivery sector and its major players including
Just Eat, UberEATS, Amazon Restaurants and Deliveroo; (ii) growing food product lines and
competitive pricing from store-based discount retailers; (iii) efforts by food manufacturers with
branded products, such as Unilever and Reckitt Benckiser, Unilever and Diageo to sell online
directly to consumers (Fung Global Retail & Technology, 2016).
The online grocery and food shopping market in the UK constitutes a far greater proportion of
total food sales than in other Western economies. Estimates on online fast-moving consumer
goods (FCMG) sales as a proportion of total national FMCG sales in the UK in June 2016
were 6.9%, compared with only 0.4% in Italy, 1.2% in Germany, 1.4% in the USA, 1.7% in
Spain and the Netherlands and 5.3% in France (Kantar Worldpanel quoted in Fung Global
Retail & Technology, 2016).
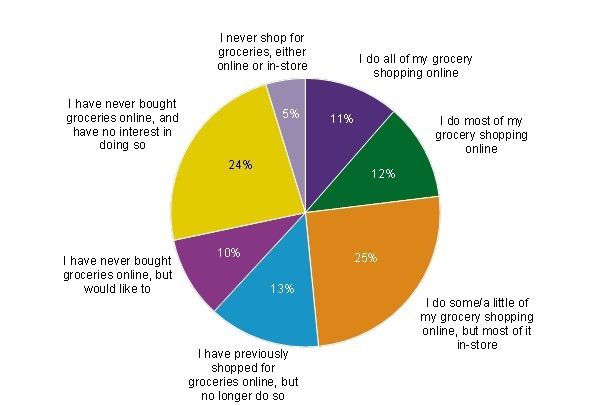
Market research has shown that almost half (48%) of shoppers in the UK use grocery online
shopping to a greater or lesser degree (see Figure 2.4 - Mintel, 2016c). It is estimated that
11% of UK consumers do their grocery shopping exclusively online (Mintel, 2016c).
10Figure 2.4: Current usage of online grocery shopping in the UK, December 2015
Notes:
Question asked: “Thinking about grocery shopping, which one of the following best describes your
use of online shopping?”
Sample size: 2,000 internet users aged 16+
Source: Lightspeed GMI/Mintel in Mintel, 2016c.
2.8.1 Store-based and online-only grocery retailers
The online grocery market can be subdivided into two types of retailer; those that are store-
based and those that are not. The former includes the major grocery retailers such as Tesco,
Sainsbury and Asda. The main player in the online-only sector is Ocado. Other suppliers in
this sector include fresh food box suppliers, and the new entrant Amazon. Table 2.9 shows
the importance of these two sub-sectors and the players within them.
Table 2.9: The importance of store-based and online-only grocery retailers in the UK in
2015
Type of Share of UK online Specific retailers Share of UK online
grocery grocery market (%) grocery market (%)
retailer
Tesco, Sainsbury, Asda 48%
Store-based 74%
Other 26%
Ocado 14%
Online-only 26% Food box suppliers (inc. Abel &
12%
Cole, Graze, Fresh) and others
TOTAL 100% 100%
Source: Calculated from data in Mintel, 2016c.
11Table 2.10 shows the online sales and online market shares of the leading online grocery
retailers in the UK in 2015. This indicates the predominance of Tesco, followed by Sainsburys,
Ocado and Asda.
Table 2.10: UK grocery retailers’ estimated net online sales and market shares in 2015
Net sales Online market
(£ million) share (%)
Tesco 3,051 38.2
Sainsbury's 1,232 15.4
Ocado 1,108 13.9
Asda 951 11.9
Waitrose 329 4.1
Morrisons 145 1.8
All others 14.7
Source: Mintel, 2016c (from companies’ reports and accounts and Office of National Statistics)
In terms of store-based grocery retailers, Tesco’s online grocery sales accounted for
approximately 7% of its total sales in 2015, compared with approximately 5% for Sainsbury’s
and Waitrose and 4% for Asda – see Table 2.11. In addition, online general merchandise
sales accounted for an additional 1-1.5% of total sales for these retailers in 2015 (Mintel,
2016).
Table 2.11: Leading online grocery retailers’ online sales as % of their total UK sales in
2015
UK grocery retailer Online sales as % of
total group sales
Tesco 7.0%
Sainsbury’s 4.7%
Waitrose 4.7%
Asda 4.3%
Morrisons 1.4%
Note: Companies’ online sales include non-grocery categories, except for Tesco.
Source: Fung Global Retail & Technology, 2016.
For several years since its establishment Ocado had been the only online-only grocery retailer
in the UK. However, Amazon has now entered this market in the UK. Amazon directly entered
the online grocery market in 2015 by offering a small ambient food product range, through a
division called Amazon Pantry. Over time Amazon Pantry has continued to expand its range,
however has a distinct lack of fresh produce which many online customers would need to
acquire from elsewhere.
Expanding on its existing Amazon Pantry offer, Amazon introduced Amazon Fresh in the UK
in June 2016. This service offers approximately 15,000 items, including fresh food, perishables
as well as branded goods such as Coca-Cola, Kellogg’s and Danone. As part of this service,
Amazon has also signed a deal with Morrisons to supply fresh and packaged private-label
products as well as products from about fifty premium local producers, shops and markets in
London. The Amazon Fresh service is available to Amazon Prime members (a subscription
service that costs £79 per year in the UK. Members pay an additional £6.99 per month for
Amazon Fresh). Amazon Fresh provides same-day delivery for orders placed before 13:00
see section 3.9.2 for further details).
122.8.2 Smaller and non-specialist retailers
There are also many smaller online food retailers in the UK who do not offer a full range of
groceries. Some specialise in particular products such as specific foods, including wine, or
vegetable or other food boxes (such as Graze, Abel & Cole, Riverford and HelloFresh). Table
2.12 shows the most important of these other online food retailers in terms of net revenues
together with their market shares.
Table 2.12: Smaller online grocery retailers’ estimated net revenues and market share
of the online grocery sector in the UK in 2014
Retailer Net sales Online
(£ million) market share
(%)
Direct Wines 186.6 2.6
Graze 68.1 1.0
Abel & Cole 73.5 1.0
The Wine Society 75.8 1.1
M&S online 63.7 0.9
Naked Wines 45.2 0.6
Milk&more 57.0 0.8
Amazon est. 44.1 0.6
Riverford 47.2 0.7
Virgin Wine 35.7 0.5
Majestic Wines 31.1 0.4
HelloFresh 9.0 0.1
Sum of the above 737.0 10.4
Source: Mintel, 2016c (from companies’ reports and accounts and Office of National Statistics)
2.9 Takeaway and other restaurant home-delivered meals market and market
developments
It has been estimated that the UK takeaway and other restaurant home-delivered food market
was worth approximately £6.7 billion in 2015, up from £4.4 billion four years ago (Fedor, 2016;
Martin, 2016). This is forecast to increase to £7.6 billion by 2020 (Euromonitor International
quoted in Ruddick, 2015). This sector consists of ready to eat meals from both takeaway and
eat-in restaurants.
The current and forecast growth in the takeaway and restaurant home-delivered meal market
are based on many consumers wanting to save meal planning, cooking and shopping time for
more important or enjoyable activities, while also enjoying food from their favourite
restaurants. Over time, it is likely that this desire for convenience will result in ever-greater
levels of home delivery of groceries, prepared ingredients/recipes and ready-to-eat meals,
which will erode the dominance of traditional store-based grocery retailers (Mignot, 2015).
Whilst individual restaurants and restaurant chains have been expanding their home delivery
services in a gradual manner, most of the growth in the market has resulted from the launch
and growth of third-party service providers, who offer meal deliveries from multiple restaurants.
These third-party providers are intermediaries between the restaurant and customer and vary
in terms of the services they provide to restaurants. Some offer full offer ordering, payment
and delivery services, while at the opposite end others simply provide a website or app to put
13the consumer in contact with the restaurant, which is then responsible for delivery and
communication with the customer. Companies that do not provide their own delivery services
(such as Just Eat and Hungry House) charge commission of around 10-15% of each order
value (BMI Research, 2016). This compares with commission charges that can be even higher
in the case of online meal providers that do provide their own delivery services (such as
Deliveroo, UberEATS and Amazon) (see section 3.10 for further details). Table 2.13 shows
a selection of the major third-party service providers in the UK, their coverage and the range
of services they offer (either just ordering or ordering and delivery).
Table 2.13: Selected leading takeaway and restaurant meal delivery third-party online
providers in the UK in 2016
Brand Website Service type Number of UK
restaurants
delivered from
Just Eat just-eat.com Ordering platform 26,700
Hungry House hungryhouse.co.uk Ordering platform 10,000+
Takeaway.com takeaway.com Ordering platform 5,000+
Deliveroo Deliveroo.co.uk Ordering & delivery 2,000+
platform
One Delivery one-delivery.co.uk Ordering & delivery 500+
platform
Just-FastFood just-fastfood.com Ordering & delivery N/A
platform
Take Eat Easy takeeateasy.co.uk Ordering & delivery 140+
platform
Notes:
As at April 2016.
N/A – not available.
Takeaway exited the UK market in August 2016 trading its restaurant base with Just Eat in return for
the latter’s Benelux business (discussed in text below).
Just Eat purchased Hungry House in December 2016 for £200 million plus performance related
bonuses – the deal will need to be approved by the Competition and Markets Authority (Ambrose, 2016).
Source: Mintel, 2016b.
There has been substantial investment in the takeaway and home-delivered meal market in
the last few years. It has been estimated that nearly $10 billion (8.9 billion euros) was invested
into 421 meal delivery deals since the start of 2014 according to research from CBInsights
(quoted in Auchard, 2016).
Delivery Hero, established in Germany in 2011, was a small start-up company with 7 staff
(Martin, 2016). However, it has grown quickly over recent years – it now operates in 34
countries, has annual sales of more than £25 million and has more than 2,500 employees. It
purchased Hungry House in the UK in 2012 (BMI Research, 2016; Martin, 2016). It provides
a third-party platform linking consumers and more than 200,000 restaurants, of which
approximately 11,000 are in the UK, and handles approximately 30 million orders for meals
worldwide each month (Martin, 2016). In 2015 it was valued at $3.1bn (£2.18bn), making it
Europe’s second most valuable privately-owned internet company. It does not operate its own
delivery services.
Like Delivery Hero, Just Eat is another third-party provider without its own delivery services. It
has grown rapidly over recent years, with annual sales increasing from approximately £10
14million in 2009 to £157 million in 2014 to £248 million in 2015 (BMI Research, 2016; Martin,
2016). In 2015 its order numbers increased by 57% on the previous year to 96 million, with a
total food spend of £1.7 billion. It is Europe’s largest third-party home-delivered meal platform
provider.
The marketplace for takeaway and other home-delivered meals is exceptionally competitive.
Some market analysts are sceptical about the extent to which companies that do not provide
its own delivery services (such as Delivery Hero/Hungry House and Just Eats) can continue
to expand at such rapid rates, believing instead that the future lies in companies that provide
an entire service including delivery (see section 3.10.2 for further discussion of this issue).
For instance, Deliveroo launched its meal home delivery service in the UK 2013. It currently
operates in 81 cities globally, working with 15,000 restaurants that wouldn’t otherwise offer
deliver including Pizza Express, Prezzo and Gourmet Burger Kitchen. Deliveroo’s daily orders
have grown tenfold since January 2015 (Tugby, 2016). Deliveroo tends to currently focus on
more expensive restaurants and uses its own couriers (self-employed and mostly bicycle-
based) to make the meal deliveries to consumers. It presently has about 3,000 delivery
couriers (who went on strike in August 2016 over their pay rates - Farrell, 2016). Domino’s
Pizza, which operates its own takeaway and home delivery pizza restaurants together with its
own in-house motorcycle-based delivery services, has also experienced major sales growth
in the UK, with a 21% increase in its quarterly sales in Autumn 2015 (Ruddick, 2015).
Uber (UberEATS) and Amazon have both recently commenced services in the UK meal home
delivery market and, as with Deliveroo, both have their own delivery services (Auchard, 2016).
Amazon commenced its delivery service with 100 restaurants in specific London postcodes in
September 2016. The service is currently only available to Amazon Prime customers, which
costs £7.99 per month or £79 per year. Customers order their meals via an Amazon app and
receive free delivery within 60 minutes on orders of £15 or above and are not charged any
mark-ups on the restaurants’ normal prices. Restaurants using this Amazon service include
the Italian chain restaurant Strada, specialist ethnic chain restaurants, and a Michelin-starred
Indian restaurant (Farrell, 2016).
UberEATS was launched in London in June 2016 providing a guaranteed 30-minute delivery
time, with no minimum order size or delivery fees charged to the customer (with the restaurant
paying a commission on the total price charged). This compared with some competitors who
charge the customer delivery fees, and some that require minimum order sizes (Auchard,
2016). However, UberEATS has announced it will introduce variable delivery prices soon that
will be based on the level of demand in any given location (Dreier, 2016).
Amazon and UberEATS hope that their scale of operation will give them a competitive
advantage over their competitors that may not be able to match their scale of operations and
logistics capabilities. As their order levels increase they will also benefit from cheaper transport
costs due to the reduced distances between restaurants and consumers. However, Amazon
and UberEATS will have to compete with other rival companies for the meal delivery market
in each city they choose to provide services. They also have to overcome the concerns of
restaurant chains to enter into business with them – Amazon’s previous efforts to work with
major retailers and Uber’s difficulties with taxi associations suggest that this will provide them
with a challenge (Auchard, 2016).
Some mergers and acquisitions are already taking place in the UK online meal restaurant
industry. For example, in August 2016 Just Eat and Takeaway agreed to trade assets, with
Takeaway exiting the British market which Just Eat is dominant in, and in exchange Just Eat
gave Takeaway, its Benelux business portfolio (Auchard, 2016). In addition, Just Eat
purchased Hungry House in December 2016 for £200 million plus another potential £40 million
depending on meeting performance targets. As this latter deal involves the largest online meal
15platform provider in the UK market purchasing the second largest this deal will require
approval from the Competition and Markets Authority (Ambrose, 2016).
In addition, some niche providers are also entering the home-delivered market. A niche third-
party platform called Supper, offering meals from top-end restaurants including those that
have Michelin stars, was launched in September 2015. Another niche platform provider
specialising in vegan lunchbox delivery in London (Mojo Box) was launched in March 2016;
while ‘Feast’ was launched in London in 2015 offering night-time food delivery services
between 23:00-05:00 (Mintel, 2016).
Home delivery services for fast food are also being launched. Kentucky Fried Chicken (KFC)
began trialling home deliveries in 100 restaurants in the USA in 2015. while Burger King has
been trialling home delivery in the UK since 2015. Some third-party providers already offer
established fat-food deliveries from major chains in the UK including One Delivery which was
launched in 2013 and Just-FastFood (Mintel, 2016).
It should also be noted that, reflecting the ferocity of competition in this market and the extent
to which start-up companies were able to receive funding until recently, some companies in
marketplaces outside of the UK faced major struggles or went out of business in 2016. In
America, SpoonRocket went out of business in March 2016, selling some of its assets to a
Brazilian company. Square Inc. has been trying to sell its Caviar food delivery arm, and
Munchery, which both cooks and delivers food, was said to be struggling to raise new funds.
DoorDash and Postmates (which also delivers non-food goods) managed to raise new funding
but found this far more difficult than previously. In addition, several food delivery companies
have merged or closed in India in 2016 (Newcomer, 2016).
It has been reported that in the UK, Just Eat, which primarily targets the takeaway market, has
typical order values of approximately £16, while Deliveroo which includes far more restaurants
has average order values of between £25 and £30 (Fedor, 2016).
2.9.1 The “food-to-go” market
In addition to the takeaway and restaurant home-delivered meals market there is also the
increasingly important, broader, so-called “food-to-go” market which includes all ready-to-eat
food. This market has become increasingly popular over recent years in the UK as consumer
eating trends have shifted substantially at a time when people are becoming increasingly short
of time to prepare and consume food and drink. This food-to-go market now includes
breakfast, lunch, evening meals, snacks and drinks. An analysis of the food-to-go market in
the UK by the Institute of Grocery Distribution (IGD) showed that it was worth £16.1bn, an
increase of 6.8% on the previous year (Tugby, 2016). The IGD forecast that this market will
grow to £21.7 billion by 2021 (IGD, 2016). The IGD’s breakdown of this food-to-go market into
its five constituent segments is shown in Table 2.14.
At present the UK food-to-go market does not typically involve home delivery but this is likely
to change in future with MacDonalds already having introduced home delivery trials, and
Sainsbury’s having acquired Home Retail Group (the owner of Argos) as part of its mission to
serve its customers “whenever and wherever” they want, and its recent expansion of same-
day deliveries to 30 of its stores (Tugby, 2016).
16Table 2.14: The Food-to-Go Market in the UK in 2016
Food-to- go segment Some key operators Turnover in 2016
Quick-service restaurants McDonald’s, Burger King, plus other £5.0 billion
premium burger chains
Food-to-go specialists Pret a Manger, Greggs, and other £4.6 billion
sandwich chains
Coffee specialists Costa, Starbucks and Caffè Nero £2.7 billion
Convenience, forecourt and other Petrol stations, convenience stores £2.5 billion
retailers
Supermarkets and hypermarkets All the major supermarkets £1.2 billion
TOTAL £16.1 billion
Source: IGD, 2016.
2.9.2 Consumer use of takeaway and other restaurant home-delivered meal services
Research shows that more than 80% of UK consumers make use of takeaway and other
restaurant home-delivered meals. However, most people do this on an occasional basis, with
only 13% purchasing a meal at least once a week directly from the restaurant and 6% through
a third party provider (based on an internet survey of 2,000 respondents - Mintel, 2016).
Eighty-three per cent of UK consumers have ordered a meal for takeaway/home-delivery
directly from a restaurant at some time, compared with 43% of consumers who have ordered
from a third-party platform. Highest usage rates are among those aged 16-44 (with 19% of
these consumers ordering a meal at least once per week) and those consumers with children
(Mintel, 2016b).
Figure 2.5: Frequency of home delivery/takeaway usage in the UK (December 2015)
Notes:
Based on responses of 1,677 internet users aged 16+ who use takeaway/home delivery.
Question asked: “For which, if any, of the following reasons would you typically order a takeaway/home
delivery?”
Source: Mintel, 2016b.
17Convenience is a major factor in the ordering of food takeaways/home deliveries. Figure 2.5
shows the reasons given by survey respondents for placing orders, with having a treat and
saving time underlying many of the answers provided. Convenience is likely to increase as
more restaurants and third-party ordering platforms improve their online services. In addition,
online ordering allows easy ordering from any location at any time.
Most commonly mentioned reasons that deter some people from using food takeaways/home
deliveries services include: concerns about the healthiness, quality, hygiene and heat of the
food, together with delivery charges and waiting times (Mintel, 2016b).
2.9.3 Consumer ordering methods
Consumers still more commonly use the telephone to place their orders for takeaway/home
delivered meals rather than ordering by computer. Survey work in 2015 showed that 57% of
respondents had ordered by phone, 29% in person at the restaurant/takeaway, and 36% had
ordered by computer. Consumers cited ease/convenience as the reason for choosing
telephone ordering (Mintel, 2016b). Overall, 83% of respondents had ordered takeaways and
other home-delivered meals directly from a restaurant at some time, while 43% had placed
such an order through a third-party platform provider (such as Deliveroo or Just Eat) (Mintel,
2016b). However, online ordering has increasing rapidly in recent years, and is expected to
continue to do so. Domino’s (the pizza chain) which has developed an advanced online
ordering system and app generates almost 80% of all its UK deliveries from online ordering
(Mintel, 2016b). Third-party platforms such as Just Eats, Hungry House, Deliveroo and Uber
Eats have also helped to facilitate growth in online ordering and have also facilitated many
smaller, non-chain restaurants to attract online customers.
2.9.4 Online functionalities being developed and demanded
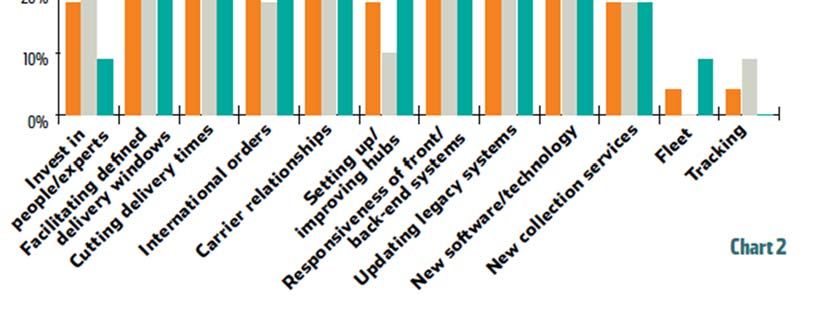
Figure 2.6: Consumer interest in online ordering features for takeaway/home delivery
in the UK (December 2015)
Notes: Based on responses of 601 internet users aged 16+ who have ordered takeaway/home delivery
online.
Question asked: “Which, if any, of the following features would you be most interested in seeing when
ordering a takeaway/home delivery online?”
Source: Mintel, 2016b.
18The tracking of meal orders is a feature that is of interest to consumers, so that they have
visibility of progress of their meal delivery. Tracking services are already provided by some
providers. This is likely to be implemented by more providers in future. Another feature that
may be introduced in future is the potential for delivery staff to communicate directly with
consumers more easily than at present. Other services being developed included online
functionality that allows consumers to search restaurants online by type of dish, rather than
by general cuisine type of the restaurant, as is common at present. Figure 2.6 shows the
online meal ordering services that consumers are interested in being made available.
2.10 Profitability in online shopping and home delivery
Despite the growth in consumer spending on online shopping in the UK (see section 2.1),
profitability in this market is a far more challenging proposition. Research has shown that the
average operating profit margins for the UK’s top-10 store-based (i.e. multi-channel) retailers
have more than halved since 2011, from 6% in 2011 to 2.5% in 2015 (OC&C Strategy
Consultants, 2016). This research also indicated that even click-and-collect home delivery
services for non-food retail (i.e. which customers collect from store themselves) cost UK
retailers four times more than traditional in-store purchases by consumers. Meanwhile, the
home delivery of parcels was found to be 5-23 times more expensive than in-store purchases
for retailers (depending on parcel size and delivery service). At the same time, consumers
were found to be unwilling to meet these home delivery costs – the research indicated that the
maximum that consumers were prepared to pay for same-day deliveries is a maximum of £4
per order (OC&C Strategy Consultants, 2016).
However, despite this mismatch between what consumers are willing to pay for online
shopping deliveries and the cost of providing these services, this is not currently causing
retailers to dramatically rethink their delivery offer and operations. Instead, in their efforts to
increase their online sales, retailers are continuing to offer faster delivery services to
customers without covering or recouping these costs.
For instance, between 2013 and 2015, the proportion of next-day delivery for non-food online
shopping increased grew by 50%. Research indicates that over the same time period, the
proportion of consumers willing to wait 3-5 days for their parcel to arrive reduced by 10%
(OC&C Strategy Consultants, 2016 - the research involved an online survey of more than
1,000 consumers).
There are concerns about the long-term profitability of online retailing for food, non-food and
takeaway food that involves home delivery services provided by the retailer (Oliver Wyman,
2015). In the last couple of years many online-only (i.e. pure-play) retailers have reported ever-
increasing revenues but minimal profits or, sometimes, even losses. Examples include Ocado,
Asos, AO.com, and until recently Amazon. Jeff Bezos, the head of Amazon, has, for the entire
22-year history of the company insisted that it is playing a long-term game, in which it
continuously increases market share rather than focuses on short-term profits (Ruddick,
2015).
Within the last year Amazon has managed to begin making profits. With $1.37 billion profits in
the first six months of 2016. Amazon can make profits in two main ways: through the direct
sale to consumers of goods on its website, or by allowing other sellers (merchants) to sell their
products via the Amazon website (on which Amazon earns a commission when merchants
sell products through the Amazon marketplace). Amazon marketplace commission rates vary
by product type from 8% - 25%, with most product categories earning Amazon a commission
rate of 15%. In the first half of 2016, Amazon’s profit margin on marketplace sales was 3.7%.
Merchants are continuously adding more products to Amazon marketplace; this increased by
22% between mid-2015 and mid-2016. In addition, merchants using marketplace can also
purchase additional services from Amazon, including the Fulfilment by Amazon (FBA) service
19(in which they pay Amazon to store and ship their goods for them), and also pay Amazon to
get their products listed as eligible for Prime shipping by Amazon. Also, in America and
elsewhere, Amazon is capturing an ever growing proportion of online sales market share.
Taking into account both goods it sells itself and goods sold on its marketplace, Amazon’s
revenue in the USA was $112.8 billion in 2015, which was equivalent to 33% of all retail goods
sold online in the United States compared with 29% in 2014. This sales growth is likely to be
substantially linked to the introduction and growth in uptake of its Prime service in which, for
an annual membership fee, members receive fast and free shipping, together with other perks.
Consumers joining Amazon Prime, tend to consolidate their online shopping with Amazon
(Enright, 2016). However, the profitability experienced in Amazon in 2016 is a new
phenomenon for the company, and has taken place at the expense of other online retailers.
Also, most other online-only do not have the same range of revenue generating sources as
Amazon.
The 2014 profit and loss statements of online-only (i.e. pure-play) retailers showed that only 5
of the 13 listed in Internet Retailer’s ‘2015 Top 500 Guide’ 1 that were publicly traded (excluding
e-retailers that are divisions of larger companies where e-retail net income is not broken out)
generated a profit in that year. Meanwhile, their median year-over-year sales increase was
approximately 15% (Enright, 2015).
The same profitability problem affects store-based (i.e. multi-channel) retailers in their online
retailing, while at the same time experiencing reduced sales levels and hence profitability at
their physical retail outlets. Although pure-play retailers do not require retail stores, the costs
of websites, advertising and especially home delivery operations are substantial. Warehouses
and fulfilment centres, together with transport operations from these stockholding locations to
the consumer are extremely expensive. In traditional shop-based retailing the costs of product
picking (and packing in the case of grocery retail), and transport to the home are borne by the
consumer. By comparison, in the case of online shopping these costs are all borne by the
retailer. The revenues that online retailers have traditionally managed to extract from
consumers for these logistics and delivery services have in no way met their costs of provision.
Some commentators have expressed doubts about whether online-only (pure-play) retailing
can ever be as profitable as store-based retailing.
It has been argued that online shopping may be leading to a situation in which online-only
(pure-play) retailers will never be profitable. In addition, it is possible that multi-channel
retailers will experience diminishing profit levels as a result of online competition from pure-
play retailers. Such a scenario would result in a retail sector in which profit rates would be non-
existent or low for all retailers (Ruddick, 2015).
Although pure-play retailers do not need to invest in physical shop networks (and the lease
costs and business rates associated with them) they do require logistics facilities (warehouses
and fulfilment centres) which are still expensive. In addition, pure-play retailers that begin life
as small start-up companies can undergo rapid expansion through both organic growth and
acquisition activity. Both of these growth models can present difficult challenges in terms of
the frequent need to relocate and expand logistics premises when demand requires, in order
to continue providing reliable home delivery services to consumers. Such decisions are
extremely time-consuming, and errors resulting from lack of action or incorrect action in terms
of logistics facilities and logistics operations can lead to serious, or in some cases even
terminal, business difficulties for pure-play retailers.
1Internet Retailer’s Top 500 is compiled from its interactive database of e-commerce leading companies
worldwide which contains rankings, profiles and business facts on each of the world's largest e-retailers (the top
1,000 in North America, and the top 500 each in Europe, Latin America, Asia, and China).
20You can also read