Broadcasting Authority of Ireland - Broadcast Authority of Ireland
←
→
Page content transcription
If your browser does not render page correctly, please read the page content below
Broadcasting Authority of Ireland

A report on market structure, dynamics and developments in
Irish media

Supplied in support of the BAI’s consultation on its Broadcasting Services Strategy

December 2017

Mediatique Limited
65 Chandos Place
London
WC2N 4HG
United Kingdom
www.mediatique.co.uk
BAI – Market structure, dynamics and developments

Executive summary
Introduction
   The Broadcasting Authority of Ireland (‘BAI’) is the regulator of the Irish broadcasting market.
   Among other statutory duties under the Broadcasting Act (2009), the BAI is required to prepare a Broadcasting
   Services Strategy (‘BSS’) covering the provision of broadcasting services in Ireland. The BAI's current BSS was
   agreed in 2011. The new BSS will reflect the current Strategy Statement in force (2017-19) covering the BAI’s
   key objectives around plurality, diversity, support for indigenous content and promotion of content in the Irish
   language.
   Mediatique was commissioned to provide a detailed overview of current and future developments in the Irish
   broadcasting landscape, and to consider the likely trajectory over the next five years. This work is aimed at
   informing the new BSS and, in particular, helping the BAI define its approach to regulation in the light of market
   dynamics over time.
   Our brief included consideration of consumer behaviour, platform and distribution developments, changes in
   technology and evolving business models associated with broadcasting.
   We were asked specifically to analyse the sustainability of revenues that underpin expenditure on audio and
   visual content, particularly Irish content, and to consider whether the current regulatory framework needs to
   evolve in line with market dynamics.
   Within our wider work, the BAI has asked for analysis on two specific topics – prospects for the launch of
   commercial digital terrestrial multiplexes carrying TV channels to supplement those already available on
   Saorview; and whether the BAI, working with industry and Government, should seek to promote digital audio
   broadcasting (‘DAB’).
   The present report constitutes our view of current and future trends and developments in the Irish broadcasting
   landscape. It includes consideration of a range of policy options the BAI may consider over the short to medium
   term, and a set of recommendations for future action.
The current landscape
   The Irish broadcast media market is mature and competitive, with multiple business models, scores of
   operators and a wide range of both domestic and international audio and video content. It is characterised by
   evolving consumer behaviour around content consumption (where and when desired), increasing fixed line and
   mobile connectivity, and growing device take-up, including of smartphones, tablets and connected TVs. New
   behaviours are most marked among younger demographics.
   The radio landscape is a mix of national, regional, local and community stations. There are currently 34
   commercial radio stations (national, quasi national, multi-city, regional and local) and 22 community stations.
   RTÉ, the publicly and commercially funded public service broadcaster (‘PSB’), is the leading radio broadcaster
   in Ireland, with four national FM stations (Radio 1, 2FM, Raidió na Gaeltachta, and lyric fm); it also broadcasts
   a further five digital-only station brands.
   The commercial radio sector is largely made up of small independent players with the exception of
   Communicorp, which operates both of the non-RTÉ national stations (Today FM and Newstalk) and Wireless
   Group (owned by News UK, a subsidiary of News Corporation), which operates local stations in major cities
   across Ireland.
   RTÉ is also the primary TV broadcaster in Ireland. A second PSB – TG4 – provides an Irish language TV channel,
   and there are two community TV channels, in Dublin and in Cork. The national commercial Irish broadcaster,
                                                                                                                           1
BAI – Market structure, dynamics and developments
TV3, operates a portfolio of channels. Irish households are also able to receive the Houses of Oireachtas TV,
and a combination of UK and international channels (including the BBC, Channel 4 and Sky One), depending on
which TV platform/service the household uses.
There are four pay TV operators, led by Sky and Virgin. Around two thirds of the 1.6m Irish TV households pay
a monthly subscription for TV; the remainder rely on digital terrestrial TV, digital (free-to-air) satellite or a
combination. Some 500,000 Irish households subscribe to monthly subscription video-on-demand (‘SVOD’)
service Netflix.
This mix of channels and services provides Irish consumers with a wide choice of viewing options (broadcast,
catch-up, on demand) on multiple devices (at home and on the move) although it does present challenges for
the sustainability of Irish content funding, as international channels and SVOD operators, for example, are able
to generate income from the Irish market but invest very little (if anything) in Irish content.
As with most European nations, the Irish broadcast market is subject to public intervention in the form of
funding and oversight:
→ All TV households must pay a licence fee, which is primarily used to fund RTÉ. A proportion of the licence
fee proceeds is ringfenced to fund schemes (operated by the BAI) for the production of Irish TV and radio
programmes and a further amount is paid over to TG4. RTÉ is also obliged to provide content to TG4.
→ The broadcast market is subject to a formal licensing regime overseen by the BAI, which licenses
commercial and community broadcasters in TV and radio (excluding, therefore, RTÉ and TG4).
→ The Irish market is subject to ownership and control limits and a range of content and advertising rules,
consistent with overall relevant European regulation.
Such intervention is arguably more pertinent in Ireland given its size and nature. The market is characterised
by a relatively small population and a language shared with much bigger markets, the UK and the US, making it
a target for foreign English-language channels without any formal commitment to investment in local content.
Without access to public funding, there is no clear likelihood that the market would deliver significant amounts
of content tailored specifically to local audience needs.
In the past five years, relative weakness in the advertising market has coincided with continued austerity
around the licence fee. With the licence fee frozen, RTÉ’s income from its share of the licence fee reduced
markedly and persistent weakness in commercial revenue generation, there has been a concomitant reduction
in RTÉ’s expenditure on content, including on programmes for TV and radio commissioned from the challenged
independent production sector.
Despite some reversal of the austerity cuts in Budget 2017 and Budget 2018, RTÉ’s licence fee income remains
well below the pre-2008 level, in both nominal and real terms. Moreover, commercial revenue has yet to return
to pre-recession levels.
Pay TV dynamics are also evolving with a recent shift from big bundles of pay TV (with or without broadband
and telephony from single supplier) toward skinny propositions and a significant impact from new entrants
such as Netflix and Amazon in the SVOD market. Traditional and new forms of pay TV subscription contribute
very little (outside sport) to Irish domestic content, even if these providers enrich consumer choice and variety.
Future developments
In common with all territories, the landscape is subject to a set of structural challenges that have led to
increasing complexity and competition in the provision of video and audio services. These relate to consumer
behaviour, technology and changing business models.
2BAI – Market structure, dynamics and developments
Broadcast viewers and listeners are increasingly able to access content from new providers across a range of
networks and connected devices. This extends choice in Irish households but adds a degree of complexity to
the landscape, not least by aiding the entry of international players to the market.
In the medium term, we do not expect fundamental, critical shifts in behaviour and technology beyond what
the current trend line would imply. Nonetheless, the direction of travel in consumer behaviour, amplified as
younger demographics move into future life stages with at least some of their current digital behaviours intact,
will create challenges for the broadcast landscape.
On this basis, traditional providers of media services will need to continue to evolve their business models. TV
broadcasters have already done so in relation to launching HD services and broadcast VOD (e.g., TV3 Player,
RTÉ Player) and experimenting with new forms of dynamic advertising but there will be more pressures to
come. Commercial radio, arguably has more to do, given the relatively limited evolution to date in strategies
and business models and the pace of change among listeners, especially younger ones.
The current media landscape in Ireland continues to sustain the creation of a significant amount of indigenous
content, both on radio and on television. Bolstered in particular by the expenditure of RTÉ, TV3 and TG4 and
commercial radio companies, amplified by funds made available through the Broadcasting Funding schemes
administered by the BAI (Sound and Vision funds), we estimate that around €225m was spent in 2016 on
indigenous Irish broadcast content (not counting Irish sport). More than 70% of this was spent on television
content.
The ability of broadcasters and content aggregators to invest in Irish content on a sustainable basis depends in
turn on their ability to generate revenues in an environment of significant disruption and challenge.
The key revenue streams that continue to fund Irish content are subscription, advertising and the licence fee.
Two of these revenue segments (the licence fee and advertising) have been under significant threat, with
implications for the profitability of commercial operators in the relevant segments of the Irish market and for
the amount spent on original content more generally.
In revenue terms, we predict a transition over the next few years toward greater adoption of lower-cost pay
TV packages, and hybrid services including linear and non-linear content, at the expense of large-scale pay TV
propositions. This is will see overall pay TV revenues per household decline, even as new models such as SVOD
grow. On current trends, pay TV will deliver lower margins over time, although this is unlikely to have an impact
on Irish content expenditure as pay TV providers are not significant contributors to indigenous content today.
Advertising, similarly, will be under pressure. Commercial radio revenues (including those accruing to RTÉ) have
declined significantly since the recession, to €127m in 2016, compared to €140m in 2007. TV advertising has
similarly been weak, dropping from a pre-recession high of €311m in 2007 to €240m in 2016. Our analysis
suggests that advertising for both radio and TV will be flat at best over the next five years, following downturns
in 2017 and 2018.
Barring any change to the licence fee (collection and/or modernisation) the two mainstays of Irish AV content
funding – public funding and commercial advertising – will be further threatened on current trends.
We have identified a number of means by which the TV and radio sectors might themselves innovate to improve
revenue generation – including concerted radio industry co-operation to re-position radio as a premium
advertising product; greater integration of broadcast services with non-linear propositions and social media;
and further exploration of new business models such as podcasting and tailored or programmatic advertising.
However, these innovations are unlikely on their own to deliver significant gains.
Meanwhile, the competitive landscape for commercial radio remains variable across the country. Outside
Dublin, there are fewer stations available to the average listener and potential gaps in formats and genres.
3BAI – Market structure, dynamics and developments
While there is scope to award 1-2 additional FM licences, this would not on its own easily address the
unevenness in current commercial radio provision.
Regulatory challenges and options
There are a number of regulatory developments that might enhance the ability of the Irish media sector to
develop and fund Irish content, to secure and strengthen the balance between international and domestic AV
content and to meet public service objectives around plurality, diversity, and citizenship values.
An important development may be the changes to the licence fee contemplated by Government currently, and
other reform around public funding, including so-called ‘re-transmission’ fees (the payment by pay TV platforms
to suppliers of free-to-air channels, including RTÉ). How these affect the ability of RTÉ, TG4 and other
organisations to fund original content could be transformative. The nature of PSB funding and the role of RTÉ
in particular are the subject of the BAI’s five-year PSB Review and are not within the scope of the present report.
The key policy options identified in our report include:
→ Further improvements to the BAI’s administrative capabilities, including faster response times on
regulatory engagement and more regular communication with stakeholders.
→ Potential changes to the regulatory environment governing commercial radio, including further detailed
review of the prospects for promoting a full-scale launch of DAB, introducing new FM services, considering
the case for further modest deregulation of ownership restrictions and liberalising the rules governing
local opt-outs for advertising.
→ Introducing a new content funding levy applied to Irish and international broadcasters that carry Irish
advertising, including channels operating under licence within the European Union but outside Irish direct
jurisdiction (so-called ‘opt-out’ channels).
→ Preparing for a post-Brexit regulatory environment, particularly in the context of licensing TV channels
under Section 71 of the Broadcasting Act, in the event that channels currently licenced in the UK seek to
be licensed in Ireland.
→ Proceeding with the proposed reform of the BAI levy mechanism which underpins the funding of the BAI’s
operations (as proposed by current draft amendments to the Broadcasting Act); this reform may also help
in the transition to a post-Brexit era, as channels moving from Ireland to the UK may seek an Irish licence,
and thereby become subject to a reformed BAI levy.
→ Keeping a watching brief on search and navigation trends, including consideration of whether, in a post-
Brexit scenario, the BAI review its licensing policy in relation to Electronic Programme Guides.
→ Inaugurating a regular (annual) report on the Irish media and communications markets, tracking platform
penetration, device take-up, consumer usage and revenue generation.
4BAI – Market structure, dynamics and developments
Contents of this report
1. Project scope and introduction .................................................................................................... 7
2. Current structure and dynamics in the Irish broadcasting landscape ............................................. 9
3. Needs and preferences of broadcasting audiences in Ireland ...................................................... 40
4. Future structure and dynamics in the Irish broadcasting landscape............................................. 51
5. Future models and sustainability of independent broadcasting in Ireland ................................... 61
6. Future policy options: digital terrestrial television and digital radio in Ireland ............................ 73
7. Future requirements for broadcasting regulation in Ireland ........................................................ 82
8. Findings and recommendations.................................................................................................. 90
9. Appendices ................................................................................................................................ 94
Important information
Mediatique is a research and advisory firm working across the media and communications sectors. It may work or have worked
for companies and organisations mentioned in this report.
The views, analyses and conclusions expressed herein are those of Mediatique and no other party, and should not be construed
as representing, in whole or in part, the opinions of the BAI.
Any opinions, forecasts or estimates herein constitute a judgement as at the date of this document. There can be no assurance
that future results or events will be consistent with any such opinions, forecasts or estimates; no representation or warranty,
express or implied, is made regarding future performance.
In preparing this report, Mediatique reviewed a number of public sources as well as interviews with organisations and
stakeholders. The sources used by Mediatique in the compilation of this report are believed to be accurate but Mediatique takes
no responsibility for the accuracy of information derived from third-party sources.
Contact details
Mediatique Limited
65 Chandos Place
London
WC2N 4HG
United Kingdom
+44 (0) 20 7836 5050
www.mediatique.co.uk
Mediatique Limited is a registered Limited company in England and Wales, Company No. 4575079.
Registered Office: 130 Shaftesbury Avenue, London, W1D 5AR
5BAI – Market structure, dynamics and developments
Table of figures
Figure 1: Comparable country data, selected metrics, 2016 (or latest full year available) .......................................................... 10
Figure 2: Internet connectivity in Ireland, 2012-17 ...................................................................................................................... 11
Figure 3: Ownership of connected devices, 2012 – 2017 (% of total population) ....................................................................... 12
Figure 4: TV homes by platform, 2013 – 2017 (% of TV homes) .................................................................................................. 14
Figure 5: TV homes, 2012 - 2017 (% of total households)............................................................................................................ 15
Figure 6: Communications services bundling, 2012 - 2017 .......................................................................................................... 16
Figure 7: VOD access 2013 - 2017 (% of TV households) ............................................................................................................. 17
Figure 8: Dynamics within the pay TV market, 2013 - 2017 (% of TV homes) ............................................................................. 19
Figure 9: Live television viewing, 2012 - 2016 (average minutes per day)................................................................................... 20
Figure 10: PVR ownership and broadcaster VOD access, 2012 - 2017 ......................................................................................... 20
Figure 11: Consolidated television viewing, 2012 - 2016 (minutes per day) ............................................................................... 21
Figure 12: Video viewing by format, Adults 15+, 2017 (% of total minutes)................................................................................ 21
Figure 13: Share of TV viewing on the TV set, 2016 (% of total minutes) .................................................................................... 22
Figure 14: Share of TV viewing by broadcaster group, 2016 (% of total minutes) ....................................................................... 23
Figure 15: Total content spend by broadcaster, 2016 (€m) ......................................................................................................... 24
Figure 16: RTÉ original content spend by genre, 2007 and 2016 (€m) ........................................................................................ 24
Figure 17: RTÉ spend on independent commissions and total hours by breakdown (statutory/non-statutory), 2016 (€m) ...... 25
Figure 18: TG4 total content spend by genre, 2007 - 2016 (€m) ................................................................................................. 26
Figure 19: Total value of projects availing on Section 481, by genre 2011 - 2016 (€m) .............................................................. 28
Figure 20: Value of Oireachtas Grant to Irish Film Board, 2008 - 2016 (€m) ............................................................................... 29
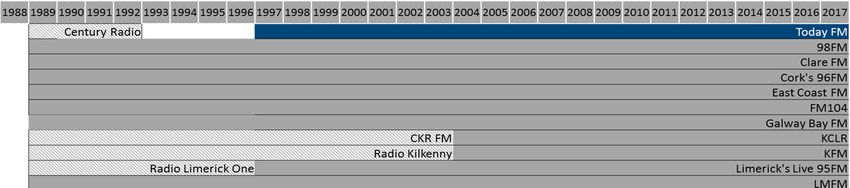
Figure 21: Timeline of commercial radio licensing, 1988 - 2017 .................................................................................................. 30
Figure 22: Radio licences, 1988-2017 ........................................................................................................................................... 31
Figure 23: Mean daily minutes of live radio listening, 2010 - 2016 ............................................................................................. 32
Figure 24: Mean daily minutes for radio listeners and population, 2010 - 2016 (mins) .............................................................. 33
Figure 25: Total audio consumption by type by age group, 2016 ................................................................................................ 33
Figure 26: Radio consumption by device for Adults 15+ and Adults 15 - 24, 2014 – 2016 .......................................................... 34
Figure 27: Radio reach (%) by daypart, Jan - Dec 2016 ................................................................................................................ 35
Figure 28: Radio station reach, Adults 15+, 2012 – 2016 ............................................................................................................. 36
Figure 29: Share of listening, 7am-midnight, by radio station group, 2012 versus 2016 (%) ...................................................... 36
Figure 30: Breakdown of RTÉ's radio hours by genre, 2015......................................................................................................... 37
Figure 31: Sound & Vision spend per sector, 2012 - 2017 (€m) ................................................................................................... 38
Figure 32: Sound & Vision 3 grant payments and projects by broadcaster, 2016-2017 (€)......................................................... 39
Figure 33: Forecast consolidated TV viewing minutes (average per person per day) ................................................................. 51
Figure 34: Adults 15+ population weighting, 2016 - 2022 ........................................................................................................... 52
Figure 35: total TV consumption, all devices, 2022 (% of total minutes) ..................................................................................... 53
Figure 36: TV platform forecasts – share of TV homes, 2022 ...................................................................................................... 54
Figure 37: SVOD penetration by TV home main platform, 2022.................................................................................................. 56
Figure 38: Average daily minutes of live radio listening, 2010 – 2022 ......................................................................................... 57
Figure 39: Share of audio listening, 2022 (% of total listening minutes, excluding music video) ................................................ 59
Figure 40: Total advertising expenditure in Ireland, 2011 - 2016 (€m) ........................................................................................ 63
Figure 41 - GDP / TV advertising expenditure real-terms growth, Ireland, 2005-2016 (2005=100). ........................................... 64
Figure 42 - TV advertising expenditure real-terms growth vs CLI growth, Ireland, 2005-2016 ................................................... 64
Figure 43: RTÉ total income versus content expenditure, 2007 - 2016 (€m) ............................................................................... 66
Figure 44: DAB timetable ............................................................................................................................................................. 76
6BAI – Market structure, dynamics and developments
1. Project scope and introduction
Background and methodology
1.1 The Broadcasting Authority of Ireland (‘BAI’) is the regulator of the Irish broadcasting market. It licences TV
and radio channels and stations other than RTÉ, TG4, the Houses of the Oireachtas channel and the Irish Film
Channel1, and is the content regulator for all broadcast content, overseeing codes and rules and enforcing
them.
1.2 It administers Broadcasting Funding schemes dedicated to the support of Irish originated content and is
responsible for annual performance reviews of RTÉ and TG4 and for broader five-yearly reviews of public
service funding (extending to a consideration of the strategic plans of RTÉ and TG4, the adequacy of public
funding and international benchmarks). More generally, it is a source of thought leadership and research into
issues affecting the media landscape.
1.3 The BAI has a critical role in encouraging plurality and distinctiveness of media provision in Ireland, promoting
content in the Irish language and ensuring the creation and distribution of content that is culturally relevant
for Irish audiences.
1.4 Among other statutory duties under the Broadcasting Act (2009), the BAI is required to prepare a
Broadcasting Services Strategy (‘BSS’) covering the provision of broadcasting services in Ireland. The BAI's
current BSS was agreed in 2011. Given changes in the broadcasting landscape since that time, the BAI is
seeking to develop an informed view on market outcomes in the short to medium term as an input to its
revised, updated strategy. The new BSS will reflect the current Strategy Statement in force (2017-19) covering
the BAI’s key objectives around plurality, diversity, support for indigenous content and promotion of content
in the Irish language.
1.5 Mediatique was commissioned to provide a detailed overview of current and future developments in the
Irish broadcasting landscape, and to consider the likely trajectory over the next five years, to inform the BAI's
approach to regulation in the light of structural change.
Our brief included consideration of consumer behaviour, platform and distribution developments,
changes in technology and evolving business models associated with broadcasting.
We were asked specifically to analyse the sustainability of the revenue models that underpin
expenditure on audio and visual content, particularly Irish content, and to consider whether the current
regulatory framework needs to evolve in line with the identified market dynamics.
Within our wider work, the BAI has asked for analysis on two specific topics – prospects for the launch
of commercial digital terrestrial multiplexes carrying TV channels to supplement those already available
on Saorview; and whether the BAI, working with industry and Government, should seek to promote
digital audio broadcasting (‘DAB’).
1.6 The present report constitutes our view2 of current and future trends and developments in the Irish broadcast
landscape, informed by a range of sources:
We analysed several third-party data sources to identify current outcomes and trendlines and to
consider policy developments and options, including JNLR, Nielsen, ZenithOptimedia and a range of
reports published by the Department of Communications, Climate Action and Environment, ComReg
1
Not launched to date.
2
The views in this report do not necessarily represent those of the BAI, and Mediatique is not providing advice on future
regulation other than for the consideration of the BAI. It is not Mediatique’s role, and nor should it be inferred, to determine
policy choices to be communicated to Government, which is solely the responsibility of the BAI.
7BAI – Market structure, dynamics and developments
and RTÉ. We also reviewed an array of previous reports and analyses produced by and for the BAI, and
reviewed stakeholder submissions on various topics where relevant. Key published sources used in our
research are referenced in the text or footnotes.
We also considered international benchmarks to identify potential future developments in the Irish
market, and policy responses where relevant, including close neighbour the UK, other European Union
member countries (with a focus on smaller markets within this cohort) and more widely.
To inform our work, we commissioned Kantar Media to undertake a survey of Irish households to
determine consumer preferences, behaviours and viewpoints on the broadcast market; this included
eliciting claimed current and future media consumption behaviours and opinions on the quality of
distinctiveness of broadcast media provision.
We undertook detailed interviews with primary sources across the Irish market including stakeholders
from TV and radio broadcasters, platform operators, production companies, advertising agencies,
industry groups and policy makers. We gauged stakeholder views on current and future developments
in the Irish market, and implications for sustainability of business models in broadcasting. A list of key
primary sources is set out in the appendices.
1.7 On the basis of the evidence collected through the means outlined above, we have provided forecasts of key
metrics for the period 2017-22, as a base case. Other outcomes are of course possible, and we have identified
a potential scenario within the model period that could arise as a result of more disruptive shifts in behaviour
and/or changes in technology and consumer propositions.
Report structure
1.8 The structure of this report reflects the issues we were asked to address:
Section 2 sets out the current structure and dynamics of the Irish broadcasting landscape, including the
role of key broadcasters and platform operators, and the likely trends in viewing and listening;
Section 3 details the findings of our consumer survey, setting out the key needs and preferences of Irish
audiences including viewpoints on the importance of Irish content;
Section 4 sets out how the structure and dynamics of Irish broadcast markets are likely to change over
the medium term, including forecasts of viewing and listening outcomes by 2022;
Section 5 analyses the potential implications of market developments on the sustainability and plurality
of Irish broadcasting, including the impact of changes to revenue outcomes in the medium term;
Section 6 provides in-depth analysis of the prospects and implications of further expansion of digital
broadcasting in Ireland, including digital terrestrial TV (‘DTT’) and digital audio broadcasting ‘(DAB’);
Section 7 analyses the potential policy options that the BAI might pursue to improve the ability of the
broadcast sector to meet the challenges it faces;
Section 8 lists a number of recommendations for the BAI arising from this review
A list of primary sources and a glossary of key terms are included as appendices.
8BAI – Market structure, dynamics and developments
2. Current structure and dynamics in the Irish broadcasting landscape
Overview of the current broadcasting landscape
2.1. Ireland remains a country strongly attached to broadcast radio and TV: 82% of adults 15 years of age or older
in Ireland listen to radio stations every day, while more than two-thirds of all individuals aged four and older
watch live TV channels every day.3
The radio landscape is a mix of national, regional, local and community stations. There are currently 34
commercial radio stations (national, quasi national, multi-city, regional and local) and 22 community
stations.4 RTÉ, the publicly and commercially funded public service broadcaster (‘PSB’), is the leading
radio broadcaster in Ireland, with four national FM stations (Radio 1, 2FM, Raidió na Gaeltachta, and
lyric fm); it also broadcasts a further five station brands in DAB.5
The commercial radio sector is largely made up of small independent players with the exception of
Communicorp, which operates both of the non-RTÉ national stations (Today FM and Newstalk) and
Wireless Group (owned by News UK, a subsidiary of News Corporation), which operates local stations in
major cities across Ireland.
RTÉ is also the primary TV broadcaster in Ireland, with four primary national channels (RTÉ One, RTÉ2,
RTÉ News Now and RTÉjr)6; RTÉ’s channels account for 27% of all TV viewing in 2016; of the top-20
programmes shown on Irish TV in 2016, all were on RTÉ.
A second PSB – TG4 – provides an Irish language TV channel, and there are two community TV channels,
in Dublin and in Cork. The national commercial Irish broadcaster, TV3, operates a portfolio of channels
(TV3, TV3+1, 3e and be37). Irish households are also able to receive the Houses of Oireachtas TV, and a
combination of UK and international channels (including the BBC, Channel 4 and Sky One), depending
on which TV platform/service the household uses.
This mix of channels provides Irish households with a wide choice of viewing options, although it does
present challenges for the sustainability of Irish content funding, as international channels are able to
generate income from the Irish market but invest very little (if anything) in Irish content.
2.2. As with most European nations, the Irish broadcast market is subject to public intervention in the form of
funding and oversight:
All TV households must pay a licence fee, which is primarily used to fund RTÉ. A proportion of the licence
fee proceeds are ringfenced via Broadcasting Funding Schemes (operated by the BAI) for the production
of Irish TV and radio programmes, the archiving of historical and culturally relevant broadcast
3
2016 figures. Radio reach is based on 15+ daily reach (JNLR) while TV reach is based on individuals 4+ (TAM Ireland). There
are 1.6m TV households in Ireland and a total population of 4.77m.
4
These include Community, Community of Interest and Special Interest categories, but exclude ‘‘institutional’ stations (e.g.,
hospital radio).
5
RTÉ 2XM, RTÉ Gold, RTÉ Junior, RTÉ Pulse and RTÉ Radio 1extra. The national FM stations are also carried on DAB. Potential
coverage is around 54% of households but only 20% of homes have a digital radio.
6
RTÉ also operates two HD channels – RTÉ One and RTÉ2 – and one ‘+1’ variant, RTÉ One +1, broadcasting the main channel’s
schedule an hour later. RTÉ has indicated it will seek approval to launch a second +1 service linked to RTÉ2.
7
be3 was formerly UTV Ireland. TV3 broadcasts an HD variant of its main channel in cable and satellite homes. 3e and be3 are
in HD exclusively on Virgin cable. TV3 has a +1 variant on all platforms, while TG4 has a HD channel on both cable and satellite.
TV3, TV3+1 and 3e all have the status of ‘commercial broadcaster’ under section 70 of the Broadcasting Act (2009); be3
operates under a Section 71 content provision contract initially awarded to UTV Ireland.
9BAI – Market structure, dynamics and developments
programme material, and a further amount is paid over to TG4. RTÉ is also obliged to provide content
to TG4.8
The broadcast market is subject to a formal licensing regime overseen by the BAI, which licenses
commercial broadcasters in TV and radio (other than PSB broadcasters such as RTÉ and TG4).
Regulation also provides for ‘priority’ on TV platforms for the main PSB channels, a key factor in
bolstering PSB viewing shares.
The Irish market is subject to ownership and control limits and a range of content and advertising rules,
consistent with overall relevant European regulation.
2.3. Such intervention is arguably more pertinent in Ireland given its size and nature. The market is characterised
by a relatively small population and a language shared with much bigger markets, the UK and the US, making
it a target for foreign English-language channels9 without any formal commitment to investment in local
content. Without access to public funding, there is no clear likelihood that the market would deliver
significant amounts of content tailored specifically to local audience needs.
2.4. In common with all territories, the Irish media landscape is subject to a set of structural challenges that have
led to increasing complexity and competition in the provision of video and audio services. Broadcast viewers
and listeners are increasingly able to access content from new providers across a range of networks and
connected devices where traditional (Irish) content may not be as prominently displayed. This includes
accessing video-on-demand services from the likes of Netflix and Amazon, or audio services from Spotify,
Deezer or iTunes.
2.5. These developments extend choice to Irish households but add a degree of complexity to the landscape, not
least by aiding the entry of international players to the market. The Irish broadcast market is therefore
increasingly characterised by content provision and consumption across a range of networks, providers,
devices and business models.
2.6. Current and future outcomes in Irish broadcasting will ultimately be driven by consumer and producer
decisions relating to these changing dynamics and models. In broad terms, viewers and listeners are
demanding increased functionality and choice, while content aggregators and suppliers (both legacy players
and new entrants) continue to seek competitive advantage through changes to content strategy, business
models, means of search and navigation, consumer price points and branding.
2.7. Ireland has broadly similar characteristics to a range of European cohort markets, with the exception of its
radio consumption, which is markedly higher than in other parts of the EU. A range of useful metrics is
summarised in the table below.
Figure 1: Comparable country data, selected metrics, 2016 (or latest full year available)
Metric Ireland Austria France Germany Italy Norway Switzerland UK
Population (m) 4.77 8.74 66.90 82.67 60.60 5.23 8.37 65.64
GDP per capita ($) 64,175 44,758 36,857 42,161 30,661 70,868 79,886 40,367
Fixed broadband
69% 68% 72% 86% 55% 84% 95% 87%
penetration**
Pay TV penetration** 65% 35% 76% 56% 32% 96.5%* 95%* 62%
8
The licence fee was first shared with TG4 as part of the Government’s austerity programme following the recession, whereby
a proportion of TG4’s direct grant was replaced by funds from the licence fee previously provided to RTÉ. These payments were
partially reversed in Budget 2017 and Budget 2018.
9
These non-Irish channels are licensed outside the Republic (usually the UK), and are able to distribute their services on cable
and satellite to Irish households.
10BAI – Market structure, dynamics and developments
Metric Ireland Austria France Germany Italy Norway Switzerland UK
Tablet penetration*** 52% 56% 50% 49% 63% 48% 47% 60%
Smartphone
76% 78% 77% 78% 89% 78% 72% 72%
penetration***
TV viewing per day
235 196 224 222 254 167 120 216
(minutes)
Radio listening per day
252 120 171 180 214 78 120 163
(minutes)
Source: World Bank, Ofcom ICMR, JNLR, PwC Media Outlook, Nordicom, Nkom, Mediapulse, Akamai
* This is inflated by extent of basic cable penetration. ** % of total TV households. *** % of total population
Current developments – drivers of change
2.8. The Irish broadcast media landscape, as in all mature media territories, faces both challenges and
opportunities relating to a number of major structural and behavioural shifts. We identify below the key
drivers of change in the provision and consumption of video and audio services.
Technology and connectivity
2.9. The 1.6m Irish households are increasingly connected, with broadband penetration at a high level and
download speeds increasing year-on-year – in turn allowing individuals to access internet-delivered services
which are viable complements to, or substitutes for, traditional broadcast media.
Household fixed broadband penetration rose from 56% in Q2 2012 to 71% in Q2 2017, although JNLR
and Nielsen survey data suggests household access to broadband (including mobile broadband) is up to
10 percentage points higher.
Internet speeds have been rising steadily, with 80% of fixed-line connections delivering a headline
download speed of at least 10 Mbps by Q2 2017. Although real-life download speeds rarely match
headline speeds, an advertised speed of 10 Mbps can be considered adequate for the reliable delivery
of high-quality video from an online video service such as RTÉ Player or Netflix, which actually operate
acceptably at lower speeds.
Figure 2: Internet connectivity in Ireland, 2012-17
100%
Fixed broadband
penetration
80% Nielsen
broadband access
60% JNLR broadband
accessBAI – Market structure, dynamics and developments
Ownership of connected devices
2.10. As internet penetration has risen, so has ownership of internet-connected devices such as smartphones,
tablets, and smart TVs – particularly among younger and wealthier individuals.
Figure 3: Ownership of connected devices, 2012 – 2017 (% of total population)
100% TV set
96% 92% 94%
90%
87% 87% 90% FM/AM radio
80%
76%
Car radio
70%
60% 59% Smartphone
50% 52%
45% Tablet
40% 40%
DAB radio
30% 28%
23%
20% 20% PVR*
10%
10%
8% Smart TV*
0%
2012 2013 2014 2015 2016 2017
Source: JNLR (Jan-Dec, except 2014 which is Jan-Sept); TAM/Nielsen (September reports to 2015, July data for 2016-17)
Note: * = penetration in TV homes. All other data are for all households. TV set ownership includes ‘No TV homes’ (where
applicable), so differs slightly from TAM/Nielsen TV penetration figures
2.11. Ownership of traditional broadcast receivers (TV sets and radios) has remained relatively constant alongside
increasing penetration of connected devices; such connectivity is in tandem with broadcast services. TV
providers, including platform operators and content owners, are increasingly enabling consumers with
greater control over their viewing experiences. Personal video recorders (PVRs) are now in approximately
59% of homes - allowing viewers to record and store content - and on-demand services are now available to
anyone with a broadband connection.
Changes to consumer behaviour
2.12. Individuals are seeking more control over their media consumption experiences, increasingly seeking access
to content across multiple devices at home and on the move – anytime, anywhere.
2.13. This is part of a broader demand-side shift towards greater functionality, including on-demand services, the
ability to record and playback content, high-definition video and the ability to search, store and share
content.
2.14. In practical terms, consumers are making greater use of on-demand services and viewing/listening outside
the traditional broadcast window and on multiple devices in and out of the home. Broadcast services also
face pressures on its share of leisure time from new activities such as social media and gaming.
Changes to corporate strategy
2.15. Content owners and aggregators continue to evolve strategies in response to (and in some cases to foment)
market changes. Content aggregators are increasingly seeking to deepen relationships with viewers, securing
rights across multiple windows and creating online brands that allow wider distribution.
12BAI – Market structure, dynamics and developments
Traditional broadcast players such as RTÉ have launched their own on-demand services as a means of
maintaining engagement with viewers and listeners.
Growth in connected media has reduced barriers to entry for content aggregators, and the Irish video
market has witnessed significant market entry by new international operators and vertical players seeking
to launch video services to complement hardware or other online services. The likes of Netflix and Amazon
now provide over-the-top (OTT) on-demand access to deep libraries of high-quality content.
As a result, content is now packaged in several ways, including via multiple outlets across free and pay,
subscription and discrete payments.
This in turn has had a significant impact on upstream content supply markets, particularly on content
windowing (exclusivity periods, duration of holdbacks, length and extent of windows), leading to higher
prices for a range of content, driven by greater competition, and a resultant spike on co-productions
(including with new entrants).
2.16. Regulated broadcasters face both opportunities and challenges from an evolving and converging media
landscape. This in turn has potential implications for public service outcomes, including diversity, plurality
and the sustainability of content made and distributed in Ireland.
2.17. The landscape that the BAI oversees is therefore increasingly crowded, competitive and complex. The
developments that we have identified have led to disruption and change in the broadcast market and set the
conditions for further change over time.
In the remainder of this section we provide an overview of the current structure and dynamics of the TV and
radio sectors in Ireland. In each case, we set out the distribution landscape (platforms, devices), consumption
outcomes (video viewing and audio listening) and profiles of key content suppliers.
The TV landscape
2.18. The Irish free-to-air PSBs are the RTÉ channels (RTÉ One, RTÉ One+1, RTÉ2, RTÉ News Now, and RTÉ Jr) and
TG4, with specific remits and privileges (e.g., priority on electronic programme guides, access to DTT
spectrum and public funding).
2.19. The Houses of the Oireachtas TV channel is also a PSB under the Broadcasting Act 2009, and therefore it is
specifically granted a DTT berth, although it is not regulated in the same way as RTÉ and TG4 and indeed is
subject to oversight from the Joint Administration Committee.10
2.20. TV3, and its sister channels TV3+1 and 3e, hold a ‘television programme service’ contract issued by the BAI
under section 70 of the Broadcasting Act 2009, and are given capacity on the RTÉ DTT multiplex. be3, part of
the same group as TV3, is the only free-to-air (‘FTA’) channel issued a ‘content provision contract’ under
section 71 of the Act; ahead of its launch under its old name UTV Ireland, the channel was granted access to
DTT on the multiplex operated by RTÉ by the Minister, who deemed the channel to have the “character of a
public service” under section 130. All other channels in Ireland are available on satellite, cable and IPTV, and
are in nearly every case licensed outside Ireland and are available in the Republic under European Country
of Origin (‘COO’) rules respecting licences held elsewhere in the European Union.
10
The Irish Film Channel is also deemed a Public Service Broadcasters under the Act although the channel has not launched
to date.
13BAI – Market structure, dynamics and developments
2.21. The FTA digital terrestrial TV market is relatively small compared to many other markets (e.g., the UK, Spain,
Italy and France), with a majority of households electing to pay for TV services (or to use free satellite) in
particular to access popular UK channels.
2.22. Over the past five years, viewers have benefited from greater choice of content, prices and providers, as well
as increasing choice over when and where they can watch video content.
The platform market
2.23. Irish households are able to receive TV services from a number of suppliers pursuing a range of models. Pay
services from Sky and Virgin remain the largest platforms, with FTA satellite and DTT (via Saorview and
Freeview) offering free alternatives with fewer channels and less functionality. Internet Protocol TV (IPTV) is
also emerging as a competitive alternative mode of TV transmission via eir TV and Vodafone.
2.24. Recent trends demonstrate growth in the popularity of free TV options at the expense of pay TV, which
nonetheless continues to dominate the platform market. While Ireland has only experienced a relatively
small decline in pay TV penetration - 65% of homes took pay TV services in 2017, compared to 69% in 2013
– this still brings into question consumers’ continued willingness to pay for TV services. Moreover, the
aggregate pay penetration figures hide an important dynamic – a decline in traditional ‘big bundle’ pay TV
subscriptions, particularly for Virgin, and a growth in the penetration of ‘skinny bundle’ propositions from
IPTV providers.
Figure 4: TV homes by platform, 2013 – 2017 (% of TV homes)
Sky Cable IPTV FTA Satellite UK DTT Irish DTT
100%
11% 10% 11% 12% 12%
90%
4% 6% 5% 6% 5%
80%
17% 18% 18% 16% 20%
70% 0% 1% 2% 2%
60% 5%
25% 24% 22% 21%
50% 17%
40%
30%
20% 42% 42% 41% 42% 41%
10%
0%
2013 2014 2015 2016 2017
Source: TAM Ireland/Nielsen TAM Establishment Surveys (Sept reports for 2013-15; July-Dec reports for 2016-17)
Notes: From July-December 2017, the FTA Satellite includes ‘WebTV’, defined as “broadband homes with no standard reception type
than can view broadcast content online through a smart TV or connected device”
For all years, the FTA satellite category includes viewers who receive TV channels through Sky equipment but do not pay a subscription
(commonly known as ‘churned Sky’ viewers). Until January 2017, TAM included these viewers in the Sky category, so we have used
Establishment Survey data to make this change retrospectively to the platform universes for previous years.
2.25. Recent data confirm an increase in the number of homes that do not have a TV set. The increased availability
of TV content – whether free, paid, or illegally watched – over the internet and on multiple devices means
that some consumers see no need to watch TV through traditional reception methods on a TV set.
14BAI – Market structure, dynamics and developments
Figure 5: TV homes, 2012 - 2017 (% of total households)
98%
97% 97%
96% 96% 96% 96%
‘WebTV’ category
95% added July 2017
94% 94% 94% 94% 94% 94%
93% 93% 93% 93% 93% 93% 93%
92% 92% 92% 92%
91% 91%
90%
89% TV households
88%
May-12
Dec-12
Apr-13
May-14
May-15
Jan-12
Sep-12
Oct-12
Nov-12
Jan-13
Sep-13
Jan-14
Sep-14
Jan-15
Sep-15
Jan-16
Jul-16
Jan-17
Jul-17
Source: TAM Ireland/Nielsen TAM
2.26. From July 2017, TAM Ireland have included a new category – ‘WebTV homes’ – in the FTA satellite grouping.
According to Nielsen, “WebTV homes have broadband and either a Smart TV or peripheral attached to a TV
set”11 – that is, these homes do not have a standard reception method but still have the capacity to watch TV
content on their TV sets. As of July 2017, there were 31,000 homes in the WebTV grouping. Before this point
any WebTV homes would have been categorised as ‘No TV homes’, so the change in methodology has served
to boost headline TV penetration slightly. TV content is still watched by some in the ‘No TV homes’ category:
the July 2017 data reports that 28,000 such households had access to Netflix, while 19,000 had access to RTÉ
Player.
Pay TV dynamics
2.27. Recent growth in household take-up of free TV has come despite the relative lack of investment in and
development of the Saorview platform – for example, PVR penetration among Saorview homes is only 2%,
compared to 90% in pay TV homes.12 OTT players such as RTÉ Player could only be accessed freely on the TV
set via smart TVs or streaming dongles until the launch of Saorview Connect in late 2017 – and despite the
relative difficulty (compared to more user-friendly pay TV options) of accessing all desired Irish and UK
channels through FTA satellite and aerial combinations.
2.28. The availability of UK channels on pay TV platforms may continue to be a key balancing factor for the
continuing appeal of pay TV, however. Channels such as BBC One and Channel 4 are not available on Saorview
and consumers are sufficiently willing to pay to receive these channels that the pay TV market is unlikely to
suffer considerable further decline, even if free platforms do innovate and improve. Moreover, there is
appetite for sport, film and entertainment premium content (e.g., Sky One, Sky Sports) that is only available
behind a pay wall.
2.29. However, it is the case that many Irish consumers are adept at using workarounds to access the main UK
channels for free, in addition to Irish channels. Some homes use ‘combi-boxes’, which combine aerial and
satellite feeds to deliver Irish and unencrypted UK channels (via free-to-air satellite) to the same set-top box
(Saorview Connect, the hybrid IP service, has both a DTT and a satellite tuner), or choose to toggle input feeds
11
TAM Ireland/Nielsen TAM, ‘Understanding TV data’, 2017.
12
TAM Ireland/Nielsen TAM Establishment Survey, July 2017.
15BAI – Market structure, dynamics and developments
on the TV, allowing them to receive Saorview via their inbuilt receiver or a set-top box (‘STB’), and
unencrypted UK channels through satellite or Freeview (depending on location). Thus:
74% of FTA satellite/WebTV homes receive the BBC and Channel 4, while 69% receive the Irish PSB
channels;
Nearly all Saorview and Freeview households say they can access the Irish PSB channels; and
Overall, 93% of TV households receive the Irish PSB channels, while 83% receive the BBC and Channel
4.13
2.30. On a more practical level, equipment penetration protects pay platforms to some extent, as many of their
customers would struggle to receive free Irish and UK channels without investing in aerials or satellite dishes.
Only 8% of cable and 28% of Sky households have an aerial, whether connected to a TV or not,
hampering their ability to receive FTA Irish channels if they cancelled their pay TV subscription14;
While all Sky households could technically receive FTA UK channels via their existing Sky satellite dishes,
most cable customers would have to buy a new dish or an aerial.
2.31. But most crucially, it is the convenience and ease of use which, combined with technological superiority in
the form of PVRs and VOD access as standard, offer one of the greatest advantages over FTA options – even
those which allow viewing of UK channels through convoluted means. For some customers, avoiding the
inconvenience of using a combi-box or toggling, streaming via a dongle, or recording onto a generic hard
drive (or not at all) means a monthly TV subscription is worth paying.
Communications services bundling
2.32. Virgin Media and Sky have been joined by eir and Vodafone in offering broadband, fixed and mobile
telephony and TV services. These communications bundles allow operators both to extract more value from
existing customers while reducing ‘churn’ (that is, customers leaving an operator), and to woo new customers
with propositions based on price and/or the convenience of having multiple services from one supplier.
2.33. As data from ComReg shows, customers are now taking extra services from their providers in larger numbers.
Figure 6: Communications services bundling, 2012 - 2017
100%
80% 38% 37%
44% 43%
56% 51%
60%
36% 37%
40% 36%
32%
38%
37%
20%
25% 26% 27%
20%
7% 11%
0%
2012 2013 2014 2015 2016 2017
Triple/Quad play Double play Single play
Source: ComReg (all data for Q2 of each year). Double and triple/quad play subscriptions include all possible combinations of
broadband, fixed telephony, mobile telephony and TV; not all subscriptions will include a TV package
13
Ibid.
14
Ibid.
16BAI – Market structure, dynamics and developments
2.34. The move to bundled provision and the entry of new operators with legacy fixed-line interests have combined
to shift the focus of most network operators from TV to connectivity (fixed and mobile broadband). According
to this view, TV is coming to be seen as more of a bolt-on to a core communications services package than a
service in its own right, and in some ways commoditised.
2.35. This trend is reflected in the low prices of basic TV services – incremental to connectivity contracts – from
Vodafone and eir, recognising that premium services with more channels are available for an additional fee.
Since both providers are fixed-line and mobile operators without long histories in TV, their aim is to
maximise the value they can extract from these network assets, especially given the high sunk costs
and future capex associated with this infrastructure.
Retaining customers who could be lured away by competitors’ connectivity propositions is essential in
achieving this aim. IP-delivered TV and the associated benefits of bundling are a means to this end,
rather than the core focus of these providers, although this may change as customer bases and
investments in content – such as sports rights – grow.
New players in the pay TV market
2.36. Traditional pay TV providers and FTA platforms now face competition from new entrants in the form of OTT
providers – the most common form being subscription video-on-demand (SVOD) services from the likes of
Netflix and Amazon. These allow users to stream or download films and TV programmes in return for a
monthly fee. They are characterised by rolling monthly contracts and a lack of physical equipment.
Increasingly, however, they are available on the TV set via a smart TV or internet-enabled STB (including via
Virgin’s pay TV STB).
2.37. In Ireland, by far the largest SVOD player is Netflix, which can now be found in nearly a third of households.
Launched more recently, Amazon Prime Video and Now TV have lower subscriber numbers but are backed
by large budgets and libraries of quality content.
2.38. Alongside SVOD services, broadcaster VOD players, such as 3player and RTÉ Player, have grown their user
bases. Both free and subscription VOD services offer TV-quality content that can be viewed unbound by the
temporal and location restrictions of traditional linear TV and through search and navigation mechanisms
untethered to standard EPGs; that is, viewers can watch on multiple devices and whenever they want (subject
to rights restrictions on content availability). Access to these VOD services is growing, as we illustrate below,
as viewers become increasingly connected.
Figure 7: VOD access 2013 - 2017 (% of TV households)
35% SVOD
30% RTÉ Player 31%
27% 26%
25% 3player 25%
20% 19%
18% 18% 18%
15%
10% 11%
8% 9%
5% 5% 7%
5% 6%
0%
2013 2014 2015 2016 2017
Source: TAM Ireland/Nielsen TAM. SVOD = (2013-15) regular subscription to download/stream TV content, (2016-17) have access to
Netflix – this is used as a proxy for all SVOD due to TAM question changes
17You can also read